1. INTRODUCTION
Citation counts are now utilized as a proxy for assessing the quantity and quality of published articles (Nieminen et al., 2006). Measures of citation impact, such as h-index and journal impact factor (Garfield, 1972; Hirsch, 2005; Waltman, 2016), gauge the influence of scientific publications by analysing the citations they have received. Although there exist some critics of these indicators (Koltun & Hafner, 2021; Seglen, 1997), they are still commonly employed for research evaluation purposes (Wang et al., 2022). Since they demonstrate how a publication has incorporated the contents of other publications (research findings, other people’s thoughts, etc.), citation counts or the number of citations are employed in research evaluation as an indication of research impact (Bornmann et al., 2008). By tallying the number of times an article is cited in other works, citation analysis determines the impact of an author’s publications. In relation to this, Mammola et al. (2021) discovered that citing papers with a high impact factor enhances the number of citations.
1.1. Proportion of Highly Cited Papers
As per previous studies, only a minor percentage of articles or publications have received 100 or more citations. For example, Indian publications in orthopaedics accounted for 1.11% (Vaishya et al., 2022), Indian publications accounted for 0.56% (Elango & Ho, 2017), tribology research publications accounted for 0.77% (Elango & Ho, 2018), publications on obsessive compulsive disorder accounted for 4.49% (Grover & Gupta, 2022), papers on cyber security accounted for 0.53% (Dhawan et al., 2021), papers in the category of information science and library science accounted for 0.18% (Ivanović & Ho, 2016), papers in the category of education and educational research accounted for 0.53% (Ivanović & Ho, 2019), and papers in the category of horticulture accounted for 0.94% (Kolle et al., 2017), regardless of the publication year.
The results of a search for randomly chosen journals in the Scopus database were utilized to determine the percentage of highly cited papers with 100 or more citations. These journals are presented in Table 1. The findings reveal that the proportion of highly cited papers varies from 0.28% to 5% for the selected journals.

Number of highly cited papers (TC≥100) in selected journals
1.2. Research Questions
The reputation of a scientific article within the scientific community can be determined by the number of citations it has received. In the case of a non-indexed article, reputation is more recognized by the international scientific community. In this context, the purpose of this study is to analyse the nuances of an article by Elango and Rajendran (2012) (referred to as the “citing article”) that is not indexed in Scopus but has received 100 or more citations. The study aims to answer the following specific questions:
-
What is the temporal evolution of the cited articles?
-
Who are the top authors among the cited articles?
-
What are the top countries among the cited articles?
-
Are there any common themes among the cited articles?
-
What is the distribution of cited articles across subject disciplines?
In 2012, the authors of the citing article “Authorship trends and collaboration pattern in the marine sciences literature: A scientometric study” published it in the International Journal of Information Dissemination and Technology. The study utilized data collected from the Indian Journal of Marine Sciences from 2001 to 2010 to examine trends in authorship and collaboration. Various scientometric tools, such as the collaboration index (CI), collaboration co-efficient, and dominance factor, were employed to analyse the data. The study also investigated the applicability of Lotka’s law. Additionally, the study provided comprehensive information on the calculation of the CI, which is widely acknowledged by researchers (Alhawari et al., 2021; Bragg et al., 2022; Campra et al., 2022; Koseoglu, 2016; Secinaro et al., 2020; Xu et al., 2022).
1.3. Modified Collaboration Index
Previously, the CI was computed by taking into account all the authors and publications, including those with single-authors. However, the study conducted by Elango and Rajendran (2012) focused on determining the total number of authors who contributed to articles with multiple authors, as well as the total number of multi-authored articles. This approach was proposed to address some drawbacks in the previous method.
However, the above method also has some drawbacks. To illustrate, the following scenario may be considered:
In this example, there are two articles and two distinct authors contributing to them. Despite there being four authorships in total, the existing version of the CI (i.e. total number of authors divided by total number of articles) would yield a value of 1. In light of this, the study introduced a modified version of the CI (MCI), as follows:
According to the modified version, the CI is computed by dividing the total number of authorships by the total number of multi-authored articles, resulting in a value of 2. In comparison to the previous version, the modified version produces a value that is twice as high.
2. DATA AND METHODS
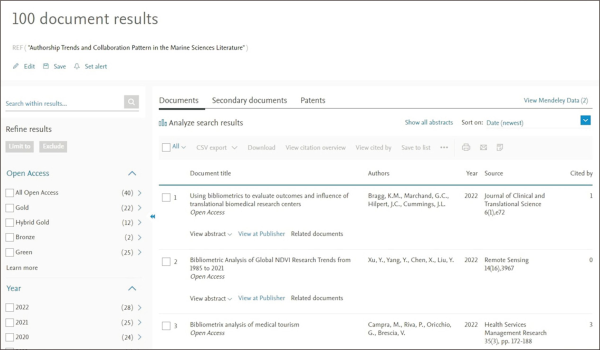
The title of the citing article “Authorship trends and collaboration pattern in the marine sciences literature” was entered into the references field of the Scopus database in order to conduct a search. The search yielded 100 records, which are referred to as “cited articles.” This search was conducted on October 15, 2022 (Fig. 1). The retrieved bibliographic records were then downloaded for further analysis. Various software tools, including Bibliometrix R Package (K-Synth Srl, Naples, Italy), VOSviewer, (Center for Science and Technology Studies, Leiden University, Leiden, Netherlands) and ScientoPy (University of Cauca, Popayán, Colombia), were utilized for this purpose.

Search results.
3. RESULTS AND DISCUSSION
Table 2 presents the general information of 100 cited articles that were published between 2013 and 2022 (up to October 15, 2022). The data reveals that citations for the citing article began to accumulate in the year following its publication. These 100 cited articles were published in 69 different sources, with 67 of them scientific journals. Among the 100 cited articles, 71 have received at least one citation, while the remaining 29 have not yet received any. In comparison to other fields, the average number of citations for these articles is an impressive 8.77 (Elango et al., 2023; Niknejad et al., 2021).
Descriptive information of 100 cited articles
The authors included three times the number of keywords as there were articles. Additionally, when compared to other subject areas, the number of articles (n=17) authored by single authors is relatively low (Arias-Chávez et al., 2022). The CI, which takes into account the authors, is calculated to be 3.19, surpassing several others fields (Arias-Chávez et al., 2022; Bashir, 2022; Campra et al., 2022; Di Cosmo et al., 2021; García-León et al., 2021). On average, each article has three authors (3.13) and CI is calculated to be 3.19. However, when accounting for authorships, the MCI is determined to be 3.57, which is 12% higher than the existing method.
The following explanation provides details on how to compute the MCI using the results obtained from Bibliometrix.
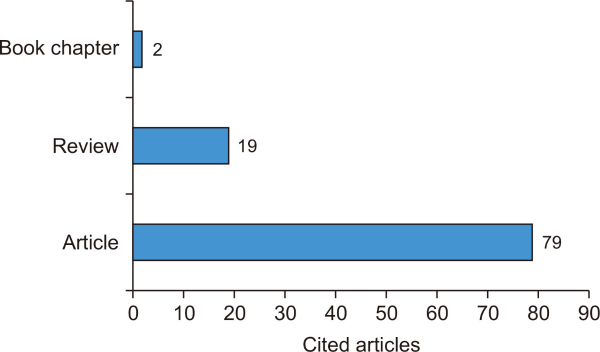
The various document types from the 100 cited articles are shown in Fig. 2, illustrating that the majority of the studies were published as articles. It is not unexpected that articles are frequently chosen as the preferred document type for bibliometric OR scientometric analyses (Mooghali et al., 2011; Patra et al., 2006). Only two studies were published as book chapters, while 19 investigations were published as reviews. The remaining studies, excluding the book chapters, were published in 67 different journals.

Document types of 100 cited articles.
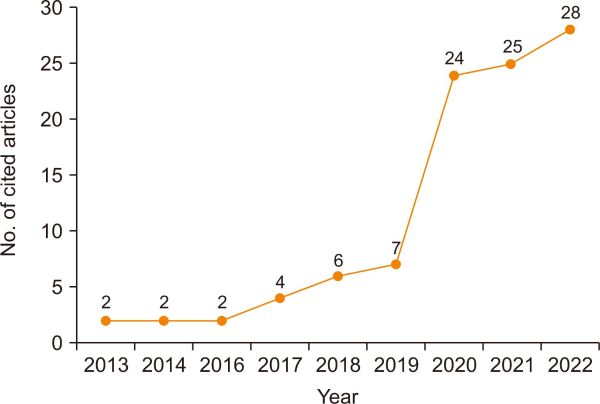
Fig. 3 illustrates the annual trend of cited articles, encompassing a period of nine years from 2013 to 2022 (up until October 15, 2022). Following its publication in 2012, the citing article started to accumulated citations in 2013. The majority of the cited articles, approximately three-fourths, were published within the most recent three-year span from 2020 to 2022. The remaining articles were published over a duration of six years. As a result, the citing article can be referred to as a “sleeping beauty” (Song et al., 2018; van Raan, 2004).

Yearly trend of 100 cited articles.
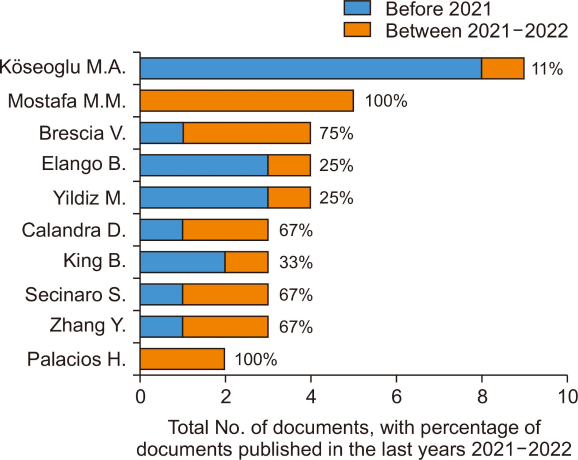
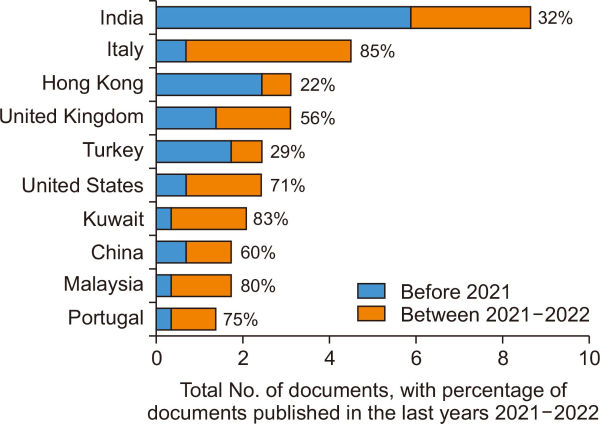
Fig. 4 illustrates the top 10 authors of the 100 cited articles, along with the corresponding percentage of articles published in the most recent last two years, specifically 2021 and 2022. These distinguished authors have cited articles ranging from 2 and 9. With the exception of the author of the citing article, all other authors hail from different countries, exemplifying the international recognition of the article over its nation recognition. Notably, authors Köseoglu and King originate from Hong Kong, Mostafa is from Kuwait, Brescia, Calandra, and Secinaro are from Italy, Yildiz is from Australia, Zhang is from China, and Palacios is from Portugal. It is worth mentioning that authors Mostafa and Palacios have cited this citing article in five and two articles, respectively, all of which were published within the last two years. Following closely behind, Brescia cited this article in three-fourths of the articles, signifying the frequent citation of this article by these authors in recent years.

Top authors of the cited articles.
The authors of the 100 cited articles hailed from 35 different countries. Fig. 5 displays the leading 10 countries of origin of authors of these 100 cited articles, and these particular countries contributed articles ranging from between 4 to 25. Out of the 100 cited articles, only 25 were from India, which is the country of origin for the authors of the citing article. This clearly indicates that the article was highly esteemed within the international scientific community. Among these top 10 countries mentioned, Italy, the United Kingdom, the United States, and China were also recognized as top contributors to scientific production in 2021 (Elango, 2022). It can be observed that the citing article has garnered less attention from Indian authors, while attracting increased attention from the international scientific community. For example, more than 80% of articles by Italy, Kuwait, and Malaysia were published within the last two years, in comparison to only 32% by India.

Distribution of subject areas of 100 cited articles.
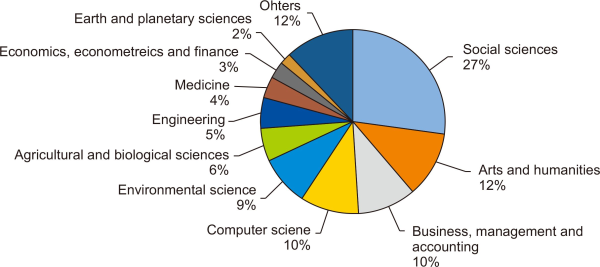
The Scopus database contains 23 different subject-related sources where the 100 cited articles were discovered (Fig. 6). Out of the 27 subject disciplines used by Scopus to classify sources, only health professionals, immunology & microbiology, nursing, and pharmacology, toxicology & pharmaceutics have no cited articles. The majority of the cited articles were published in sources belonging to the disciplines of social sciences, arts & humanities, business management & accounting, computer science, and environmental science. This demonstrates that the article is being utilized as a resource in a wide range of disciplines.

Top countries of authors of cited articles.
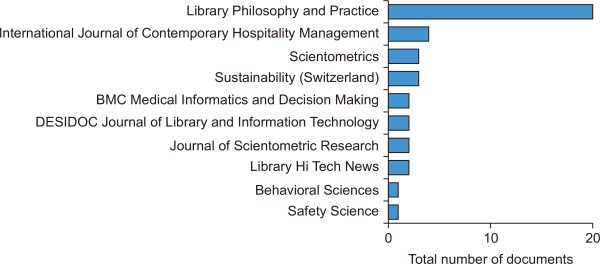
Fig. 7 illustrates the top 10 journals, collectively responsible for publishing 40% of the 100 cited articles. Among these journals, six possess an impact factor for the year 2021, ranging from 2.286 (Behavioural Sciences) to 9.321 (International Journal of Contemporary Hospitality Management). While two of these journals are included in the Emerging Source Citation Index, they have yet to acquire an impact factor. This outcome serves as a testament to the exceptional quality of the cited articles. Unfortunately, Library Philosophy and Practice, one of the aforementioned ten journals, has been excluded from Scopus coverage due to concerns with its publication practices.

Top journals of 100 cited articles.
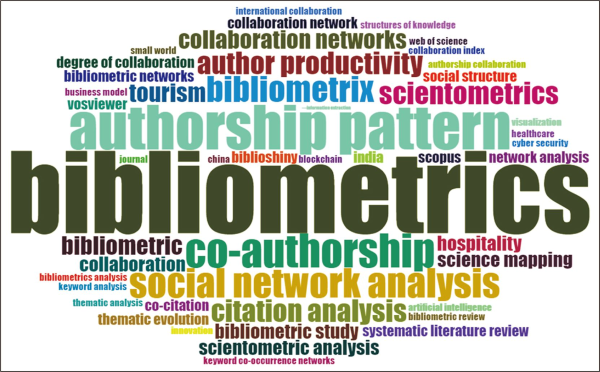
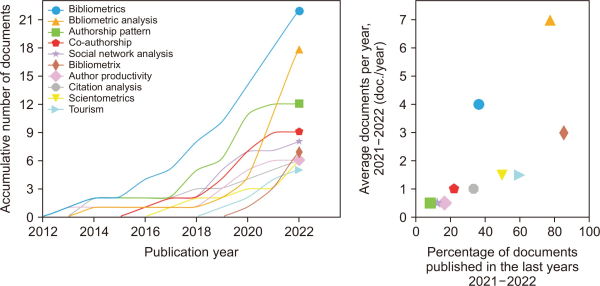
The word cloud shown in Fig. 8 presents the top 50 keywords used by the authors in the 100 cited articles. The size of the keyword or phrase is inversely related to the number of articles it appears in (Ruiz-Rosero et al., 2019). The analysis reveals that the keyword bibliometrics, authorship pattern, co-authorship, and social network analysis are particularly prevalent among the cited articles. Additionally, Fig. 9 provides an evolution plot of the top 10 author keywords, allowing us to examine their temporal patterns. The panel on the right side illustrates the average growth rate in relation to the proportion of articles published in the recent two years, while the panel on the left side displays the accumulative number of articles over the years. From the figure, it is evident that among the 100 cited articles, the most popular keywords are bibliometrics, bibliometric analysis, and bibliometrix.

Word cloud of author keywords of cited articles.

Evolution plot of top 10 author keywords of 100 cited articles.
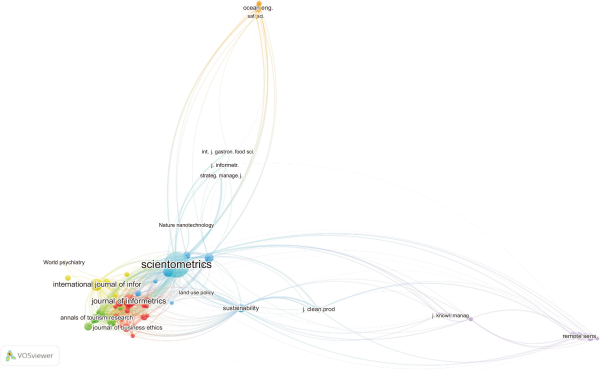
The structure of a given subject is reflected in the connections between nodes (such as authors, papers, and journals) in a citation analysis network, and the edges can be interpreted in various ways depending on the network type, including co-citation, bibliometric coupling, and direct citation (Aria & Cuccurullo, 2017). Consequently, a co-citation network map of cited sources has been generated in VOSviewer to gain insight into the prominent sources among the 100 cited articles. The analysis focuses on cited sources, and out of 3,385 sources, 63 sources have been selected based on a threshold value of at least 10 citations per source. The resulting network map reveals 7 clusters (Fig 10). It is challenging to assign a specific subject area to the clusters since the cited journals belong to various subject areas. However, the most influential sources are Scientometrics and the Journal of Informetrics: Both of these journals were listed among the top 25 influential journals in the field of bibliometrics (Martín-Martín et al., 2018).

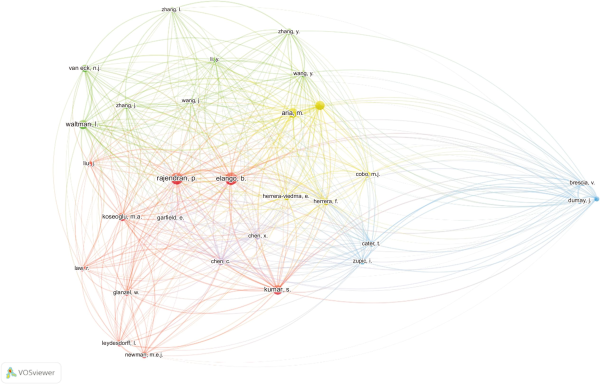
Author co-citation analysis, an important technique in bibliometrics, involves counting how many times an author’s work is cited by another author in the references of citing publications. This technique is used to detect, analyse, and visualize the intellectual structure of a dataset (Bayer et al., 1990). To explore the prominent authors among the 100 cited articles, a co-citation network map of cited authors was generated using VOSviewer. The unit of analysis in this map is cited authors, and out of the 12,068 authors, 30 were selected based on a threshold value of at least 20 citations. The resulting network map reveals 4 clusters (Fig. 11). The largest network, represented by the colour red, includes the authors van Eck and Waltman, who developed the VOSviewer (van Eck & Waltman, 2010). The next significant cluster, represented by the colour green, consists of pioneers in the field of bibliometrics, like Leydesdorff and Glanzel. The blue cluster comprises the developers of Bibliometrix (Aria & Cuccurullo, 2017) and SciMAT (Cobo et al., 2012). Among these authors, Glanzel, Leydesdorff, and Garfield were identified as among the top 25 influential authors in the field of bibliometrics (Martín-Martín et al., 2018).

4. MERITS AND DEMIERTS OF THE PROPOSED MCI
The current version of the CI possesses some limitations, and this study has proposed a MCI, which has the following advantages:
-
It is easy to calculate.
-
It can be employed to evaluate the level of collaboration among a group of authors on a particular dataset.
-
It can be applied to any dataset type. For example, it can be used to compute for various document types, a specific author, institution, and country, a particular journal, and so on.
Undeniably, it has the following disadvantage:
5. CONCLUSION
The citing article “Authorship trends and collaboration pattern in the marine sciences literature: A scientometric study” published by Elango and Rajendran in the International Journal of Information Dissemination and Technology in 2012, is used as a case study to demonstrate the results of a bibliometric analysis of 100 cited Scopus articles to a non-Scopus indexed article (Elango & Rajendran, 2012). This study yields some interesting facts. Receiving 100 citations from Scopus indexed articles by a Scopus-indexed article as well as a non-indexed article is highly reputable among the scientific community. Because the majority of the cited articles were published during the last three years, the results demonstrate that the citing article is a ‘sleeping beauty.’ The fact that three-fourths of the cited articles were authored by authors outside India demonstrates how well-recognized the citing article is on a global scale. The three most prominent themes among the 100 cited articles were bibliometrics, bibliometric analysis, and bibliometrix. The top 10 journals that published the 100 cited articles published 40% of the cited articles, and the scientific community worldwide is aware of all 10 journals. To summarise, regardless of the journal’s indexing, the scientific community will recognize a publication that includes fascinating and significant material.
The results of this study are specifically constrained by the fact that they are based entirely on the 100 cited articles of the chosen citing article.
REFERENCES
, , , (2021) Insights from circular economy literature: A review of extant definitions and unravelling paths to future research Sustainability, 13(2), 859 https://doi.org/10.3390/su13020859.
, (2017) bibliometrix Journal of Informetrics, 11(4), 959-975 https://doi.org/10.1016/j.joi.2017.08.007.
, , , (2022) Gamification as a resource in education. A bibliometric analysis in times of pandemic Journal of Pharmaceutical Negative Results, 13(3), 268-276 https://doi.org/10.47750/pnr.2022.13.S03.043.
(2022) Oil price shocks, stock market returns, and volatility spillovers: A bibliometric analysis and its implications Environmental Science and Pollution Research International, 29(16), 22809-22828 https://doi.org/10.1007/s11356-021-18314-4. Article Id (pmcid)
, , (1990) Mapping intellectual structure of a scientific subfield through author cocitations Journal of the American Society for Information Science, 41(6), 444-452 https://doi.org/10.1002/(SICI)1097-4571(199009)41:6<444::AID-ASI12>3.0.CO;2-J.
, , , (2008) Citation counts for research evaluation: Standards of good practice for analyzing bibliometric data and presenting and interpreting results Ethics in Science and Environmental Politics, 8(1), 93-102 https://doi.org/10.3354/esep00084.
, , , (2022) Using bibliometrics to evaluate outcomes and influence of translational biomedical research centers Journal of Clinical and Translational Science, 6(1), e72 https://doi.org/10.1017/cts.2021.863. Article Id (pmcid)
, , , (2022) Bibliometrix analysis of medical tourism Health Services Management Research, 35(3), 172-188 https://doi.org/10.1177/09514848211011738. Article Id (pmcid)
, , , (2012) SciMAT: A new science mapping analysis software tool Journal of the American Society for Information Science and Technology, 63(8), 1609-1630 https://doi.org/10.1002/asi.22688.
, , (2021) Global cyber security research output (1998-2019): A scientometric analysis Science & Technology Libraries, 40(2), 172-189 https://doi.org/10.1080/0194262X.2020.1840487.
, , , , (2021) Research trends in octopus biological studies Animals, 11(6), 1808 https://doi.org/10.3390/ani11061808. Article Id (pmcid)
, (2017) A bibliometric analysis of highly cited papers from India in Science Citation Index Expanded Current Science, 112(8), 1653-1658 https://www.currentscience.ac.in/Volumes/112/08/1653.pdf.
, (2018) Top-cited articles in the field of tribology: A bibliometric analysis COLLNET Journal of Scientometrics and Information Management, 12(2), 289-307 https://doi.org/10.1080/09737766.2018.1529125.
, (2012) Authorship trends and collaboration pattern in the marine sciences literature: A scientometric study International Journal of Information Dissemination and Technology, 2(3), 166-169 https://www.proquest.com/openview/bd08c09a20100284c0ea8f592f0e8e47/1?pq-origsite=gscholar&cbl=1036413.
, , , (2023) Mapping the cybersecurity research: A scientometric analysis of Indian publications Journal of Computer Information Systems, 63(2), 293-309 https://doi.org/10.1080/08874417.2022.2058644.
, , (2021) Bibliometric analysis in disc brakes: An overview DYNA, 88(217), 23-31 https://doi.org/10.15446/dyna.v88n217.91091.
(1972) Citation analysis as a tool in journal evaluation: Journals can be ranked by frequency and impact of citations for science policy studies Science, 178(4060), 471-479 https://doi.org/10.1126/science.178.4060.471.
, (2022) Global research on obsessive compulsive disorder and related disorders: A scientometric assessment of global research during 2002-2021 Asian Journal of Psychiatry, 72, 103146 https://doi.org/10.1016/j.ajp.2022.103146.
(2005) An index to quantify an individual's scientific research output Proceedings of the National Academy of Sciences of the United States of America, 102(46), 16569-16572 https://doi.org/10.1073/pnas.0507655102. Article Id (pmcid)
, (2016) Highly cited articles in the Information Science and Library Science category in Social Science Citation Index: A bibliometric analysis Journal of Librarianship and Information Science, 48(1), 36-46 https://doi.org/10.1177/0961000614537514.
, (2019) Highly cited articles in the Education and Educational Research category in the Social Science Citation Index: A bibliometric analysis Educational Review, 71(3), 277-286 https://doi.org/10.1080/00131911.2017.1415297.
, , (2017) Highly cited articles in Science Citation Index Expanded - Subject category of horticulture: A bibliometric analysis Erwerbs-Obstbau, 59(2), 133-145 https://doi.org/10.1007/s10341-016-0308-4.
, (2021) The h-index is no longer an effective correlate of scientific reputation PLoS One, 16(6), e0253397 https://doi.org/10.1371/journal.pone.0253397. Article Id (pmcid)
(2016) Growth and structure of authorship and co-authorship network in the strategic management realm: Evidence from the Strategic Management Journal BRQ Business Research Quarterly, 19(3), 153-170 https://doi.org/10.1016/j.brq.2016.02.001.
, , , (2021) Impact of the reference list features on the number of citations Scientometrics, 126(1), 785-799 https://doi.org/10.1007/s11192-020-03759-0.
, , (2018) A novel method for depicting academic disciplines through Google Scholar Citations: The case of Bibliometrics Scientometrics, 114(3), 1251-1273 https://doi.org/10.1007/s11192-017-2587-4.
, , , (2011) Scientometric analysis of the scientometric literature International Journal of Information Science and Management, 9(1), 19-31 https://ijism.ricest.ac.ir/article_698154.html.
, , , (2006) The relationship between quality of research and citation frequency BMC Medical Research Methodology, 6, 42 https://doi.org/10.1186/1471-2288-6-42. Article Id (pmcid)
, , , , (2021) Mapping the research trends on blockchain technology in food and agriculture industry: A bibliometric analysis Environmental Technology & Innovation, 21, 101272 https://doi.org/10.1016/j.eti.2020.101272.
, , (2006) Bibliometric study of literature on bibliometrics DESIDOC Journal of Library & Information Technology, 26(1), 27-32 https://doi.org/10.14429/djlit.26.1.3672.
, , (2019) Software survey: ScientoPy, a scientometric tool for topics trend analysis in scientific publications Scientometrics, 121(2), 1165-1188 https://doi.org/10.1007/s11192-019-03213-w.
, , , (2020) Employing bibliometric analysis to identify suitable business models for electric cars Journal of Cleaner Production, 264, 121503 https://doi.org/10.1016/j.jclepro.2020.121503.
(1997) Why the impact factor of journals should not be used for evaluating research British Medical Journal, 314(7079), 498-502 https://doi.org/10.1136/bmj.314.7079.497. Article Id (pmcid)
, , , (2018) To be the prince to wake up sleeping beauty: The rediscovery of the delayed recognition studies Scientometrics, 117(1), 9-24 https://doi.org/10.1007/s11192-018-2830-7.
, , , (2022) Scientometric analysis of Indian orthopaedic research in the last two decades International Orthopaedics, 46(11), 2471-2481 https://doi.org/10.1007/s00264-022-05523-w.
, (2010) Software survey: VOSviewer, a computer program for bibliometric mapping Scientometrics, 84(2), 523-538 https://doi.org/10.1007/s11192-009-0146-3. Article Id (pmcid)
(2004) Sleeping beauties in science Scientometrics, 59(3), 467-472 https://doi.org/10.1023/B:SCIE.0000018543.82441.f1.
(2016) A review of the literature on citation impact indicators Journal of Informetrics, 10(2), 365-391 https://doi.org/10.1016/j.joi.2016.02.007.
, , , , , (2022) Using the h-index as a factor in the promotion of surgical faculty Heliyon, 8(4), e09319 https://doi.org/10.1016/j.heliyon.2022.e09319. Article Id (pmcid)
, , , (2022) Bibliometric analysis of global NDVI research trends from 1985 to 2021 Remote Sensing, 14(16), 3967 https://doi.org/10.3390/rs14163967.