1. INTRODUCTION
Business administration and management teams face enormous competition and change due to internal and external factors. Therefore, a business must become an agile organization that rapidly adapts its strategies and action plans. Investment in digital technology, information system capability, and innovation capability enhances the agility of a business. In addition, business intelligence (BI) increases the innovation capability to improve a firm’s performance (Božič & Dimovski, 2019; Ravichandran, 2018). Furthermore, BI systems moderate the outcomes of information systems. It is crucial to have a channel of information communication, for such things as business results and statuses, between related departments within an organization (Petrini & Pozzebon, 2009; Popovič et al., 2014).
Organizations, whether in business and non-business domains, are now using BI to monitor and drive their strategies to achieve their goals (Azma & Mostafapour, 2012). BI is a powerful tool for supporting decision-making based on large amounts of data. This tool consists of methods for data extraction, data transformation, data loading, data modeling, and data visualization that lead to a competitive advantage (Jakhar & Krishna, 2020). Although BI is widely used in enterprises, many organizations do not reap the full benefits of these systems. Some organizations are still lagging behind in using BI enhancement to create successful business opportunities (Qushem et al., 2017; Ul-Ain et al., 2019). In a traditional BI system, users have two roles in BI processing: requester and responder. Decision-makers, like managers, executives, and board committees fill the requester’s role and seek the information they require from the responder. The role of the responder is filled by the information technology staff or a BI expert who creates related reports and data visualization (Alpar & Schulz, 2016). The challenge of enhancing a BI system so that non-technician users can be self-reliant requires being able to ensure data can be accessed more comfortably, complex methods using multiple data sources are eliminated, flexibility of data retrieval, and ease of use (Lennerholt et al., 2018).
As mentioned above, BI is a crucial tool for non-technical users to monitor and control strategic results in their organization. However, BI method complexity is a threat to self-reliant use of the BI system for users who require BI analysis to perform their jobs. These problems are the obstacles that this research aims to overcome to facilitate problem-solving. The research objective is to create a new process using semantic techniques to facilitate non-technical users to be able to search relevant data from multiple databases, without needing an intimate understanding of the databases’ structures and relationships, to monitor key performance indicators (KPI) in the semantic BI system.
Hence, the research question is “How can we decrease the complexity between non-technical user skills and database structure understanding using the ontology concept?” This study is underpinned by two main objectives: (1) to develop a framework aimed at facilitating data retrieval for non-technical users, thereby obviating the necessity for database management knowledge and skills, and (2) to identify the string-based similarity method most congruent with the aforementioned framework. The remainder of this paper briefly describes the conceptual background, the application of BI in organizations, BI in the context of KPI, semantic technology and ontology with regard to KPI, the differences between ontology and databases, and the string similarity search. Then, we present the research framework and methodology. Finally, we explain the results and discuss the research challenges.
2. LITERATURE REVIEW
2.1. Application of Business Intelligence in Organizations
Organizations face a complex array of data and information, strong competition from direct and indirect competitors, and the need for rapid, correct decision-making. Data originates from various stakeholders, such as customers, suppliers, employees, information systems related to business transactions, facts, and external data sources. Organizations collect these data for intelligent decision-making. Hence, data and information become an organization’s strategic resources and the essential factor driving the company’s efficiency and effectiveness. Therefore, BI is an appropriate solution for organizations to analyze various data and as a decision-making tool (Olszak, 2020). The definition of BI is a system that combines architectures, databases, techniques, and analytics tools. The critical objectives of BI are to analyze historical and present data to create an interactive, dynamic view of an organization’s performance, data, and information for decision-makers (Sharda et al., 2018).
Klašnja-Milićević et al. (2017) presented a framework for BI processing using the Hadoop platform for data scientists. Similarly, Kumar and Belwal (2017) and Yulianto and Kasahara (2018) implemented BI in organizations using the Pentaho software, and Villegas-Ch et al. (2020) used traditional BI processes using the Weka tool in higher education institutions. Meanwhile, Fraihat et al. (2021) designed an architecture for and developed BI for the real-estate market using the Python platform, employing the extract, transform, load (ETL) process and Power BI software for data visualization. These frameworks are general BI tools and applications for organizations. They differ from the business indicator management system de Andrade and Sadaoui (2017) developed using the Joomla platform, that was integrated into the dashboard view of KPI monitoring. A little differently, Piri (2020) analyzed KPIs by interviewing the managers and adopted the KPIs dashboard design. As mentioned above, many tools such as Weka, Pentaho, Hadoop, and Power BI are the tools organizations use for BI applications.
2.2. Business Intelligence on Key Performance Indicators Context
Many researchers emphasize studying KPI in the BI process of strategic management. KPIs were adapted as part of business realization in BI. Data scientists have to understand indicator analysis before proceeding to data processing and data mining (Alaskar & Saba, 2020; Bréant et al., 2020; Khatibi et al., 2017; Ng et al., 2015; Pestana et al., 2020; Ren & Tao, 2012; Rocha et al., 2017; Visser, 2020). In the same way, Zoumpatianos et al. (2013) combined the KPI monitor processes: KPIs projection analysis, KPIs data calculation, expectation analysis, performance analysis, and impact analysis, with BI. Conversely, Maté et al. (2017) described a semantic approach for business analytics using KPIs. This approach begins with strategic modeling using a business intelligence model to manually build the KPIs relationships and relate them to the semantics of business vocabulary and business rules (SBVR) using the Java platform. The SBVR referred to as a business dictionary becomes the corpus for the KPI interpreter, which provides the meanings of KPIs to the online analytical processing interpreter. In another KPI study, Sultan et al. (2017) proposed a framework for detecting appropriate KPIs based on feature selection using Weka’s information gain algorithm and then determining the association rules adapted for the frequent pattern-growth algorithm and compact pattern tree (CP-tree).
Furthermore, Azzouz et al. (2020) designed four steps – namely, business context analysis, the definition of strategic objectives, multidimensional modeling, and system implementation – for strategic alignment of KPIs systems. Certainly, KPIs are the main focus when an organization needs to develop their BI for strategy monitoring and driving data performance. Therefore, KPIs are the key factors that must be calculated into the business insight process and integrated into all objective and goal projections.
2.3. Semantic Technology with Ontology for Key Performance Indicators
The definition of an ontology is a set of representational primitives used to model a domain of knowledge or discourse. The primitive representations for ontology are usually classes (or sets), attributes (or properties), and relationships (or relations between class members). Furthermore, these assets complicate the meanings and constraints on the rationally coherent application of information. In the context of database systems, ontologies can refer to the level of abstraction of data models. Moreover, an ontology is a hierarchical and relational model intended for knowledge modeling of individuals, including their attributes and relationships to other individuals. Typically, ontologies use language that abstracts data found in structures and schemes. More specifically, using an ontology provides a greater ability to express first-order logic than a database model allows. The ontology is the semantic level and the database schema is the physical level of the data model. There are several utilizations of ontologies to integrate heterogeneous databases, enabling interoperability among incongruent systems and services on a knowledge-based level, because ontologies operate independent of the lower level databases (Gruber, 2009).
There are some exciting applications of semantic technology related to KPIs. For example, Bai et al. (2014) applied ontology technology to KPIs in personnel performance evaluations. First, they created the evaluation ontology and instances. After that, they used semantic web rule language to determine the rules of the evaluation statement and then queried to retrieve the information using SPARQL Protocol and resource description framework (RDF) Query Language (SPARQL). Similarly, del Mar Roldán-García et al. (2021) proposed a semantic model related to the ontology concept which covered KPI relationships and adapted the ontology to information retrieval with SPARQL, based on domain expert validation. In contrast, Walzel et al. (2019) presented KPI ontologies as the knowledge base for systems engineering and machine setup in manufacturing systems. Özcan et al. (2021) introduced an ontology enrichment technique which matched domain-specific ontologies and cross-domain knowledge graphs for ontology creation in artificial intelligence applications. Furthermore, their technique supported the increased correct data entity identification. Consequently, the ontology concept adds to the value of KPI relationship studies, which can apply in various contexts.
2.4. Difference Between Ontology and Databases
Relational databases (RDB) rely on a schema for construction of a table, but ontologies depend on the knowledge base of various relationships between classes or data. RDB are limited to one type of relationship, for example, the foreign key. If the system wants to create a relationship, or join multiple tables in the database to search for something, it has only a foreign key. The semantic web can see multidimensional relationships, for example, inheritance, associated with, part of, and many other forms, containing logical relationships and restrictions. Systems can infer implicit information from ontologies, but databases cannot (Hebeler et al., 2009).
Databases mainly use close-world assumption; on the other hand, ontologies use open-world assumption (OWA) if the system includes incomplete information. This concept represents existing knowledge and suggests new information findings. For example, if there is no direct flight from one place to somewhere else, the result returned by the ontology will be “I do not know.” Furthermore, databases use unique name assumptions. The definition of this term declares that there is only one world available for one entity from the real world. Thus, in a database, numerous vital terms have to be defined. Furthermore, the difference between an ontology and a database is that a database does not use a taxonomy to represent an original aspect of an ontological reference, because databases are used to precisely and safely store large amounts of data. However, ontologies locate the application by combining semantic data, or communication between heterogeneous systems, and they share the knowledge and the structure of the information with humans or software (Sir et al., 2015).
Ontologies and databases can represent similar actualities, but the application of ontological technology can present advantages depending on the problem. Database technologies can efficiently manage massive amounts of data, whereas ontologies reasonably represent reality, but the technology is inefficient at managing instances when they are present in the format of an OWL or RDF file. When the number of instances increases, ontologies have to be stored in a database and provide an interface that supports access to the data. However, ontologies offer a restriction-free framework to denote that a machine can be a readable reality, even on the Web. This framework depends on an OWA, wherein information can be defined, shared, reused, or allocated. Furthermore, information can also be exchanged and used to make inferences or queries. Choosing one or the other technology depends on the end-user’s requirements. If the information needs to be shared on the Web, an ontology should provide a good solution. Nonetheless, the decision would probably include using both technologies when a large amount of data needs to be stored and properly managed. Ontologies provide an excellent way to characterize reality, but a database is certainly the better method for storing data when size is a consideration (Martinez-Cruz et al., 2012).
Some studies have explored database transformation from a RDB to an ontology file or a RDF. Zhao et al. (2019) created a schema-based graph mapping method to transform RDB schema and table relationships into a RDF data graph, and then used the SPARQL endpoint to query the RDB data in the RDF file. Additionally, Jun et al. (2020) improved the RDB to RDF method by solving two problems: duplicated data generation and semantic information loss. Finally, Devi et al. (2020) built an ontology system covering the information requirement and used RDB to RDF Mapping Language for RDB to RDF transformation.
2.5. String Similarity Search
String similarity mapping is an essential technique for data integration and searches. The problem with string searching is how to decrease the inconsistencies in origin data and search keywords and increase the tolerated accuracy rate. The string-based similarity method is divided into token-based similarity and character-based similarity methods. The token-based similarity method evaluates the similarity of two strings with the set form of the string being a set of tokens. This method compares the overlap of the members in the tokens sets. Examples of the token-based similarity method are Overlap, Jaccard, Cosine, Dice, and Fuzzy-Wuzzy token set ratios. The second method is the character-based similarity method, which compares the consistency of two strings by separating each string into a sequence of letters and measuring the edited distance. For two strings that are examined to be considered similar, the strings must have a similarity score that meets or exceeds a set threshold. Examples of this method are Hamming distance and Levenshtein distance (Angeles & Espino-Gamez, 2015; Appa Rao et al., 2018; Yu et al., 2016). Finally, there are methods that do not fall under string-based similarity methods, such as the Jaro-Winkler and Monge-Elkan methods, which employ different approaches for performing string similarity comparisons. Thus, those methods are referred to as hybrid similarity methods (Prasetya et al., 2018).
Angeles and Espino-Gamez (2015) reported that the accuracy rate of the Hamming distance approach was higher than that of the Jaro and Monge-Elkan approaches, but its overall performance was lower compared to the Jaro and Monge-Elkan approaches. Appa Rao et al. (2018) presented the Fuzzy-Wuzzy method as being more appropriate than Levenshtein distance and Sequence Matcher in regard to the string similarity matching of a mathematical formula. Using dynamic queries of the MySQL database, Rinartha et al. (2018) compared the efficiency of Jaccard similarity, MySQL pattern matching, Levenshtein distance, and MySQL Fulltext Index. They determined that the MySQL Fulltext Index was the most accurate method, while MySQL pattern matching was the fastest method for query suggestion.
3. RESEARCH FRAMEWORK AND METHODOLOGY
3.1. Research Framework
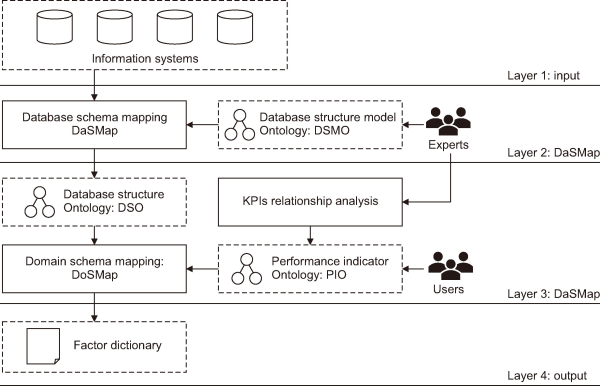
The framework of mapping data schema with ontology (MapDS-Onto) is a part of our research about developing semantic BI. The MapDS-Onto framework, shown in Fig. 1, maps the factors of the KPIs formula with the associated column in a RDB using the relation of the data class and the related ontology. The MapDS-Onto framework will then create the factor dictionary used for BI generation.
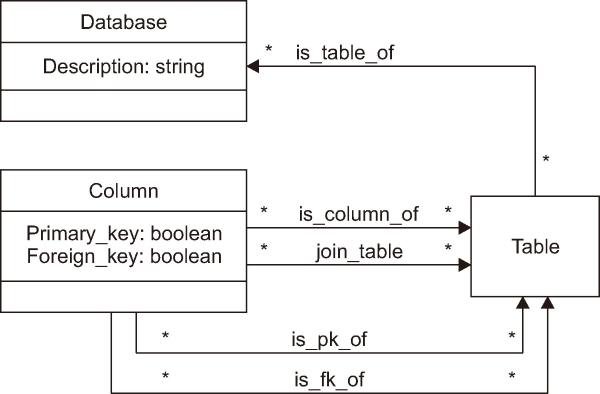
The MapDS-Onto framework has four layers for objective processing. Layer 1 lists all of the databases in the organization’s information systems along with their different configurations and connections. Layer 2 is a database schema mapping (DaSMap) and begins with the experts (researcher and strategic administrator) helping to create the database structure model ontology (DSMO). The relationship structure of the DSMO is presented in Fig. 2. The DSMO is the model used for the DaSMap algorithm, and that applies the process from Zhao et al. (2019) for reading the database structures of all of the information systems and building the database structure ontology (DSO). Layer 3 is called the domain schema mapping (DoSMap). Here, experts analyze the organization’s KPIs attribute relationships and build the information forms to create the performance indicator ontology (PIO). This form receives the performance indicator property’s data from users. The PIO is built based on an adaptation of the process developed by del Mar Roldán-García et al. (2021). Then, the DoSMap algorithm inputs the DSO and PIO to begin its process. DoSMap is the mapping method connecting the DSO and PIO to allow searching the appropriate classes in the DSO with the formula’s factor of KPIs class in the PIO and building the factor dictionary file. The dictionary file serves as a compendium, implemented in Python, designated for storing data requisite for processing. Consequently, this dictionary file constitutes the relative column corpus of PIO, encompassing the column name, table name, and database name.
3.2. Research Methodology
The research methodology of this study is divided into three phases as follows:
3.2.1. Phase 1: Problem Defining
-
A structured literature review was conducted to identify gaps related to the use of semantic techniques, enabling non-technical users to search for relevant data across multiple databases without understanding the databases’ structures and relationships for KPIs monitoring in semantic BI systems.
-
The researchers analyzed relevant approaches and adapted appropriate theories to our framework.
3.2.2. Phase 2: Framework Development
DSMO was developed by applying the seven steps from Noy and McGuinness (2001) and evaluated using a data-driven approach and assessment by humans. The seven steps for DSMO creation are as follows:
3.2.2.1. Step 1: Determine the Domain and Scope of the Ontology.
The domain of DSMO is the relationships of database structure among the various information systems that scope on the relative connection between tables, columns, and databases through the primary keys and foreign keys. The DSMO focused on the RDB model, for example, MySQL, MariaDB, PostgreSQL, and Oracle. This study plans to apply DSMO to the data selection algorithm to decrease the complexity between non-technical user skills and database structure understanding. These users do not necessarily get the idea of database structure before selecting the suitable data for calculation. The following are the probable competency questions:
3.2.2.2. Step 2: Consider Reusing Existing Ontologies.
Based on the literature review, no relevant ontologies are related to this study. The DSMO applied the document of Hebeler et al. (2009) to create the DSMO structure.
3.2.2.3. Step 3: Enumerate Important Terms in the Ontology.
The related terms of the database structure’s relationship will include database, table, column, primary key, foreign key, join table, database description, reference, connection, and RDB.
3.2.2.4. Step 4: Define the Classes and the Class Hierarchy.
There are three classes, including database, column, and table, to explain the structure of the databases. The database class will collect the names of databases, and the table class will collect the terms of all tables in the databases. The column class is the field name that contains the data.
3.2.2.5. Step 5: Define the Properties of Classes.
Concept relationships such as “is_a” can be used to describe what a class is. For example, Decision Support System (DSS) is a database, personnel is a table, and staff ID is a column. Attribute relationships like “attribute_of” can be used to describe the relationship where an attribute belongs to a class, such as describing a description as an attribute of a database. There are five object properties, “is_table_of,” “is_column_of,” “is_pk_of,” “is_fk_of,” and “join_table,” to explain the relationships between the members of a class and other items. For example, camp ID serves as the primary key (is_pk_of) for the campus table.
3.2.2.6. Step 6: Define the Facets of the Slots.
The table class is the domain of the “is_table_of” slot. The column class is the domain of “is_column_of,” “is_pk_of,” “is_fk_of,” and “join_table” slots. The database class is the range of the “is_table_of” slot. The table class is the range of “is_column_of,” “is_pk_of,” “is_fk_of,” and “join_table” slots.
3.2.2.7. Step 7: Create Instances.
In this study, two information systems, personnel information system (PIS) and The Prince of Songkla University (PSU) Research Project Management (PRPM), were utilized to read the database structure and create instances. For example, the database name “PRPM” was recorded as an instance named “database: PRPM” in DSMO.
-
The method of schema-based mapping to the RDF graph, as proposed by Zhao et al. (2019), was adapted to design the DaSMap algorithm.
-
The string similarity methods (Jaccard index, Sørensen-Dice, cosine similarity, overlap coefficient, fuzz.token_set_ratio, Jaro-Winkler, and Monge-Elkan) were compared based on similarity scores to identify the most suitable string similarity method for automatically searching for the appropriate columns of data from multiple databases.
-
The identified optimal string similarity method was employed to design DoSMap algorithm.
-
The MapDS-Onto framework was constructed, incorporating DaSMap, DoSMap, related ontologies, and new methods.
4. RESULTS AND DISCUSSION
In Fig. 2, a class diagram illustrates DSMO, which is the relationships of the classes in the DSO. DSMO is a simple but useful application. There are three classes: database, table, and column. The column class has two properties: “primary_key” and “foreign_key.” These properties have Boolean format data values (yes and no) and present the key type of column class that applies to the annotation of the couple relation of the class. The class relationships are explained as follows:
-
is_table_of is the direct relationship between the table class and database class, where one table class is found in multiple databases; the table name can appear as the same name in different databases. The inverse relation exists when one database has many columns.
-
is_column_of is a direct relation between the column class and the table class, indicating that one column can appear in different tables. Consequently, the same column name may be present in multiple tables. Conversely, in the inverse relation, one table can have many columns.
-
is_pk_of and is_fk_of are related to the concept of the table class, where the column class serves as either the primary key (is_pk_of) or foreign key (is_fk_of) referencing the table class.
-
join_table serves as the connector to the column class. When a property (foreign key) is in effect, the column class must establish a relationship with a table class.
From the DSMO structure, one is presented with an exciting answer when a user wants to know the origin of the relation between classes. For example, if x is a selected column which fits the formula’s factor of a KPI, then the BI system will know the route of x, which table x is located in, and what database x is located in.
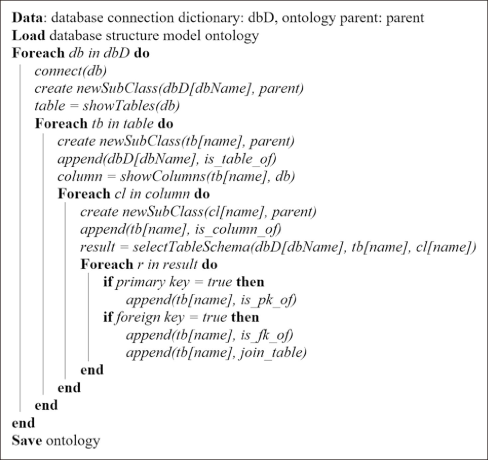
After that, DSMO will be the model for input in the DaSMap algorithm, presented in Fig. 3, for building DSO from multiple databases. DaSMap uses the database connection dictionary (DSMO) as the input file, and the database connection dictionary is the database connection information file. This algorithm begins by loading the DSMO and then creates the dictionary reading loop for all database connections. When a database is connected, the algorithm will create a new subclass of the database class and then read the table structure. The next process employs the table structure reading loop to build the subclass of table class, and the “is_table_of” relationships will be created. In the same way, subclasses of column class and the “is_column_of” relationships are generated from the column structure reading of each table. Finally, DaSMap reads the table schema to get and create the relationships among the columns in the table, determines the “is_pk_of,” “is_fk_of,” and “join_table” relationships, and then saves the DSO.
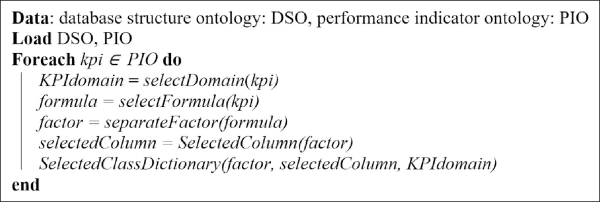
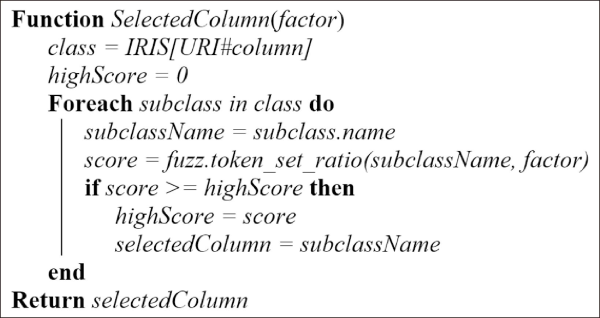
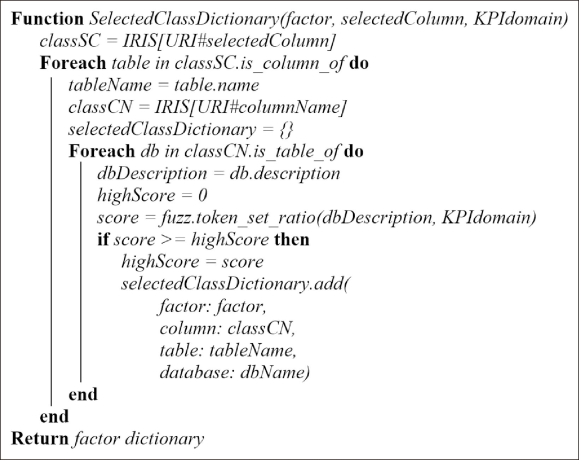
The DSO from DaSMap and the PIO are inputted to the DoSMap algorithm, as shown in Fig. 4. DoSMap is the algorithm that finds the correct columns that match the formula factor of the KPI by mapping the PIO with the DSO. DoSMap starts by loading the DSO and PIO, reads the KPI’s class that is contained in the PIO, and selects and separates the KPI formula. Then, the factor will be taken to input in the “SelectedColumn” function for the column class searches. In instances where multiple databases have the same column names, the SelectedClassDictionary function is applied to solve this problem and create the factor dictionary file for the ETL process of semantic BI.
The SelectedColumn function in Fig. 5 is the process for weighing the string-similarity scores by applying the “fuzz.token_set_ratio” algorithm. The SelectedColumn function takes the factor generated by the DoSMap to map the name of the column class in the DSO and weighs the text similarity score. The result that gets the highest score will be recognized and the value returned to the DoSMap.
The SelectedClassDictionary function in Fig. 6 will input the factor calculated by the SelectedColumn function and the KPI’s domain from PIO. This function reads the column class from the DSO which matches the SelectedColumn function’s result to check for column redundancy by applying the “is_column_of” relationship. The table of column redundancy then reads the table origin using the “is_table_of” relationship. Then the database description of this table and the designated KPI domain are checked for string-similarity using the “fuzz.token_set_ratio” algorithm. The result with the highest score is selected, and its information—factor, column, table, and database—is incorporated into the factor dictionary.
4.1. Case Study
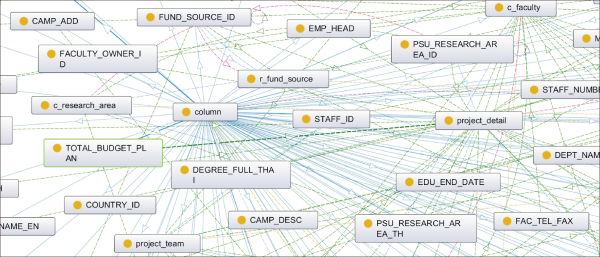
PSU is recognized as the highest quality university in Thailand’s southern region by QS World University Rankings for 2021 (Quacquarelli Symonds, 2021). PSU has five campuses located in the provinces of Songkhla, Pattani, Phuket, Suratthani, and Trang. However, the PSU system does not have intelligent BI that supports decision-making for their executives. Therefore, using PSU as the case study, this research began by scoping two of their information systems: (1) PIS and (2) PRPM system. PIS presents the individual information of staff across the five campuses of PSU, encompassing a wide range of data such as educational records, employment history, job positions, salary and benefits, and leave information. For department managers, this system affords the capability to search and filter information pertaining to their subordinates. On the other hand, the PRPM system stands as the central repository for PSU’s research data, displaying individual research history, funding information, and other pertinent details. Furthermore, the system facilitates users in submitting research proposals to solicit funding from the university and record research data from the start to the end of the project. The MapDS-Onto framework was used to test the case study. After running the DaSMap process, DaSMap read the database structures of PIS and PRPM systems and generated the DSO that followed the pattern of the DSMO. The DSO graph in Fig. 7 shows the complex paths of the relationships between the classes and subclasses. For example, “total_budget_plan” is a subclass of column class and is a column in the project detail table. A related KPI for the two systems is the budget from external funding per person. The formula of this KPI is “sumif(budget, funding source)/countif(staff id, faculty name).”
From this KPI formula in the case study, the DoSMap algorithm separated the formula into four factors—total budget, funding source, staff ID, and faculty name—and matched their class string-similarities and created the factor dictionary. The factor dictionary from the DoSMap algorithm is written as follows:
-
factor dictionary = {
‘budget’ : {
‘column’: ‘total_budget_plan’,
‘table’: ‘project_detail’,
‘database’: ‘prpm’,},
‘funding source’ : {
‘column’: ‘fund_source_id’,
‘table’: ‘project_detail’,
‘database’: ‘prpm’,}
‘staff id’ : {
‘column’: ‘staff_id’,
‘table’: ‘project_detail’,
‘database’: ‘prpm’,}
‘faculty name’ : {
‘column’: ‘faculty_owner’,
‘table’: ‘project_detail’,
‘database’: ‘prpm’,}}
According to the factor dictionary of a KPI, the budget from external funding per person has four factors in the KPI formula. An example of the implication of this dictionary is that the budget factor has to read the data from the “total_budget_plan” column in the “project_detail” table of the PRPM system. The semantic BI system will extract the related data following the path of the column name in the database to transform, load, calculate, and visualize data in the next action of our research.
Another example is a KPI about the number of foreign academic staff working full-time, which has the formula “sumif(academic staff, staff type, staff country).” The factor dictionary of this KPI is as follows:
-
factor dictionary = {
‘academic staff ‘ : {
‘column’: ‘staff_id’,
‘table’: ‘personnel’,
‘database’: ‘dss’,},
‘staff type’ : {
‘column’: ‘staff_type_name’,
‘table’: ‘personnel’,
‘database’: ‘dss’, },
‘staff country’ : {
‘column’: ‘country_id’,
‘table’: ‘personnel’,
‘database’: ‘dss’, }}
From the factor dictionary of the above KPI, we point out the formula’s fit data path. The academic staff factor must read the “staff_id” column in the “personnel” table of the DSS system. The staff type factor must read the “staff_type_name” column in the “personnel” table of the DSS system. The staff country factor must read the “country_id” column in the “personnel” table of the DSS system.
In the “SelectedColumn” function and “SelectedClassDictionary” function, this research tested the reasonableness of the token-based and hybrid similarity methods and the hybrid similarity methods. The character-based similarity method was not applicable to this study, because that method calculates the differences in distance between each character in two words. However, in this case, the names of columns in the database were word groups. Hence, the other methods were better for string-similarity matching because the other methods are based on the word overlap technique.
Table 1 delineates the comparative results of matching accuracy and similarity scores between two categories of string similarity methods: (1) token-based similarity methods, including the Jaccard index, Sørensen-Dice, cosine similarity, overlap coefficient, and fuzz.token_set_ratio; and (2) hybrid similarity methods, namely Jaro-Winkler and Monge-Elkan. Upon considering the mean scores, it is discerned that token-based similarity methods yield a higher average score compared to hybrid similarity methods. Consequently, the token-based similarity method emerges as suitable for this case study. Looking more closely at the token-based methods, we see that the overlap coefficient and fuzz.token_set_ratio have similar scores.
Based on the exactitude comparison reported in Table 1, this research used the “fuzz.token_set_ratio” method for string-similarity matching. Although the “overlap coefficient” method produced the highest average score, the “overlap coefficient” method yielded the highest score values for more than one column. Therefore, it returned a false value. The “fuzz.token_set_ratio” method matched all the actual results and had an average score of about 0.76% lower than the “overlap coefficient” method. Based on evaluation of the practicability of application in this comparison, the “fuzz.token_set_ratio” method was more suitable for this research.
4.2. Discussion
When employing a specific BI software package, such as Weka, Pentaho, or Power BI, users need to understand how to select the required columns of data to run the BI process by themselves. This study eliminates this gap by developing a smart BI using semantic technology and providing user-friendly BI software for non-technical users. The previous works mainly applied ontology techniques to collecting and retrieving KPI values (Bai et al., 2014; del Mar Roldán-García et al., 2021; Maté et al., 2017). Some works used the ontology concept to create knowledge sharing between systems (Özcan et al., 2021; Walzel et al., 2019) by applying the ontology concept, data storage, and queries for information. However, this study proposes the ontology concept to store the database structures of different systems and share this information within the research framework, to promote suitable class matching and factor dictionary creation.
From the research question, “How can we decrease the complexity between non-technical user skills and database structure understanding using the ontology concept?”, when non-technical users use BI software for data visualization, they first must understand the data structure in the table form of a database. These users may be managers who need help understanding database concepts. In this situation, IT staff or data scientists become the responders. The decision-maker has no choice but to wait for the information from the responder. Therefore, the organization’s decision must take time (Alpar & Schulz, 2016; Lennerholt et al., 2018). The results of this study present the processes that go through database structure understanding before non-technical users work on the BI software. DSMO is the model used in the relationship learning process between the databases of various information systems. When the learning process is finished, we will save DSMO by renaming it as DSO. Hence, DSO is the instance of DSMO and uses it to share knowledge about the relationships of all databases in the information systems. DSMO and DSO will decrease the complexity between non-technical user skills and database structure understanding, because these users do not need to analyze the relationships of all databases. They can go through this complexity, and faster, to make decisions.
Many research studies have demonstrated the capacity for application systems to share information between systems through the concept of ontologies (Özcan et al., 2021; Walzel et al., 2019). Our research results, focusing on DSO, corroborate this assertion, as DSO serves as a center of knowledge regarding database relationships across multiple information systems. A significant finding is that the MapDS-Onto framework can be employed to match data across various information systems and provide appropriate data references to non-technical users. This framework utilizes DSO to familiarize itself with other systems in this environment and inform non-technical users about the most suitable data. As a result, these users do not need to understand how data is related within the database system.
Underpinning this framework are two pivotal algorithms, DaSMap and DoSMap. DaSMap algorithm employs DSMO and adapts the schema-based mapping to the RDF graph, as proposed by Zhao et al. (2019), thereby formulating a novel method for transforming database schema to the RDF. Central to the DoSMap algorithm is the method of string similarity comparison. The DoSMap algorithm reveals that token-based similarity methods, such as the “Fuzz.token_set_ratio” method, are more suitable than hybrid similarity methods. This finding aligns with the findings of Appa Rao et al. (2018), which posited that token-based similarity methods were more suitable than character-based methods for matching mathematical formulas. These results complement the research of Appa Rao et al. (2018), given that their study did not draw comparisons between the accuracy scores of token-based and hybrid similarity methods.
The three key findings of this study include: (1) DSMO, which serves as the model for creating DSO, a repository of knowledge about data relationships across multiple databases; (2) DaSMap and DoSMap, algorithms programmed within the MapDS-Onto framework; and (3) the “Fuzz.token_set_ratio” method, suitable for string similarity searching in this domain.
DSMO is a simple model for learning data relationships between the databases in the case study. An organization can reuse DSMO as a tool for creating data relationship knowledge and sharing this knowledge as a plugin on existing business software. The case study results guarantee the benefit of DSMO: creating automation through a neural framework. DSMO is converted to DSO in order to create a knowledge bank of data relationships. DSO is the knowledge of the data relationship that will be shared within the system. Many algorithms, as in Figs. 3-Fig. 4Fig. 56, present the programming process of data relationship learning and matching. The two main uses of this algorithm are DaSMap and DoSMap. The BI software developer can modify DaSMap to learn the data relationships in the different systems and adapt the DoSMap to match the suitable data in the search process. Furthermore, the “Fuzz.token_set_ratio” is the verified method that fits the string similarity comparison between the factor of the KPI formula and the data in database systems.
The benefits of this study from the point of view of non-technical users will happen after their existing BI system is improved. The many complexities of BI regarding database understanding will be replaced with the automatic matching process. The improved BI will be more user-friendly than in the past.
4.3. Limitations of This Study
-
The result correction of the MapDS-Onto framework has been tested solely with databases from two information systems. Consequently, the complexity of the data across all information systems within the organization may influence the accuracy of this framework.
-
The MapDS-Onto framework has been designed based on the RDB system. Nonetheless, consideration should be given to other database formats, such as NoSQL, Excel, and text files. In the future, this framework is anticipated to develop a plug-in or an extension to accommodate these alternative database formats.
5. CONCLUSIONS
This research presented a new process to reduce obstacles related to the mismatch between the complexity of BI systems and skills and database structure understanding of non-technical BI users, using the ontology technique. The ontology concept was applied to create a DSO where the ontology shared knowledge about the relationships between columns and tables in different information systems. All of the results from the case study indicated that the MapDS-Onto framework, DaSMap algorithm, and DoSMap algorithm are a practical way to build ease of use into BI systems and mitigate problems related to complexity, because users simply have to add the properties of the KPIs of the strategic information they wish to monitor, and their related formulas, into this framework. The MapDS-Onto framework also addresses situations where multiple databases have the same column names using the “SelectedClassDictionary” function. This function checks the consistency between the KPI’s domain and database descriptions; therefore, it is ensured that the selected column will fit with the database related to the KPI’s domain. The MapDS-Onto framework uses the “fuzz.token_set_ratio” method to search out suitable columns of data from multiple databases to use in the monitoring process of semantic BI systems.
ACKNOWLEDGEMENT
This work was supported by the Digital Science for Economy, Society, Human Resources Innovative Development and Environment project, funded by Reinventing Universities & Research Institutes under grant no. 2046735, Ministry of Higher Education, Science, Research and Innovation, Thailand.
REFERENCES
, (2016) Self-service business intelligence Business & Information Systems Engineering, 58, 151-155 https://doi.org/10.1007/s12599-016-0424-6.
, , , (2018) A partial ratio and ratio based Fuzzy-Wuzzy procedure for characteristic mining of mathematical formulas from documents ICTACT Journal on Soft Computing, 8, 1728-1732 https://doi.org/10.21917/ijsc.2018.0242.
, (2012) Business intelligence as a key strategy for development organizations Procedia Technology, 1, 102-106 https://doi.org/10.1016/j.protcy.2012.02.020.
, (2019) Business intelligence and analytics use, innovation ambidexterity, and firm performance: A dynamic capabilities perspective The Journal of Strategic Information Systems, 28, 101578 https://doi.org/10.1016/j.jsis.2019.101578.
, , , , , , , (2020) Tools to measure, monitor, and analyse the performance of the Geneva university hospitals (HUG) Supply Chain Forum: An International Journal, 21, 117-131 https://doi.org/10.1080/16258312.2020.1780634.
, , , , (2021) Ontology-driven approach for KPI meta-modelling, selection and reasoning International Journal of Information Management, 58, 102018 https://doi.org/10.1016/j.ijinfomgt.2019.10.003.
, , , , (2021) Business intelligence framework design and implementation: A real-estate market case study Journal of Data and Information Quality, 13, Article 10 https://doi.org/10.1145/3422669.
, , (2020) Semantics-preserving optimisation of mapping multi-column key constraints for RDB to RDF transformation Journal of Information Science, 0165551520920804 https://doi.org/10.1177/0165551520920804.
, , (2017) A business intelligence approach to monitoring and trend analysis of national R&D indicators Engineering Management Journal, 29, 244-257 https://doi.org/10.1080/10429247.2017.1380578.
, , (2017) Data science in education: Big data and learning analytics Computer Applications in Engineering Education, 25, 1066-1078 https://doi.org/10.1002/cae.21844.
, , (2012) Ontologies versus relational databases: Are they so different? A comparison Artificial Intelligence Review, 38, 271-290 https://doi.org/10.1007/s10462-011-9251-9.
, , (2017) Specification and derivation of key performance indicators for business analytics: A semantic approach Data & Knowledge Engineering, 108, 30-49 https://doi.org/10.1016/j.datak.2016.12.004.
, (2001) Ontology development 101: A guide to creating your first ontology https://www.cs.upc.edu/~jvazquez/teaching/sma-upc/docs/ontology101.pdf
, , (2020) Improving health care management in hospitals through a productivity dashboard Journal of Medical Systems, 44, 87 https://doi.org/10.1007/s10916-020-01546-1.
, (2009) Managing sustainability with the support of business intelligence: Integrating socio-environmental indicators and organisational context The Journal of Strategic Information Systems, 18, 178-191 https://doi.org/10.1016/j.jsis.2009.06.001.
(2020) Information visualization to support the decision-making process in the context of academic management Webology, 17, 216-226 https://doi.org/10.14704/WEB/V17I1/a218.
, , , (2014) How information-sharing values influence the use of information systems: An investigation in the business intelligence systems context The Journal of Strategic Information Systems, 23, 270-283 https://doi.org/10.1016/j.jsis.2014.08.003.
, , (2018) The performance of text similarity algorithms International Journal of Advances in Intelligent Informatics, 4, 63-69 https://doi.org/10.26555/ijain.v4i1.152.
Quacquarelli Symonds (2021) QS World University Rankings 2021 https://www.topuniversities.com/world-universityrankings/2021
, , (2017) Successful business intelligence system for SME: An analytical study in Malaysia IOP Conference Series: Materials Science and Engineering, 226, 012090 https://doi.org/10.1088/1757-899X/226/1/012090.
(2018) Exploring the relationships between IT competence, innovation capacity and organizational agility The Journal of Strategic Information Systems, 27, 22-42 https://doi.org/10.1016/j.jsis.2017.07.002.
, , (2015) Ontology versus database IFAC-PapersOnLine, 48, 220-225 https://doi.org/10.1016/j.ifacol.2015.07.036.
, , , (2017) Data mining approach for detecting key performance indicators Journal of Artificial Intelligence, 10, 59-65 https://doi.org/10.3923/jai.2017.59.65.
, , (2020) A business intelligence framework for analyzing educational data Sustainability, 12, 5745 https://doi.org/10.3390/su12145745.
, , , (2016) String similarity search and join: A survey Frontiers of Computer Science, 10, 399-417 https://doi.org/10.1007/s11704-015-5900-5.
, , (2019) R2LD: Schema-based graph mapping of relational databases to linked open data for multimedia resources data Multimedia Tools and Applications, 78, 28835-28851 https://doi.org/10.1007/s11042-019-7281-5.
