1. INTRODUCTION
The concept of Human Resource Management and the level of job satisfaction among the employees of an organization or an institution is a subject of public interest and is widely studied in the contemporary period, especially in the corporate sector, where always the emphasis is laid on the level of job satisfaction of its human resource, which they rate as their ultimate asset. The trend of assessing job satisfaction among human resource has moved beyond corporate sector and these days we can see people associated with whatever sector, be it government, public or private seek interest in assessing the level of job satisfaction among its employees. Given the fact, the present study lasts around the level of job satisfaction among the practicing library and information science professionals in India.
The definition of ‘job satisfaction’ varies considerably from person to person, each individual has his/her own perception of job satisfaction based on reasoning. Still, there are some generalized definitions, which we can make out to help understand what job satisfaction is all about. Schneider and Snyder (1975) considered job satisfaction as an effective response employees make about their work and organization. Ejiogu (1980) described job satisfaction as the total individuals, social and psychological well being, where factors like interpersonal relations, pay, fringe benefits, promotions, involvement in the decision making process and proper communication are presupposed. Middlemist and Hilt (1981) observed that job satisfaction is more about having a good or bad feeling about one's job and the work environment in which they work. Arnold and Feldman (1986) believe that job satisfaction is about having positive effect of work done, the environment in which one is working and being emotionally attached towards one job. Hoy and Miskel (1987) opined job satisfaction as psychological, physiological and environmental circumstance under which a person says I am satisfied with my job. The authors further argue that job satisfaction is more about bringing all round fulfillment, job security, earnings, growth and advancement with cordial interpersonal relationship both at subordinate and super-ordinate level.
The modern day Library and information science is more than 130 years old, but the subject could not strike to its prominence, to which it otherwise should have. A good number of subject fields, which despite being much younger to Library and Information Science, have struck to prominence within the shortest span of their coming into existence. It is being equally observed that LIS professionals across the world in general and India in particular do not enjoy that good professional standing as do professionals from other sciences or their contemporaries from various other academic and professional fields enjoy. Given the fact, it becomes imperative to study the reasons which generally lead to job dissatisfaction among the library professionals of the world in general and India in particular.
Most of the studies, conducted in the field of assessing job satisfaction among employees, generally focus on areas like, Job Security, Salary, Promotion, Institutional Administration, Professional Position, Working Hours and Work Environment etc. focus has also been laid on the areas like, age, Professional Position, Nature and type of organization, organizational stability, places they actually belong to and the places they actually belong to, the places people work, and so on.
2. PROBLEM STATEMENT
The Library and information science profession, has not emerged as one of the forceful subject areas at the global level. The science has moved at a very gradual pace, with limited job market, which also is not being seen as rewarding & fulfilling, when compared to other professions. Even, the professionals joining the LIS profession are generally those, who exhaust their other options first. Given the fact, it was conceived to assess the levels of job satisfaction among the practicing LIS professional across India. Although India has a better job market for LIS professionals, but still, the budding professionals in India show reluctance in taking LIS profession as their first career choice.
3. RELATED LITERATURE
Job satisfaction has been studied by different researchers differently. However, the common practice prevalent among researchers is to study those components, which directly or indirectly influence their job satisfaction. While studying the level of job satisfaction among the Greek academic librarians, (Togia, Koustelios & Tsigilis, 2004), assessed the components like working conditions, pay, promotion, job itself, supervision and organization as a whole. The researchers observed that levels of job satisfaction among professionals varied from component to component, as the majority of the professionals were found satisfied with the job itself, supervision and working conditions but were dissatisfied with the pay and the promotion.
In the prevailing IT environment, being a technophobe or technophile can equally become a reason for job satisfaction or dissatisfaction. To assess the impact of automation on the job satisfaction of Moi University Library professionals of Kenya, Bii and Wanyama (2005) observed that library professionals were exceptionally happy about the automation of their library and more contented and satisfied with their work. There are some other components which in their own way affect the levels of job satisfaction among employees. Williamson, Pemberton, and Lounsbury (2005) studied career and job satisfaction in relation to personality traits of information professionals by collecting data from more than 1300 information professionals specialized in a variety of areas. The researchers observed a significant correlation between personality variables with the career and the job satisfaction. The researchers further observed that variables like optimism, emotional stability, teamwork, visionary work style, and drive to work make up to a 20% difference in job satisfaction.
Levels of job satisfaction vary considerably from country to country and region to region, mostly depending upon the socioeconomic and other cultural environment of any given country or region. Khan and Ahmed (2013) studied the level of job satisfaction among the library professionals of University of Khyber, Pakistan and observed that Library professionals of Pakistan despite being committed to their profession are partly satisfied with their pay, promotions and other benefits and totally dissatisfied with supervision, cognitive rewards offered and the nature of work. Accordingly, Hyder and Batool (2013) while examining the job satisfaction among librarians of Pakistan, found that Librarians working in the public sector are more contented with their job than their counterparts working in the private sector. The authors observed that by not having a clear & defined career advancement scheme in place, the professional tend to show more dissatisfaction with their job.
Making independent observations about a concept or a subject at the gender level equally fascinates the researchers and so holds true about assessing the level of job satisfaction at gender level. Clark (1997) observed that compared to men, women have a greater degree of job satisfaction. Ward and Sloane (2000), while studying Scottish work force, observed that there is no considerable difference in the levels of job satisfaction or dissatisfaction at gender level. The researchers further observed that dissatisfaction with the institutional administration is a very common problem linked with the job dissatisfaction.
While assessing the job satisfaction among African Library professionals, Hart (2010) observed a mix of satisfaction and dissatisfaction among the African LIS professionals towards their job, which Hart described as a love hate relationship. Hate further found that despite 61% respondents showing satisfaction with their job, 50% showed willingness for change and only 51% felt proud of their job. The key areas of job dissatisfaction reflected by respondents include stagnation, remunerations and inadequate resources.
Nigeria is one of the leading LIS research countries in the African region (Pandita & Singh, 2015), and is one of the proactive countries, which raised issues concerning to its LIS professionals. Oladokun (1993) undertook a survey to assess the level of job satisfaction among the library Paraprofessionals of Nigerian Libraries. Oladokun highlighted various areas, which generally breed the dissatisfaction among the library Paraprofessionals, along with the aspects like reasons for landing in LIS profession, be it by choice or chance, along with their contentment with the professions in terms of rewards they reap or their future prospects. Similarly, Adio and Popoola (2010), while assessing the job satisfaction & professional commitment among the library professionals of Nigeria, collected primary data from 381 professionals from 24 universities & observed that only 20% respondents showed satisfaction with their job. The researchers recommend that adequate provisions in their work environment should be made and incentives loan and leave privileges, etc. should be extended to them.
Most of the studies conducted in India about the job satisfaction among library professionals have been generally undertaken either at district level or at the state level and no such major study have been conducted at the national level. Asadullah, Esmail and Nagarajan (2012) studied the job satisfaction among LIS professionals of Thiruvannamalai district of Tamil Nadu. Accordingly, Jange and Gavali(2014) studied the job satisfaction level among the library professionals in Maharashtra, India. The researchers observed that experienced, permanent and highly qualified library professionals are more satisfied with their job than freshers, temporary and lesser qualified professionals. Somvir and Kaushik (2012) in their study in Haryana, India observed that it is the job characteristics, which lead to job satisfaction and not the gender, organization type or their vocational needs.
Verma, Mahawar, and Narayan (2009) studied the levels of job satisfaction among the library professionals of the G. B. Pant University of Agriculture & Technology Library, Pantnagar. Application of ICT in library practices has helped a great deal in achieving higher levels of job satisfaction among LIS professionals, observe Bellary, Sadlapur, and Naik (2015) while studying LIS professionals of NMIMS Deemed University, Mumbai, and so was observed by Mondale, Bandyopadhyay, and Hasan (2014) while studying the LIS professionals of West Bengal. Parida (1998) studied the status of library professionals of Orissa and found that 80% of library professionals want to be treated under an academic cadre and should follow their own hierarchy and nomenclature of posts and positions.
4. OBJECTIVE OF THE STUDY
This study’s objective is to determine the overall level of job satisfaction among the practicing Library and Information professionals in India and the factors which influence job satisfaction or dissatisfaction among LIS professionals. Some of the key areas studied include salary, work environment, professional position, working hours, location, employee participation in administrative matters, recognition, and advancement.
5. METHODOLOGY & APPROACH
To undertake the present study, data were collected from practicing Library and Information professionals working across the length and breadth of India by a questionnaire method specially designed for the purpose. A pretest of the questionnaire was carried out by circulating it among nearly 20 respondents and after undertaking some necessary corrections was circulated among respondents. The data were collected purely by circulating the questionnaire online using Google services, and the link was hosted and cross-posted on various social networking sites like Groups, Facebook, LinkedIn, discussion forums, and e-mail. All the responses were received online and the analysis was carried out as per the objectives of the study. There was a need to structure data, especially to avoid duplication. In all 185 responses were generated, of which 8 responses were not found valid; as such analysis was carried out on 177 responses.
6. HYPOTHESIS
H1: Library and Information Science professionals working in the government sector have a greater degree of job satisfaction than their counterparts working in the public or private sector.
H2: Salary is a perquisite, but not the sole factor responsible for job satisfaction.
H3: With the increase in professional experience, job satisfaction increases.
Results: A total of 177 responses were generated during the period of investigation from practicing library professionals across India. Responses received were structured and then analyzed by using some basic mathematical expressions like addition, subtraction, multiplication, and drawing percentages.
6.1. Basic and Background Information about the Respondents
It was imperative to collect basic individual information about the respondents, which one or the other way influences their level of job satisfaction. Values indicated included: age, gender, professional position, type of organization an employee is working with, organizational stability, the place an employee actually belongs to, the place where one is working, and so on.
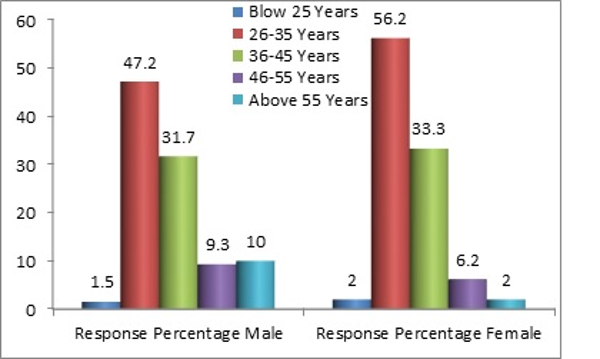
Of the total responses generated, male LIS professionals constitute 72.88% and females 27.12%. The majority of respondents, 49.71%, are in the age group of 26-35 years, of which males constitute 69.31% and females 30.69%. Th is also is the age group under which a maximum number of responses were generated, among both males and females. Th is is followed by 32.20% of respondents in the age group of 36-45 years, again the second highest response group among both male and female respondents. 8.47% response percentage was observed in the age group of 46-55 years and 7.90% above 55 years. The declining response percentage in the higher age groups can be owed to diff erent reasons, which includes lesser use of the Internet and other social networking sites by senior professionals along with lesser technological knowhow (See Table 1, Fig. 1).

Gender and Age Wise Response Distribution

Gender wise response percentage in the age groups
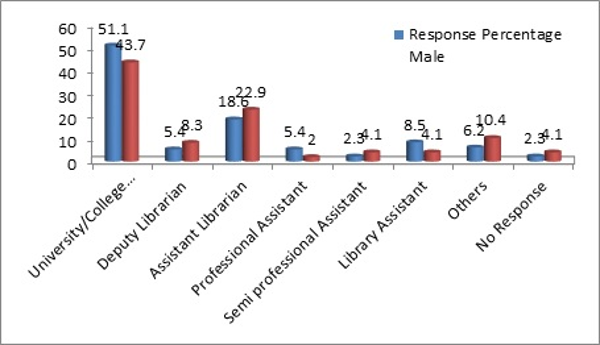
Nearly two-thirds of the respondents are placed at super-ordinate level and the remaining one-third are at a sub-ordinate position. Compared to 78.53% of respondents, who have shown dissatisfaction with their job, only 21.46% have refl ected satisfaction. Th is clearly indicates that status/social standing plays its part in drawing job satisfaction or dissatisfaction among the employees, whereby salary/remunerations by no means can be considered as the sole reason for drawing job satisfaction. From the fi gures it emerges that 49.15% of respondents are either university or college librarians, of which 75.86% are males or 24.14% females, which also means that these professionals have already reached the highest level of their professional career (See Table 2, Fig. 2).
Response Distribution on the Basis of Designation

Gender wise representation of professional status of respondents
Studying aspects like institutional affiliation of the respondents is important for the fact that the reputation and type or kind of institution an employee is working in is equally a step towards ensuring job satisfaction of an employee, as a range of interests of employees are protected by certain kinds of institutions, which vary considerably from institution to institution. Th e general approach of an employee while seeking job satisfaction looks for benefi ts like job security, good salary, welfare programs, insurance coverage, and many more privileges, which work in the direction of ensuring greater job satisfaction.
From the tabulated fi gures, it emerges that LIS professionals in India seek more job satisfaction in the government sector, as it ensures greater job security and greater length of service. Also, the reputation of an institution or for that matter, of the corporate house, plays its own part in seeking job satisfaction (See Table 3).
Response Distribution on the Basis of Institutional Affi liation (Type)
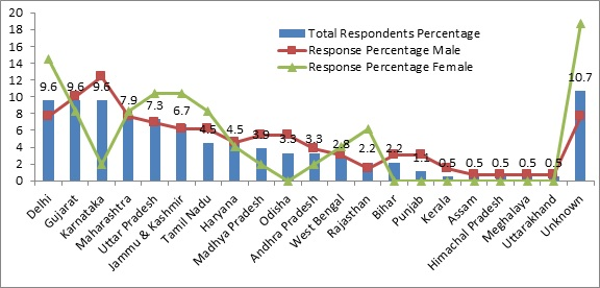
India is a very vast county, having over 1.2 billion population, spread across 36 states and union territories, having a total area of 3,287,240 sq. km. Responses were generated across 20 state and union territories of the country, constituting 2,897,848 sq. km, which represents 88.15% of the territory of the country. The response percentage of professionals working in metropolitan cities like Delhi and other developed cities and states like the Gujarat and the Karnataka has been quite encouraging, which can be owed to the presence of better IT infrastructure in these cities, along with access to the Internet.
It is quite evident from the tabulated figures that compared to females, males tend to move outside their home state for a job. Since the majority of respondents, 67.23%, are working in their home state, of which 73.10% are males and 26.89% females and 22.03% respondents work outside their home state, constituting 82.05% male professionals and 17.94% female professionals, this is an indicator of the fact that dislocation for a job may be a reason for job dissatisfaction, but working at a native place may not necessarily lead to job satisfaction. LIS professionals from Bihar and Odisha are mostly working outside their home state. On the whole, LIS professionals across 25% of the country prefer to work in their home state and professionals from 75% of the territory are willing to work outside their home state and compared to male professionals from 92.30% of national territory, female professionals from 23.07% work outside their home state (See Table 4, Fig. 3).
State Wise Response Distribution

State level representation of respondents
6.2 Professional Information and Satisfaction Level of Respondents
Respondents were asked to record their levels of agreement on some basic dichotomous question about their profession and their level of job satisfaction.
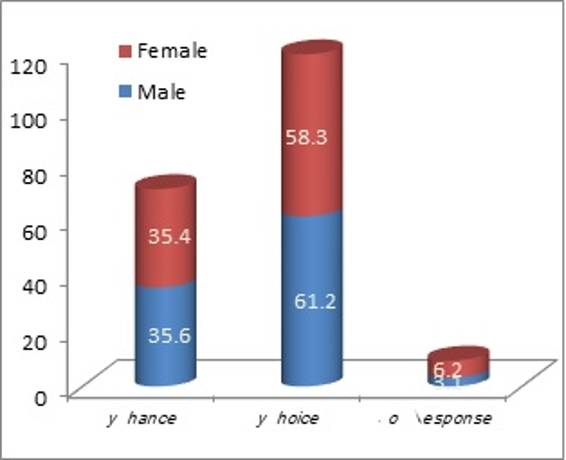
Landing in a particular profession can be by either choice or by chance, given the fact, the respondents were asked, as how did they land in LIS profession, and to our surprise 35.59% respondents replied that they landed in the LIS profession by chance, of which 73.01% were male respondents and 27.99% female respondents. While as, 60.45% respondents replied that they joined the LIS profession by choice, of which 73.83% respondents were male and 26.17% female. Compared to 35.65% male respondents, 35.41% female respondents landed in the LIS profession by chance, while as, against 61.24% male respondents, 58.33% female respondents replied of being LIS professionals by choice (See Table 5, Fig. 4).
Respondents were Asked about their Entry into LIS Profession

Representation of professional choice by respondents
The social status of a professional is the indicator of his/her level of satisfaction with his/her job. Given this fact, 64.97% of respondents have replied that LIS professionals in India do not enjoy the social status on par with teaching professionals, while 31.63% of respondents replied that status as such is not a problem among LIS professionals. 41.80% of respondents replied that being despised by the other professionals is equally a reason for them being dissatisfied with their job, while 51.41% of respondents don’t see this as a reason for their dissatisfaction.
Salary is one of the greatest motivational forces. Of the total respondents, 36.15% of replied of being underpaid and the case is almost same for both male and female professionals, however, 59.88% of respondents reported being paid salaries as per the norms. While, 45.76% replied that they do not participate in the administrative and policy matters of their institution. The majority (50.28%) of respondents accepted such participations; while at the gender level, compared to 47.28% of male respondents, 41.66% of female respondents did not participate in the policy matters of their institution, while against 51.16% of male respondents, 47.91% of female respondents agreed to their participation in policy matters of their institution.
Operational autonomy and authority are two different but interrelated components which by no means can be used interchangeably. 62.71% of respondents agreed about enjoying operational autonomy, while 27.11% denied enjoying any such autonomy. Accordingly, 53.67% of respondents replied that they enjoy complete authority in library affairs, while 38.98% say they do not. It is interesting to note that compared to 50.38% of males 62.50% of female respondents reported enjoying authority. 36.72% of respondents expressed concerns for not being consulted by the institutional administration for professional matters. Also, 50.84% of respondents replied that they face undue administrative interference in their library affairs.
Indian higher education system library professionals are rated on par with teaching professionals, but still 41.24% of respondents say they are not satisfied with the parity maintained between the two groups. However, 44.63% of professionals are happy about the parity maintained between the two groups. Compared to 42.63% of male respondents, 37.50% of female respondents replied that disparity exists. 77.40% of respondents have shown their willingness to change their present employer, while 15.25% are not ready for the change. At the gender level, compared to 79.84% of male respondents, 70.83% of females expressed their willingness to change their present employer. However, compared to 14.72% of male respondents, 16.66% of female respondents are not ready to change. Th is also signifies that compared to men, women reflect slightly higher levels of job satisfaction (See Table 6).
State Wise Response Distribution
While recording the level of job satisfaction, 40.11% of respondents replied that they are satisfi ed with their present employer, 41.24% are partly satisfied, 8.47% are totally dissatisfied, 3.38% respondents are partly dissatisfi ed, and 3.38% respondents are not sure, while 2.82% of respondents did not reply to this particular question. At the gender level, compared to 34.89% of male respondents, 39.58% of female respondents have shown their satisfaction with their present employer, while against 6.20% of male respondents, 14.58% female of respondents are dissatisfi ed (See Table 7).
Respondents’ Level of Job Satisfaction with their Present Employer
Respondents were given free choice to opt for as many options as they fi nd appropriate, and accordingly 39.54% of professionals have shown their satisfaction with salary, 43.50% of respondents are satisfied with their work environment, and 35.02% of professionals are satisfied with their working hours. Apart from these values, 28.81% of professionals believe in having interpersonal relationship at the work places, and 27.11% opined that work done by the employee should get recognized. 22.03% of respondents are satisfied with their advancement, while only 15.81% of respondents have shown satisfaction in all the aforementioned spheres, and 23.72% of respondents have not replied to this particular question (See Table 8).
Respondents’ Level of Job Satisfaction against the Identified Variables
57.6% of respondents rated job security as an important component of job satisfaction, while a meager 7.9% of respondents categorically opined that job security is not important for job satisfaction. At the gender level, compared to 57.36% of male respondents, 58.33% of female respondents replied that job security is always important for job satisfaction, while against 9.30% of male respondents, 4.16% of female respondents opined that job security is not important for job satisfaction (See Table 9).
Respondents were Asked, is Job Security Important for Job Satisfaction
Respondents were asked about their dissatisfaction level with their present employer, 44.06% agreed on being dissatisfied with their present employer, while 36.72% partly agreed to it and 5.64% of respondents totally disagreed. At the gender level, compared to 45.73% of male respondents, 39.58% of female respondents showed agreement with it, while compared to 35.65% of male respondents, 39.58% of female respondents partly agreed with it (See Table 10).
Respondents’ Level of Agreement with the Dissatisfaction of Job with their Present Employers
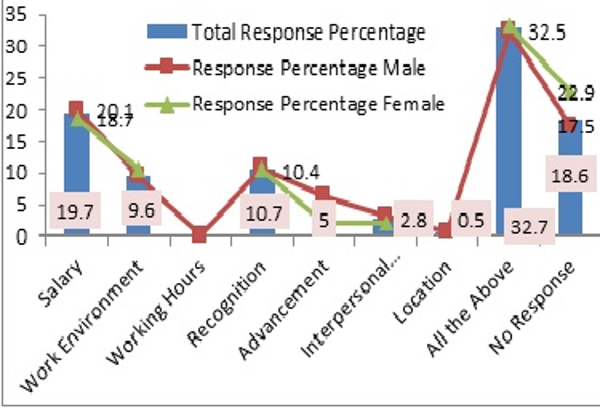
19.7% of respondents replied that salary would be their prime consideration while seeking new employment. Th e other considerations given by respondents as per their standing order, given the number of responses received are recognition, work environment, advancement, interpersonal relationships, and location. The interesting aspect is that the maximum 32.76% of respondents rated all the above as their prime considerations while going for a change. Working hours are hardly a consideration as not even a single respondent has opted for the reason. At the gender level consideration, compared to males, females have shown a greater degree of concern towards work environment (See Table 11, Fig. 5).
Respondents’ Prime Consideration while Going for a Job Change

Some prime reasons for change of employer
15.81% of respondents replied that their reservations on policy matters are always given consideration, 31.63% have replied that sometimes they are, 5.64% said rarely, 9.03% replied never, and 1.12% replied the others. Th e majority (36.72%) of respondents did not reply to this question (See Table 12).
Respondents Reply with Regard to Considerations Given to their Reservations on Policy Matters Concerning an Institution
In regard to administrative interference, 18.64% of respondents always see this interference, while 40.11% see it sometimes and 22.03% rarely. Only 7.90% of respondents replied that their institutional administration never interferes in their library affairs. At the gender level, compared to 20.93% of male respondents, 12.50% of the female respondents rated the degree of interference as always; and against 41.86% of males, 35.41% of females deem this interference as sometimes, while on the rest of accounts both males and females have almost the same percentage of agreement (See Table 13).
Respondents were Asked about Recording their Level of Agreement of Administrative Interference in their Library Affairs
The respondents were asked how they will react in case their opinion is not given consideration while enforcing policy decisions. 2.25% of respondents replied that they will resign if their policy decisions are sidelined by the administration, while 34.46% replied that they will object to any such non adherence, but won’t resign, 6.21% replied that they will accept it and won’t react to it, and 26.55% respondents are of the view that they will fight it out. 19.77% are not sure about their reaction, while 1.69% opt for reacting by other means, and 9.03% of respondents have not replied to this particular question. The tendency of reaction at the gender level showed a slight variation, as no women respondent has opted for resignation, while compared to 33.33% of male respondents, 37.50% of females have opted for objecting to the decision and fighting it out (See Table 14).
Respondents were Asked to Record their Levels of Reaction if Sidelined by the Institutional Administration to Enforce the Library Policy Decision
7. FINDINGS AND DISCUSSION
Apart from various reasons discussed and analyzed above, individual perceptions do contribute to levels of job satisfaction or dissatisfaction. Domestic or familial displeasures do play their part and the people suffering on this account mostly show signs of dissatisfaction in the workplace. Besides, the human being by nature is a wanting animal: The more he gets, the more he wants. Given this fact, what we are satisfied with today will no more continue to give us an equal amount of satisfaction tomorrow. The overambitious nature of an individual leads to job dissatisfaction.
Components like salary, work environment, working hours, interpersonal relationships, recognition, advancement, and many more are very important for seeking job satisfaction and most of us are keen to seek contentment on these fronts. By rating work environment over salary, we can emphatically say that money is not always the consideration and cannot always be a reason for job satisfaction. Accordingly, working hours, interpersonal relationships, recognition, and advancement are the other components which can lead to better job satisfaction. Compared to males, females seek satisfaction in working hours, interpersonal relationships, and recognition of their work, whereas males seek more satisfaction with salary, work environment, and advancement.
More than 49% of respondents were in the age group of 26-35 years, of which 86.36% of respondents have shown dissatisfaction with their job. Thereby it becomes evident that young professionals at the entry level show satisfaction with their job, but gradually they start showing the signs of dissatisfaction in excelling in their professional sphere. Hence this can be termed as one of the reasons resulting in a higher percentage of job dissatisfaction among young professionals. The elderly and seasoned professionals normally overlook various shortcomings and seemingly are not prone to change when compared to their younger colleagues. However, 78.57% of respondents above 55 years of age have shown willingness to change their present employer. Over 46% of respondents in the age group of 46-55 years have expressed their satisfaction with their job and are not willing to change their present employer. This also has somewhat proved our hypothesis-H3 that experienced professionals have a higher degree of job satisfaction. It has also emerged from the analysis that LIS professionals working in subordinate positions are somewhat dissatisfied with their super-ordinates, for different reasons.
The private sector of Indian higher education has shown a bit of dismay, as more than 82% of respondents working in the private sector have shown dissatisfaction with their job, upholding the hypothesis-H1. It is needless to remind that the modern day private sector seeks its roots in the traditional practices of capitalism, which is typically hell-bent to exploit employees, with the only aim to maximize profit.
Salary, though a major component, is not the only reason which may lead to job satisfaction or dissatisfaction. Although more than two-thirds of the respondents have reflected that they are satisfied with their salary, therefore, if still more than 78% respondents have shown dissatisfaction with their job and more than 77% professionals are ready to change their job, this corroborates the fact that salary is not the only consideration for employee job satisfaction, which is in correlation to the hypothesis-H2 of this study. However, compared to males, a slightly lesser percentage of female professionals have expressed a desire for employment change.
Sense of belonging is one of the foremost prerequisites which creates a greater level of job satisfaction among employees, and this is what the top management of the institution can ensure by encouraging the participation of employees from the subordinate cadres in the decision-making process of the institution. If more than 50% of respondents are saying that they do not enjoy any such participation in administrative matters, this somewhat questions the administrative functioning of the institution and justifies the resentment.
Library professionals in India generally have more responsibility but lesser authority. The fact remains that responsibility without authority is meaningless and assigning responsibility without authority is more about adding to their vows. Institutions or organizations involving human resources should evolve employee-friendly policies for successful running and efficient functioning, which in itself becomes a reason for job satisfaction.
8. REMARKS, RECOMMENDATIONS, AND CONCLUSION
• In India, every third person enters into the LIS profession by chance and not by choice, while as, more than two-third of the LIS professionals in the country has expressed the desire to go for a change, if given opportunity.
• Male LIS professionals in India are quite open to avail any better job opportunity outside their home state, while as, female professionals generally show lesser tendency towards any such opportunity.
• Female LIS professionals in India are more satisfied with working hours, interpersonal relationship, and recognition of their work. While as, their male counterparts have shown more contention with salary, work environment and advancement.
• Compared to male LIS professionals, female LIS professionals in India appear to be enjoying more authority with greater participation in administrative matters.
• The work environment is emerging as a forceful reason which leads to a greater degree of job dissatisfaction and a major reason for seeking a change.
• Administrative role by no means should transgress to the extent, whereby it may be seen as an inference.
• Job Security, Good Salary, Welfare Programmes, Insurance Covers and other privileges should be extended to the employees, as these measures ensure a sense of belongingness and prove counterproductive to job satisfaction. Upon natural or unnatural death, service benefits of an employee should get easily extended to his/her legal hires hassle free.
• In India, governing bodies like, Ministry of HRD, UGC, AICTE etc. must ensure, that private sector involved with the higher education by no means should flout the norms.
• LIS professionals should always have a greater say in the matters, which pertain to libraries and their professional interest. Institutional administration should always take into confidence the professionals, while framing the policies of any sub-institution.
• Responsibility without authority is meaningless, where former cannot be entrusted without latter.
The greater the level of job satisfaction among the employees of an organization, the more productive its human resources will prove for an organization or an institution. Delegating authority to the working professional should always be the priority of top administration. It is always advisable that a good management practice is the one which involves participation of employees at all levels of the decision-making process. Therefore, if the seniors and experts are sidelined from the decision-making process, this is bound to develop a sense of insecurity among its employees, as this leads to alienation from the system of which they otherwise are the part and parcel.
If LIS professionals feel that their profession is not that rewarding and see any existing disparities, the need is to abolish them forthwith. Reservations shown by respondents on matters like being underpaid, having a suffocating work environment, undue interference, and other administrative difficulties need to be looked into, so that better facilities can be put in place to overcome these infrastructural displeasures, if any.