1. INTRODUCTION
Evaluation of research performance is not only a crucial component of faculty appraisal in universities but also of great importance to external entities that provide research funding or assess academic institutions. Within the university system, research performance is typically the basis for promotion and tenure. For funding agencies, research performance of applicants is a key facet of proposal evaluation. For those who need to assess academic units, be it the universities, departments, or researchers, proper evaluation of research performance is mandatory for accurate appraisal.
The most common metric of research performance is the number of publications, especially those published in indexed journals. Publication count in indexed journals can be thought to represent the productivity of “quality” research since indexed journals are supposed to publish quality manuscripts. Indeed, to be accepted in indexed journals, a manuscript has to pass the quality standards of the editorin-chief, an editor, and two or more reviewers. There are variations in quality, however, across and within journals. To further complicate things, the perspectives, expertise, and tendencies of reviewers can also affect the manuscript review outcome.
As is the case with many standards, these variations do not affect the evaluation outcomes of very strong or weak performers in a meaningful way. However, for mediocre performers, especially those on the borderline, such variations can result in significantly different outcomes. For instance, a borderline manuscript may get rejected by reviewers with high standards or subject expertise, whereas another borderline manuscript may get accepted by reviewers who are more lenient or less familiar with the subject area of the manuscript. Also, researchers who publish more will get rated higher than those who publish less regardless of the quality of their research, as long as they publish in indexed journals.
In other words, indexed journal publication count, despite its intention to capture both the productivity and quality of research, falls short of its goal by ignoring quality differences between journals and manuscripts. Nevertheless, it forms the basis for the majority of research performance evaluation practices across the globe. The peer review approach commonly used for promotion and tenure introduces qualitative assessments of publications to research performance evaluation, but it is a resource-intensive and subjective process that can be greatly influenced by peer reviewers’ perspective, expertise, and inclinations. To circumvent subjective influences and streamline the research performance evaluation process, Korean universities employ prescriptive research assessment standards that aim to quantify research productivity and quality in a similar fashion to the indexed journal publication count.
Since each Korean university uses its own research assessment standard, we were curious to find out how the standards differ across universities and how they affect research evaluation outcomes. Furthermore, we were interested in discovering how well those standards measure research quality and what can be done to enhance the accuracy and sensitivity of such measures. To discover differences in university research assessment standards, we first examined and compared 25 standards from major Korean universities, after which we applied those 25 evaluation standards to the publication data of 195 tenure-track professors of library and information science (LIS) departments in 35 Korean universities to see how the standards affects the research evaluation outcome. To ascertain how well the standards measure research quality, we compared research performance scores computed according to university standards with scores generated by applying various bibliometric measures that estimate research impact, such as citation count, h-index, and impact factor. Based on these analyses, we assessed how robust the research evaluation standards of Korean universities are and explored how they may be modified to enhance the accuracy and sensitivity of research performance evaluation.
The rest of the paper is organized as follows: A review of prior research is presented next, followed by the description of methodology and discussion of results. The paper concludes with a summary of findings and suggestions for optimizing the research performance assessment approach.
2. RELATED RESEARCH
There have been numerous studies that investigated bibliometric measures for assessing research outcome, especially in the field of LIS. Budd and Seavey (1996), who evaluated LIS research in the United States, found no significant difference in publication counts across academic faculty ranks, directly contradicting the finding of an earlier study (Hayes, 1983). Adkins and Budd (2006) analyzed productivity rankings of authors and institutions based on publication data from Social Science Citation Index (SSCI) and found a statistically significant difference in publication and citation counts by faculty rank. Cronin and Meho (2006), who found a positive relationship between citation count and h-index rankings of 31 influential information science faculty members, suggested that h-index could complement the citation count in research impact assessment.

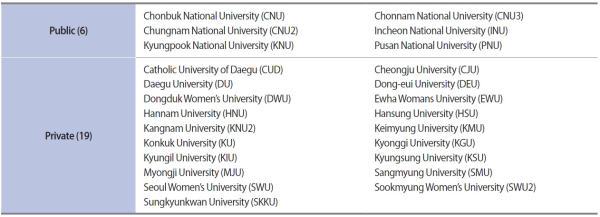
Selected universities with faculty research performance assessment standards
Yang and Lee (2012), based on bibliometric analysis of 2,401 LIS faculty publications in Korea, found an increasing trend of collaboration, publications, and internationalization in the LIS field in Korea. In a follow-up study, they (Yang & Lee, 2013) analyzed the LIS faculty rankings produced by various bibliometric measures such as publication count, citation count, h-index, and g-index and found that while publication counts correlate with citation counts for productive authors, no correlation was found between publication and citation counts of authors with the small number of publications.
In another study, authors J. Lee and Yang (2015) investigated co-authorship credit allocation models via comparative analysis of rankings produced by applying co-authorship formulas to 1,436 Web of Science (WoS) papers published by 35 chemistry faculty members at Seoul National University. Noting differences in rankings across models, the authors suggested that authorship patterns in conjunction with citation counts are important factors for robust authorship models.
In a related study, H. Lee and Yang (2015) investigated the co-authorship allocation standards of Korean universities by comparative analysis of author rankings based on university standards and bibliometric co-authorship measures applied to Korean LIS faculty publications. The study found the harmonic method to be most similar to the university standards and concluded that even the most generous university standards of co-authorship allocation still penalized collaborative research by reducing each co-author’s credits below those of single authors. In a follow-up study (H. Lee & Yang, 2017), they investigated publication venue score guidelines specified in university standards in conjunction with co-authorship allocation in a similar manner. Finding university standards to differ from bibliometric measures in some instances, the authors suggested incorporation of more granular impact assessment measures such as citation count and impact factor.
3. METHODOLOGY
3.1. Data Collection
Among the 35 universities with LIS departments in Korea, 25 universities with publically accessible faculty research performance assessment standards were selected as the study sample. About a quarter of the sample were public and three quarters were private universities. Table 1 lists the selected universities. For the study, we extracted formulas for scoring publication venues (e.g., SSCI journal) and coauthorship contributions (e.g., 1/n for n authors) from the sample standards.
The study also extended prior research (Yang & Lee, 2012) to compile the publication data of 195 tenure-track professors in 35 LIS departments in Korea from 2001 to 2017, which consisted of 4,576 publications and 31,220 citations as of August 2018. The publications included 3,996 domestic journal papers with 20,799 citations, 402 international journal papers with 8,198 citations, and 178 international conference proceedings with 2,223 citations. Proceedings papers from international conferences were included in the data collection since they are considered to be an important publication venue for dynamic research fields such as computer science and information science (Drott, 1995; Lisée, Larivière, & Archambault, 2008).
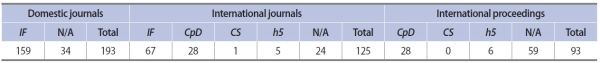
Publication venue and impact score distributions
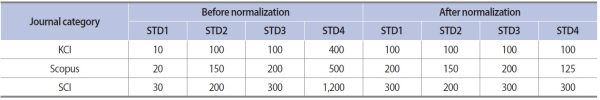
An example of journal category score normalization
The collection of publication data proceeded as follows:
-
1. A faculty list was compiled from National LIS Department Faculty Address Books1 and departmental websites.
-
2. Each name in the faculty list was used as a query to search National Research Foundation’s Korean Researcher Information system to generate an initial list of publications.
-
3. The publication list was supplemented by searching National Research Foundation’s Korea Citation Index(KCI) and NAVER Academic2 to collect additional publications as well as bibliographic information and citation count for each publication.
-
4. The citation counts of international publications were updated by searching Google Scholar.
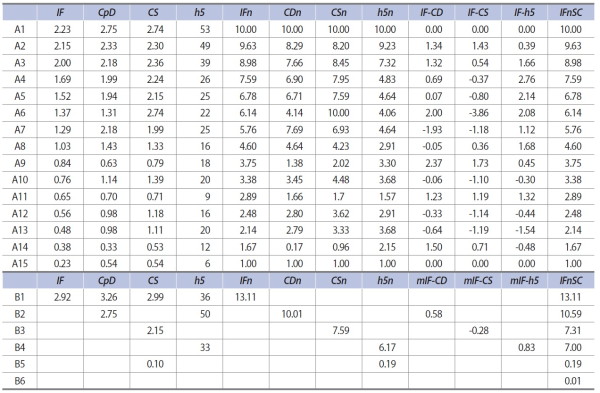
To estimate the quality or impact of publication venues bibliometrically, the study collected impact factor (IF) from KCI for domestic journals, and IF from WoS, Cites per Doc (CpD) from SCImago,3 CiteScore from Scopus,4 and h5-index from Google Scholar Metrics5 for international journals and proceedings, in that order of preference. There were 193 domestic journals, 125 international journals, and 93 international proceedings in the study data, of which 117 did not have impact scores of any kind. The distribution of publication venue and impact score used in the study are shown in Table 2.
3.2. Data Normalization
Although the research assessment standards include metrics for monographs and patents, the study focused on peer-reviewed journal papers, which is the most common form of scholarly communication. Since the university assessment standards for journal papers had similar journal categories (e.g., Science Citation Index [SCI]/SSCI, KCI, etc.) but different scoring scales, the standards were normalized by equalizing the KCI scores to make them comparable. The formula and Table 3 illustrates the journal category score normalization process for the university standards.
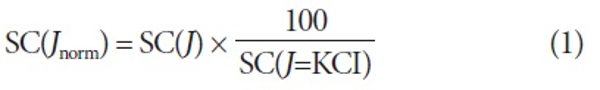
SC(J): original score for journal category J
SC(Jnorm): normalized score for journal category J
SC(J=KCI): original score for journal category KCI
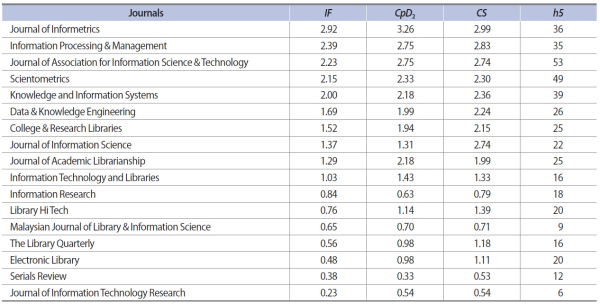
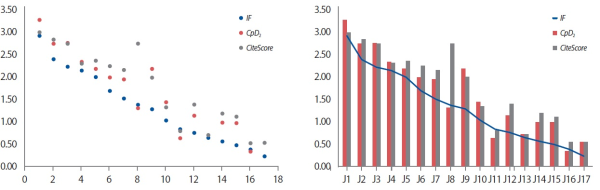
Journal and proceedings impact scores also had to be normalized since IF, CpD, CiteScore, and h5-index are not directly comparable measures despite their intent to estimate the impact of publication venues. CpD, CiteScore, and IF should be similar to one another since they essentially represent the average citation count per document. Indeed, Table 4 shows the sample values for IF, CpD2 (i.e., 2-year CpD), and CiteScore to be similar. CiteScore, being averaged over three instead of two years like CpD2 and IF, is generally larger than the other two, but the three measures approximate one another (Fig. 1).

Impact factor (IF), 2-year citations per document (CpD2), and CiteScore comparison.
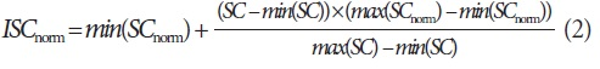
To compute the normalized impact score of publication venues, we mapped the impact scores to the sample set scale of 1 to 10 and added the average difference of normalized scores and the normalized IF (e.g., IF-h5) of a sample set. The steps outlined below describes the normalization process in detail:
a. Find the minimum and maximum values7 of h5-index, CiteScore, CpD, and IF.
-
b. Map h5-index, CiteScore, CpD, and IF to the scale of 1 to 10 using Equation 28 to compute h5n, CSn, CDn, and IFn.
-
c. Compute the average differences of IFn and h5n (mIF-h5), IFn and CSn (mIF-CS), and IFn and CDn (mIF-CD).
-
a. Select the first non-missing value from IF, CpD, CiteScore, and h5-index.
-
b. If the score (e.g., h5-index) is greater than or equal to the sample set minimum, map it to the sample set scale of 1 to 10 using Equation 2 and add the average normalized score difference (e.g., mIF-h5) to compute the normalized impact score (IFnSC).
-
c. If the score is less than the sample set minimum, divide it by the sample set minimum to compute IFnSC.
-
d. If all scores are missing, set IFnSC to be 0.01.
Impact score normalization example
The order of preference in Step 2a corresponds to the order of similarity to IF, while the least similar measure of h5-index drives the determination of the sample set to ensure the optimal approximation of the overall normalized impact score. Table 5 further illustrates the normalization process by example.
3.3. Data Analysis
To discover differences in research evaluation practices in Korean universities, we first normalized and compared 25 research assessment standards from major Korean universities. We then applied the evaluation standards to the LIS publication data to generate 25 sets of publication scores for each of 195 authors and 35 universities to produce author and university rankings according to each standard. The rankings produced by 25 standards were compared to ascertain how the differences in standards affect the research evaluation outcome.
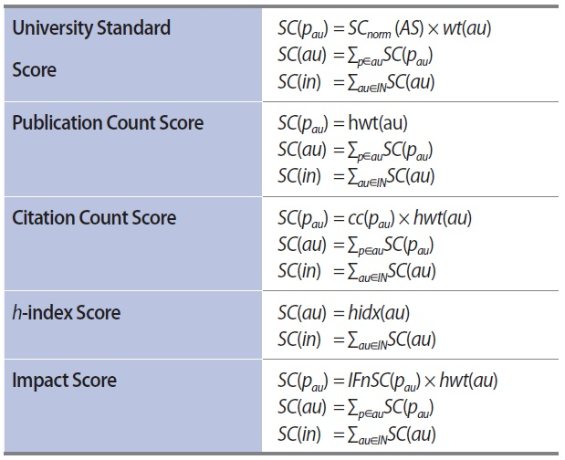
In order to assess how well the standards measure research performance, we then compared the rankings by university assessment standards with the rankings generated from applying bibliometric measures, such as publication count, citation count, h-index, and impact factor, to publication data. Specifically, the author ranking by publication count is based on the number of articles an author has published, citation count ranking is based on the number of citations an author received, h-index ranking is based on the h-index of each author, and impact factor ranking is based on the sum of normalized impact scores of the author’s publications. The university rankings are generated in a similar fashion by aggregating publication counts, citation counts, and impact scores as well as by computing the h-index for each university.
Bibliometric score computation
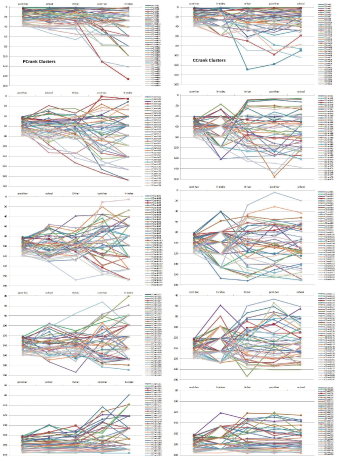
The study computed Spearman’s rank correlation to discover statistically significant differences between rankings, which reflects the differences in evaluation methods that generated those rankings. For rank correlation analysis, we examined rank cluster correlations since the overall rank correlation can mask the local differences (H. Lee & Yang, 2015). Four types of rank clusters were identified by ranking the scores by publication count (PCrank), citation count (CCrank), h-index (Hrank), and impact scores (ISrank) and partitioning the resulting rankings into groups (e.g., rank 1-40, rank 41-80, etc.). PCrank for authors, for instance, clusters authors with similar productivity level, while CCrank groups those with similar impact level and so on. The idea of rank partition types is to identify subgroups below author or institution level where local trends occur.
It should be noted that the study used the harmonic formula (Equation 3) in conjunction with bibliometric measures (e.g., citation count), which was shown to be closely correlated to the co-authorship credit allocation formula employed by universities (H. Lee & Yang, 2015, 2017), to fractionize the publication score according to coauthor contributions. At the university level, the publication scores of co-authors affiliated with the university are summed up to arrive at each publication score. Table 6 formalizes the score computations described above.
4. STUDY RESULTS
4.1. Analysis of University Standards
The university standards, which specify scoring guidelines for publication venues as well as co-authorship credit, follow a similar pattern of publication venue categorization and coauthor contribution computation. Publication venues are classified into 10 journal categories along with domestic and international proceedings. Journal categories, in the order of importance, are Science, Nature, Cell (CNS), SSCI, Arts and Humanities Citation Index (A&HCI), SCI, Science Citation Index Expanded (SCIE), Scopus, KCI, Korea Citation Expanded (KCIE), non-indexed international journal, and non-indexed domestic journal.
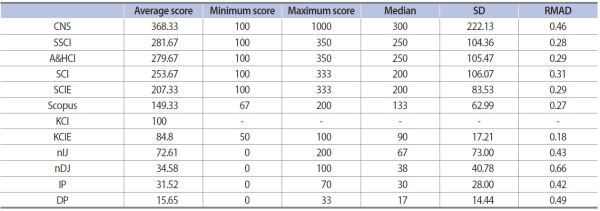
Over two thirds of the universities (17 out of 25) group SSCI, A&HCI, and SCI into a single category and only one differentiates between SSCI and A&HCI, thereby creating 7 major categories of CNS, WoS (SCI/SSCI/A&HCI), SCIE, KCI, KCIE, non-indexed international journal, and nonindexed domestic journal. In general, CNS journals count 1.5 times as much as WoS on average, WoS about 2.5 times KCI, and expanded category journals (i.e., SCIE, KCIE) are assigned about 80% of the non-expanded category scores while non-indexed journals and proceedings are given smaller fractions of the KCI score. Table 7, which lists normalized journal category score statistics, shows the widest range for CNS and high variabilities9 for nonindexed journals and proceedings.
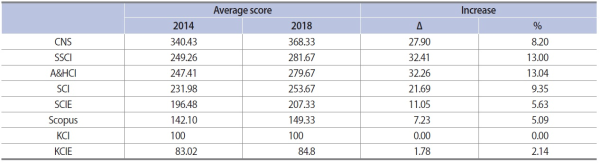
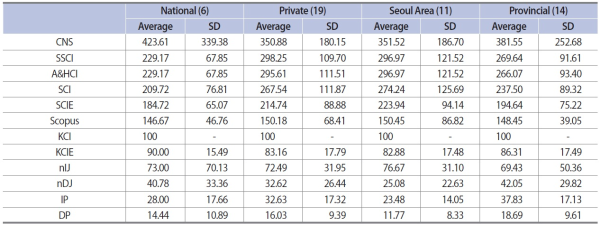
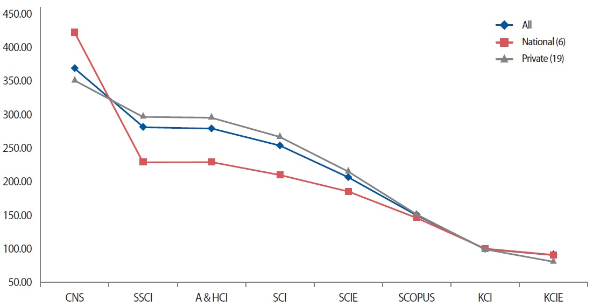
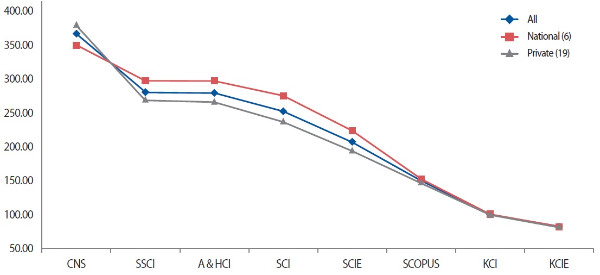
Comparison of the current standards with an older set of standards (Table 8) reveals a definite trend of increasing importance for internationally indexed journals over domestic journals. When we compare the standards by university type, it appears that private universities and universities in the Seoul area give more weight to WoS journals on average though the scores vary more widely than for their counterparts (Table 9, Figs. 2 and 3).
The co-authorship credit allocation component of the university standards, which has been investigated extensively by prior research (J. Lee & Yang, 2015; H. Lee & Yang, 2015, 2017), was excluded from the study to simplify analysis and focus on university standards in practice. Instead of conducting a complex investigation of publication venue and co-authorship allocation compound effect, the study used the actual combination of venue scores and co-authorship credit formulas for each university standard while coupling bibliometric measures with the harmonic formula that has been shown to be most similar to university standard co-authorship credit formulas (J. Lee & Yang, 2015; H. Lee & Yang, 2015, 2017).
Normalized publication venue category score statistics
Comparison of 2014 and 2018 standards
Comparison of standards by university type and region

Comparison of standards by university type. CNS,Science, Nature, Cell; SSCI, Social Science Citation Index; A&HCI, Arts and Humanities Citation Index; SCI, Science Citation Index; SCIE, Science Citation Index Expanded; KCI,Korea Citation Index; KCIE, Korea Citation Expanded.

Comparison of standards by university region. CNS, Science, Nature, Cell; SSCI, Social Science Citation Index; A&HCI, Arts and Humanities Citation Index; SCI, Science Citation Index; SCIE, Science Citation Index Expanded; KCI, Korea Citation Index; KCIE, Korea Citation Expanded.
4.2. Analysis of Rankings by University Standards
To ascertain the statistical significance of differences among university standards, the study applied 25 university standards to the publication data of 195 LIS tenure-track faculty members in 35 universities in Korea to generate 25 sets of rankings for each author and university. As was done in prior studies (H. Lee & Yang, 2015, 2017), rankings were partitioned to isolate and identify “local” trends (e.g., mid-level productivity group) that can be masked in overall statistics. A common example of such is the “averaging effect” that overwhelms differences in a subgroup when averaging over total population. Aggregating publication data over institutions also tends to mask local trends since differences among authors can even out at the institution level (H. Lee & Yang, 2015, 2017).
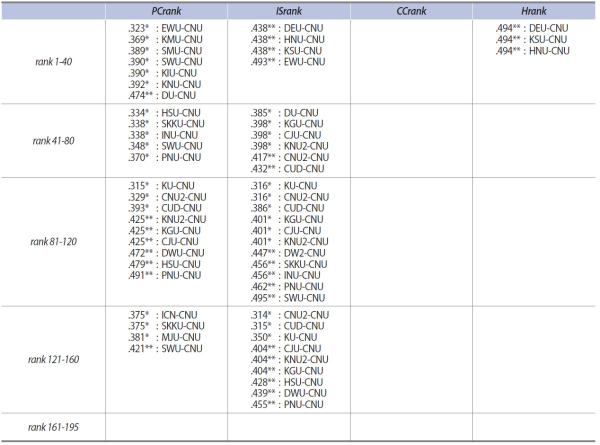
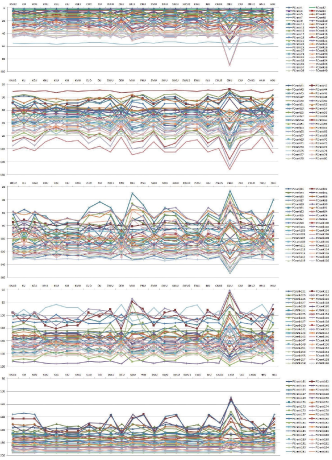
Spearman’s rank-order correlation results for author ranking clusters show evidence for the different research performance assessment standard employed by Chonbuk National University (CNU). This is likely due to the fact that CNU is the only university that awards SCIE journals 300 points (vs. a mean of 207) and one of three universities that give 200 points for Scopus journals (vs. a mean of 149). In addition, CNU’s co-authorship credit allocation formula gives more weight to co-authored papers with the denominator of (n+1) instead of more typical (n+2) where n is the number of authors. Table 10, which denotes the rank clusters where significant correlation values (i.e., rho) of standard pairs are below 0.5, and Fig. 4, which plots author rankings of PCrank clusters, clearly shows CNU’s standard to be more different than other university standards.
In Fig. 4, each line represents an author’s publication scores computed by 25 university standards. The more similar the standards, the flatter the slope of the line will appear. Implications of different rank clusters are not totally clear at this point and requires further study. Generally speaking, PCrank clusters of author rankings, which were arrived at by sorting author rankings by their publication count and partitioning them in groups of 40, identify author clusters of similar productivity, whereas CCrank clusters, sorted by citation count, identify author clusters of similar impact. More rho entries in the PCrank column than CCrank column in Table 10, for instance, implies that university standards will rank authors with a similar number of published articles more differently than those with a similar number of citations. More entries in rho middle rows (e.g., rank 81-120) rank suggests that mid-level authors are more sensitive to differences in evaluation standards than top-or bottom-level authors are, which is consistent with findings from prior studies (H. Lee & Yang, 2017).
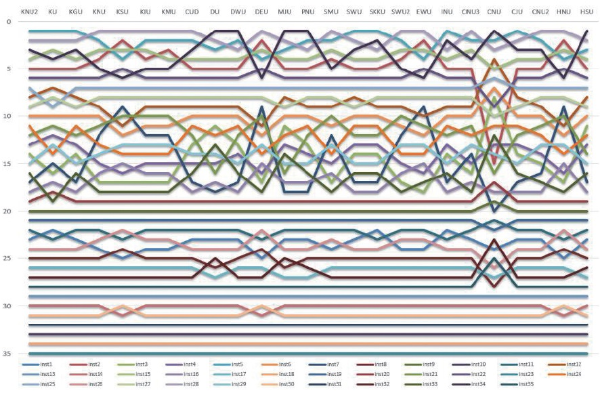
Institution rankings, in keeping with prior research findings, did not show significant differences and will not be included in the analysis other than to say that aggregation at the institution level can nullify any individual differences that may have existed at the author level. One may also posit that LIS departments in Korea have comparable levels of research performance. Fig. 5, which plots the rankings of LIS departments by university standards, is included for comparison purposes.

Author rankings by university standards: PCrank clusters.

Institution rankings.
4.3. Comparison of University Standards with Bibliometric Measures
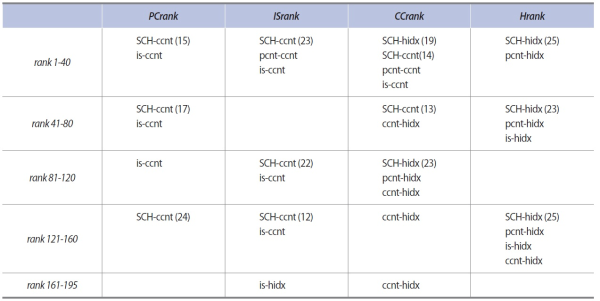
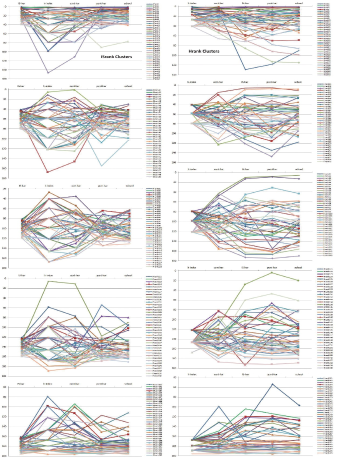
In order to test the reliability and stability of university standards for research assessment, we compared the rankings by university standards with rankings by publication count, citation count, impact score, and h-index.11 When we examine evaluation measure pairs with rho below 0.5 (p<0.05) for author ranking clusters in Table 11, we can see that university standards tend to differ from citation-driven evaluation measures such as citation count, h-index, and impact score. Citation count (ccnt), being the most granular measure of impact, is the most prevalent entry in Table 11, and h-index (hidx), being the least granular measure that often produces identical ranks, appear frequently in CCrank and Hrank clusters, which we believe is partially due to its low granularity. Lack of SCHpcnt and SCH-is pairs in Table 11 suggest that university standards are similar to publication count and impact score measures. This may be due to the fact that the majority of publications are articles published in domestic journals with similar impact scores.
As for bibliometric measure pairs, impact score and citation count (is-ccnt) shows weak correlations in PCrank and ISrank clusters while h-index pairings occur in CCrank and Hrank clusters as with the university standards. The pcnt-hidx in top Hrank clusters (rank1-40, 41-80) suggests that authors with high h-index do not necessary have to have high publication count. In fact, we can see in the author rankings of Hrank cluster plot (Fig. 7) that many authors in the top Hrank cluster (i.e., Hrank1-40) have low pcnt ranks (pcnt-har below 40) and those in the second Hrank cluster (i.e., Hrank41-80) have pcnt ranks above and below the rank interval of 41 to 80. In addition, there are many more data points for pcnt-har than for h-index even within the same rank range, which reflects the finer granularity of citation count that will also influence rho. The CCrank cluster plot in Fig. 6 shows similar patterns of rank discrepancies between citation count and h-index rankings. The granularity of ccnthar over h-index, especially in the top cluster, and wider rank spread of h-index in CCrank clusters are likely causes of low rho values shown in the CCrank column of Table 11. Incidentally, school12 in CCrank and Hrank clusters exhibits similar patterns of rank spread and granularity differences with bibliometric measures.
There is much to be gleaned from the rank cluster analysis but such is beyond the focus of this study. Both the rank cluster tables and plots clearly show that university standards differ from bibliometric measures in how they assess faculty research performance. Indeed, the university’s aim to introduce quality assessment into quantitative evaluation of research performance does not appear to have been effectively realized by the current standards.

Comparison of university standard and bibliometric measures: PCrank and CCrank clusters.

Comparison of university standard and bibliometric measures: ISrank and Hrank clusters.
5. DISCUSSION
Research performance evaluation in Korean universities follows strict guidelines that specify scoring systems for publication venue categories and formulas for weighing each author’s contribution to a co-authored publication. To find out how the standards differ across universities and how the differences affect the research evaluation outcome, we first examined 25 such standards, after which we applied the standards along with four bibliometric measures to the publication data of LIS faculty members in Korean universities to generate rankings by each evaluation measure. We then analyzed ranking differences by examining Spearman’s rank-order correlation outputs in rank clusters to ascertain the robustness of measures as well as to gain insights into how different measures influence the research evaluation outcome. We also introduced a novel impact score normalization method as well as analyzing the actual combination of publication venue scores and coauthorship credit formulas for each university in order to enhance the research methodologies employed in prior studies.
The results showed the university standards to be more or less similar to one another in general but different from citation-driven measures, which suggests the standards are not quite successful in quantifying the quality of research as originally intended. The standards not only do not differentiate between journals in the same category but also treat articles in the same journal to be of the same quality, thereby favoring in essence quantity over quality. In addition, the standards’ punitive scoring of co-authored publications discourages collaboration and multi-disciplinary research, which is the hallmark of a vibrant research community.