1. INTRODUCTION
In the latest Internet development, scientists can collect and analyze large data sets in order to recognize patterns of behavior of individuals or group of users (Lazer et al., 2009). Big data are vast amounts of data that can be computationally analyzed using data science (data mining and artificial intelligence) techniques to solve real-world problems: to reveal patterns, trends, and associations, especially relating to human behavior and interactions. While machine learning algorithms have been used for analyzing data, the process of data analysis cannot be fully automated because machines cannot yet perform tasks like understanding, interpreting, and implementing solutions emerging from the data analysis, as humans can (Berkman, 2017).
Considering the field of education, for more than a decade now universities and academic institutions are investing in e-learning methodologies and technologies and offer services for adult distance education using information computer technology tools and learning management systems (LMSs). A LMS is a software application for the administration, documentation, tracking, reporting, and delivery of educational courses or training programs. LMSs help instructors to deliver material to the students, to administer tests, quizzes and other assignments, to track students’ progress, and to manage record keeping. LMSs can also support many other uses like fully online courses or hybrid forms such as blended learning and flipped classrooms.
For a data scientist, an LMS provides a significant resource of data that gathers the learning activity of all students. The analysis of these data can result in valuable information and may assist stakeholders (students, faculty, and administration) to elevate the learning process in higher education. As an outcome, instructors may improve the design of their courses, faculty may alter their educational methodology, and administration may make decisions that will improve the educational services provided. Learning analytics is defined as “the measurement, collection, analysis and reporting of data about learners and their contexts, for purposes of understanding and optimizing learning and the environments in which it occurs” (Siemens, 2013). It suitably applies data mining techniques, like classification, clustering, text mining, social network analysis, sentiment analysis and sequential mining, to educational data, in order to discover information for the interpretation of learners’ behavior during the learning process. These techniques can be implemented using several tools and software like R, WEKA, Tableau, Niosto, Envivo, and Excel, while they can also be used to extend LMSs’ facilities.
Moodle ( https://moodle.org) is one of the most popular LMSs, which can be used as a focal point for online collaboration or a repository of self-study courses and materials. Moodle contains independent and self-paced courses or synchronous and collaborative courses. It is a free LMS written in PHP programming language and it is also open source, distributed under the GNU General Public License. Students can submit their written assignments, work reports, and answered questionnaires related to their academic studies, while tutors are able to give feedback, annotate, and grade their students’ assignments or work reports. Online fora and discussions groups for students and tutors are also available.
There are several plugins in Moodle, implemented by its community, that provide learning analytics as well as learning analytics dashboards that offer a visual representation of analysis ( https://docs.moodle.org/36/en/Analytics_plugins). A few visualization tools also exist. For example, GISMO is a graphical interactive monitoring tool that provides useful visualization of students’ activities in online courses to instructors and it performs cognitive and/or behavioral student interactions (Mazza & Botturi, 2007). Also, IntelliBoard ( https://intelliboard.net) offers analytic and reporting services to education communities and SmartKlass (2017) is a dashboard which helps in analyzing student’s behavioral data. All the above tools are third party applications and the main issue is that data need to be migrated to them from Moodle in order to be processed and analyzed.
Except for the above internal tools of Moodle, one can use the already mentioned tools and software for performing data processing and analysis externally, using the data recorded in Moodle log files. For example, Liu, Froissard, Richards, and Atif (2015) have presented the Moodle Engagement Analytics Plugin in order to provide information about students’ progress against a range of indicators. By enhancing the utility and impact of Moodle Engagement Analytics Plugin, the authors improved data visualizations and the quality of teachers’ interventions. Alachiotis, Stavropoulos, and Verykios (2017) and Dierenfeld and Merceron (2012) have utilized Excel pivot tables in order to process data and visualize the results. In Gkontzis, Karachristos, Panagiotakopoulos, Stavropoulos, and Verykios (2017), the authors have proposed a framework consisting of the Mongodb NoSQL system and the R software in order to identify students’ emotions using Moodle forum log files. They have determined the subjective value of student texts and they have characterized the emotional state of messages.
The purpose of this work is to exploit the features of Excel for analyzing educational data. We extend the work of Alachiotis et al. (2017) in order to facilitate tutors and other stakeholders to analyze Moodle log files. For our research, we have utilized a data set obtained from the Moodle platform suitably designed by the Hellenic Open University (HOU) to support a modular e-learning course on visual programming. Data log files are appropriately manipulated first and next a learning analytics methodology is applied for analyzing learners’ behavior and performance. Results are visualized using 2D line and bar charts, 2D cluster column charts, and surface charts. The graphical representation of the analysis offers the opportunity for a quick and direct interpretation of learners’ activity and performance. Non-computer scientists who are familiar with a well-known tool like Excel can implement the proposed methodology also.
More specifically, initially the manipulation of the Moodle log file takes place in order to trace the students’ daily and weekly activity to identify the most active hours per day/week. This information may be useful for a tutor to arrange a teleconference with his or her students or to schedule the activities of the course in an appropriate time. We next find out the distribution of students’ accesses to the contents of the course and their participation in the quizzes, assignments, and fora; these metrics are useful factors for tracing the interest and the dedication of the learners and for redesigning the course. Furthermore, the study of the interactions between quiz submission and forum participation is performed and we come to conclusions about their affecting of quiz submission. Finally, the prediction of the final quiz grade of a learner is achieved by expressing it as a linear function of the grades of the intermediate quizzes.
As already stated, the purpose of our work is to analyze learners’ behavior and performance and reach conclusions that can elevate the quality of a distance learning course. Our purpose is to utilize Moodle log files and analyze their records in order to explore several research questions concerning the learners’ activities and active learners during the day, the submissions percentage, the course dedication, the distribution of accesses of the contents of the course, and the distribution of accesses during the week. Specifically, we aimed to identify the appropriate time slots during a day of the week for online support, discussion, and synchronous lectures for the learners. For instructional designers, we want to find out which educational resources were accessed by the learners during the course. Next, we would like to provide to tutors some recommendations about learners’ progress and dedication during the course. Finally, we would like to give a method to predict the grade of a learner in the final evaluation and his/her successful completion of the course.
The rest of this paper is organized as follows. In Section 2 related work is given. A case study is described in Section 3, along with the manner in which we manipulate data log files and the assumptions we have made. The proposed methodology for analyzing and visualizing data is presented in Section 4. Technical details concerning the implementation of the methodology are given in Section 5 and the findings and results are discussed in Section 6. Finally, in the last section, conclusions and directions for future work are given.
2. RELATED WORK
In Lykourentzou, Giannoukos, Mpardis, Nikolopoulos, and Loumos (2009) there is an effort of prediction of student achievements by using multiple feed-forward neural networks to cluster students according to their performance. These results are compared with a linear regression method. The clustering of students according to their performance along with sequential pattern mining is appropriate for consulting each person separately (Romero, Ventura, Zafra, & de Bra, 2009). In order to predict dropout, Lykourentzou, Giannoukos, Nikolopoulos, Mpardis, and Loumos (2009) have used machine learning techniques supporting vector machines, probabilistic ensemble simplified fuzzy ARTMAP, and feed-forward neural networks trained by an error back propagation algorithm. Parker (1999) has investigated the predictors of student dropout in distance education courses. Dille and Mezack (1991) have identified predictors of high-risk students who participate in telecourses, by discussing hypotheses testing and by examining demographic variables. A clustering of students has taken place in Paxinou, Sgourou, Panagiotakopoulos, and Verykios (2017) according to the probability for a student to answer a specific question correctly, by using an item characteristic curve and the Rasch model in item response theory.
Zaiane and Luo (2001) exploit web access logs using advanced data mining techniques so as to extract useful patterns. These patterns help educators in distance learning and web masters to evaluate and interpret online course activities. The authors use the evaluation and interpretation in order to assess the learning process, track student actions, and measure web course structure effectiveness. Ιn Lockyer, Heathcote, and Dawson (2013), the learning design is presented as a form of documentation of pedagogical intent that can provide the context for making sense of diverse sets of analytical data. Wise, Zhao, and Hausknecht (2013) have used some metrics in order to analyze how students contribute to and attend to the messages of others in online discussions. Students’ participation is expressed in two sets according to the time that learners are writing posts in online discussions (speaking) and the time during which learners are reading others’ posts (listening).
In Rawassizadeh, Momeni, Dobbins, Gharibshah, and Pazzani (2016), the authors aim to detect frequent behavioral patterns of users who are using devices such as smartwatches with constraints like small memories. Their findings can be utilized for better interpreting of activity timing with certain patterns. In Chovanak, Kassak, and Bielikova (2017) the k-means algorithm is used in order to cluster similar behaviors. Dragos, Halita, and Sacarea (2015) mine behavioral patterns that emerge from the log files of a web-based e-learning tool they have developed. They utilize users’ information like their login time, the access time, and IP, and apply formal concept analysis to investigate patterns of knowledge and behaviors such as “relaxed,” “normal,” or “intense.” In ElAtia, Ippercie, and Zaiane (2016), behavior classification algorithms are applied to determine whether the expected learning objectives of a course were reached.
In Gkontzis et al. (2017), the authors propose a data mining methodology for the extraction of emotional knowledge of students’ discussion fora with sentiment analysis. The authors have identified polarity and emotion, and they have classified them as “positive,” “negative,” or “neutral”. Data are analyzed with the R statistical environment. In Kagklis, Karatrantou, Tantoula, Panagiotakopoulos, and Verykios (2015), the authors have performed an analysis of the network created by the content of the messages posted in fora by the students, using social network analysis techniques. A study which explores specific learning analytics dashboards in the Moodle platform and illustrates their emergence exists in Gkontzis, Karachristos, Lazarinis, Stavropoulos, and Verykios (2017a). The creation of a detailed and holistic image of student performance, tutor effectiveness, and administration efficiency, and their visualization through learning analytics dashboards takes place in Gkontzis, Karachristos, Lazarinis, Stavropoulos, and Verykios (2017b). Moreover, in Kagklis et al. (2017) the authors have developed an analysis of demographical data regarding students’ applications for acceptance in distance learning programs offered by the HOU during 2003 to 2013.
According to Firat (2017), the use of tablets is not so popular in distance education. Despite this fact, for the learners who use a tablet, there is the Snappet adaptive educational technology (Molenaar & van Campen, 2016). Teachers can attend a dashboard with the real-time data of the learner performance and the exercises can be adaptively adjusted according to the progress of the students.
Moreover, concerning learning games, a mathematical framework is proposed in Augustin, Hockemeyer, Kickmeier-Rust, and Albert (2011) which relates the (problem solution) behavior of a learner in the game context to the learner’s available and lacking competencies. A summary of state-of the-art techniques on learning analytics and educational data mining takes place in the study of Steiner, Kickmeier-Rust, and Albert (2014) which has focused on key concepts, objectives, data, and the analytics methods which are used also for visualizations and key applications. In this work the authors use the category of serious games in order to demonstrate the application of the above concepts and methods. Also, the literature study of Sin and Muthu (2015) has offered a literature review relevant with big data, educational data mining, and learning analytics. Finally, it is worth mentioning the textbook of Sclater (2017) discussing emerging applications of learning analytics.
3. CASE STUDY
For the evaluation of the current methodology and for drawing conclusions, we have utilized the educational data obtained from the Moodle platform, which is suitably designed to support a modular e-learning course on visual programming. The course aims to acquire and improve the programming skills of teachers (so that they will improve the abilities of their students, afterwards) through visual block programming languages. Visual block programming languages are the most suitable to introduce programming to non-technical users, since they are easy due to the natural language description of blocks, the drag-and-drop interaction, and the ease of browsing to available commands (Weintrop & Wilensky, 2015). For this reason, Scratch language was the most appropriate. Scratch, developed by an MIT lab, has been used extensively in introductory programming courses (Kaucic & Asic, 2011; Meerbaum-Salant, Armoni, & Ben-Ari, 2013) and is implemented in many projects by universities aimed at secondary education teachers and students and even tertiary education students (Saez-Lopez, Roman-Gonzalez, & Vazquez-Cano, 2016; Dee, Cufi, Milani, Marian, & Poggioni, 2017).
The course, named “ScratchCoding: Code-Create-Learn,” was designed for blended learning, where the instructional process comprises face-to-face live meetings, online asynchronous video lectures, synchronous sessions, and discussion fora. It was aimed toward teachers of primary and secondary education in Greece, in order to help them to acquire a solid understanding of basic programming concepts. The educational material was formed by learning objects, suitably organized into units of related topics, which in turn form the e-learning course in Moodle, available at http://scratchcoding.eap.gr/platform. Each learning object contains specific objectives, prerequisite knowledge, teaching material in video and textual forms, and activities, quizzes, and exercises which require users to run and to complete coding blocks or to develop full applications.
ScratchCoding was designed to run in different streams, aiming to train about 150 teachers from different provinces. Each stream lasted seven weeks, so the e-learning course was structured in seven units. In each unit, specific prerequisites and learning goals were set, and educational content (textual descriptions, video lectures, presentations, and examples) were given. Next, several activities took place (try-out activities, quizzes, and exercises), which require users to run and to complete coding blocks or to develop full applications (projects in Scratch). Moreover, a discussion forum was available to support users’ cooperation and interaction with their peers and their tutors. Users can post their questions for issues that were relevant to a topic, the educational content, or an activity, and take feedback from their colleagues or even from the course instructor. The unit ended up with a final quiz (week exam) that users should answer to continue to the next unit.
The course was implemented by the e-CoMeT Lab (Educational Content, Methodology & Technology Laboratory) of HOU, under project “Design and implementation of a blended learning course on visual programming: Code-Create-Learn with Scratch” and funded by the Stavros Niarchos Foundation. HOU uses Moodle to offer undergraduate and postgraduate programs to a large population, in a blended learning approach, using distance learning methodologies. A detailed description of the methodology of the project is given in Lazarinis, Karachristos, Stavropoulos, and Verykios (2018).
The experiments in the current work were conducted on a Moodle log file reporting the users’ activity. Moodle log files are activity reports. They contain information on the students and tutors relevant to the date and time where an activity took place, the actions, and the levels. A teaching level is an event or action which is performed by the teacher and affects the students’ learning experience (e.g., grading a student or adding a module to the course). A participating level is an event or action which could be related to a user’s learning experience (e.g., posting to a forum or submitting an assignment). In a log file one can see what pages the students have accessed, the time and date they accessed them, the IP address they came from, and their actions (view, add, update, and delete). For our research, no demographic or background details (like education, occupation, age, marital status, city, etc.) for the participants were kept or used. Although this kind of data can be combined to log files and interesting conclusions can be reached, we focused on data obtained by the log files and we did not ask for the participants to provide them (these data are sensitive and privacy protection is an issue, too).
Moodle log files can be downloaded in Excel format. Such an Excel file contains the columns Time, User full name, User ID, Affected user, Affected user ID, Event context (containing information about what has been created in the course, i.e. the resources and the activities of the course), Component (e.g., quiz, assignment, forum), Event name (containing information about what has been done in the course, e.g., quiz attempt started, submitted or viewed, submission created, discussion or post created, viewed, deleted, or updated), Description (e.g., a user ID has viewed a certain discussion in a forum with a certain course module), Origin (e.g., web), and IP address.
In the current case study, a utilization of the Moodle log file is performed, on which there is a reporting of the users’ activity during the first stream of the course that took place from March to April 2017. In this stream, 239 users participated, and their activity was traced in about 229,000 records in total. For the purpose of this analysis the columns Time, User ID, Event context, Event name, and Component were exploited. To preserve anonymity, we assign randomly chosen integers as User IDs and we substitute the names of the participants with these IDs. Moreover, we make the following assumptions: We measure users’ activity considering user logins for every minute of each hour, while every participant accesses each piece of content (resource) at most once—this also holds for the submission of assignments and quizzes, and the forum participation.
4. METHODOLOGY
In this section we present our methodology in order to draw conclusions about the learners’ behavior and to exploit the possibility for learners’ performance predictions. Technical details for the application of the methodology are discussed in Section 5 while findings and results are presented in Section 6.
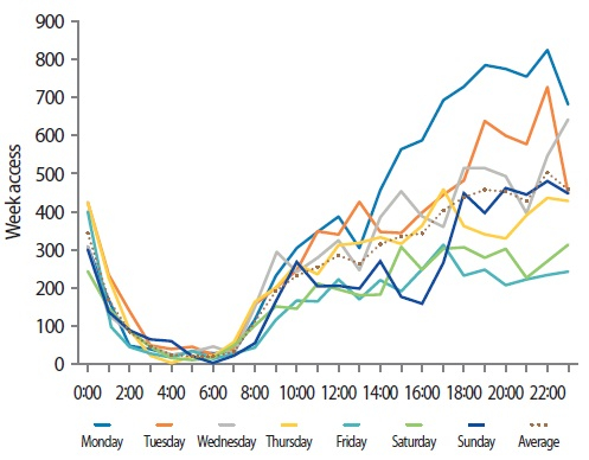
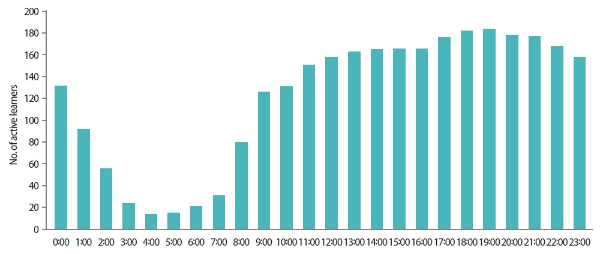
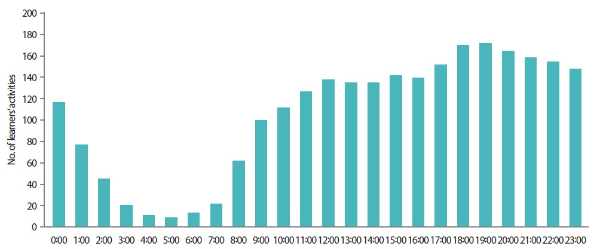
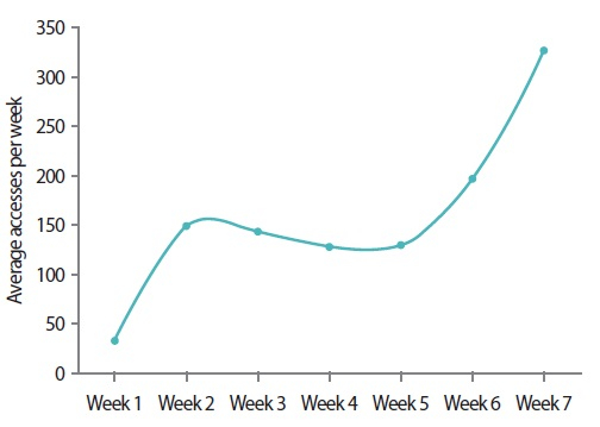
Data exploitation starts with learners’ timing behavior during the course. For this purpose, we visualize the distribution of their access during all days of the week (Fig. 1), the number of active learners during the hours of the day (Fig. 2), and the number of learners’ activities (forum participation, quiz, and assignment submission) during the hours of the day (Fig. 3). Moreover, for the learners that have succeeded in the course, we depicted the distribution of average accesses per week and the distribution of active learners per week, in Figs. 4 and 5, respectively.

Distribution of access during all days of the week.

Number of active learners during the hours of the day.

Number of learners’ activities during the hours of the day.

Average number of accesses per week, for leaners that successfully passed the final evaluation.

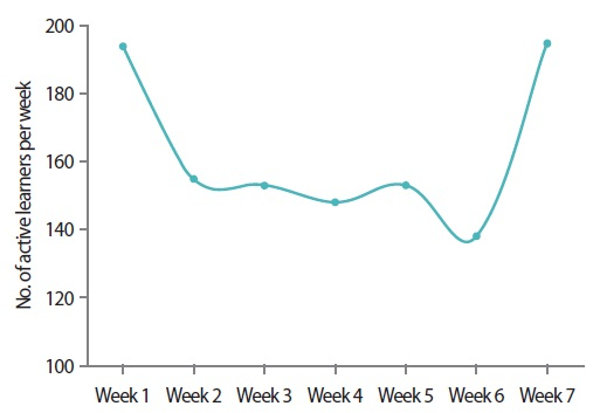
Number of active learners per week, for learners that successfully passed the final evaluation.
We next consider the educational content of the course (activities and resources) in order to recognize whether learners have accessed them or not. Access to every activity or resource during the course is visualized by the row chart given in Fig. 6. In the sequel, the learners’ progress during the course, as defined by the weekly submission of assignments and quizzes, is investigated. The percentage of submitted assignments and quizzes (with a passing grade) is depicted in the column graphs of Figs. 7 and 8, respectively.

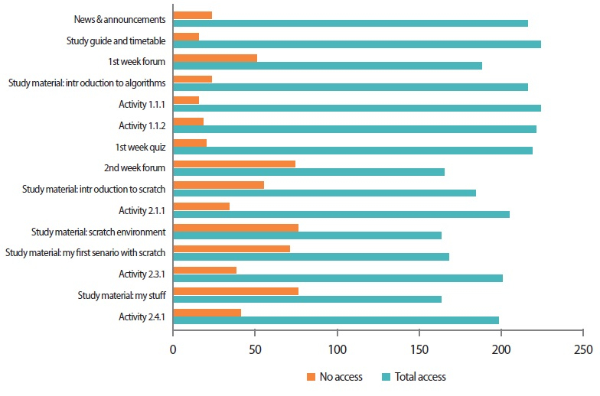
Distribution of access to the contents of the course.

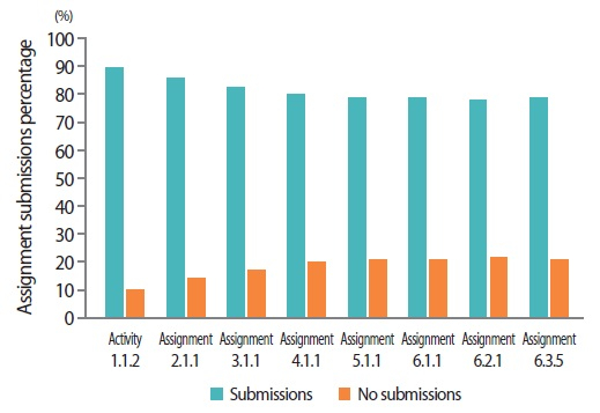
Assignment submissions percentage.

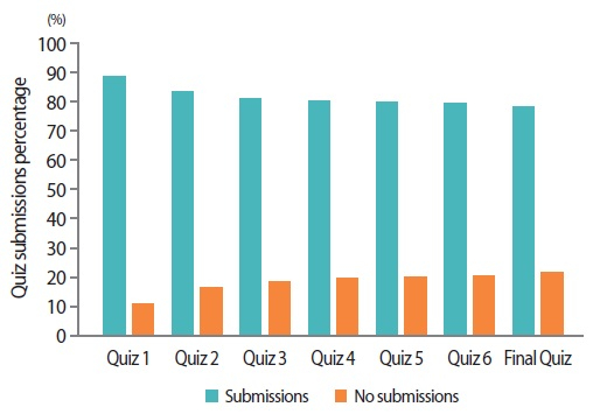
Quiz submissions percentage.
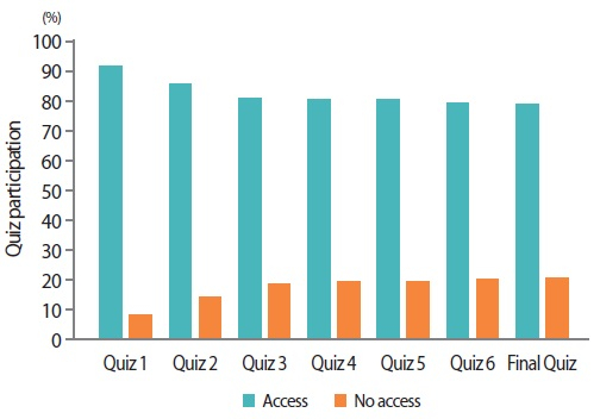
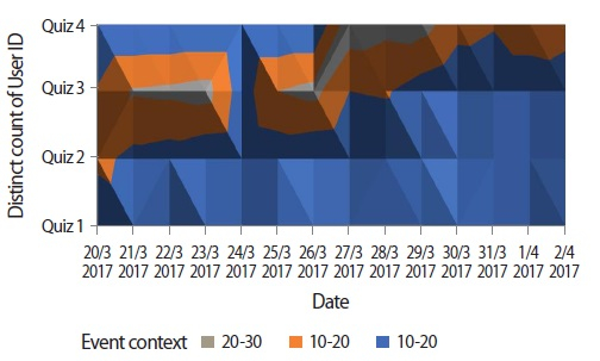
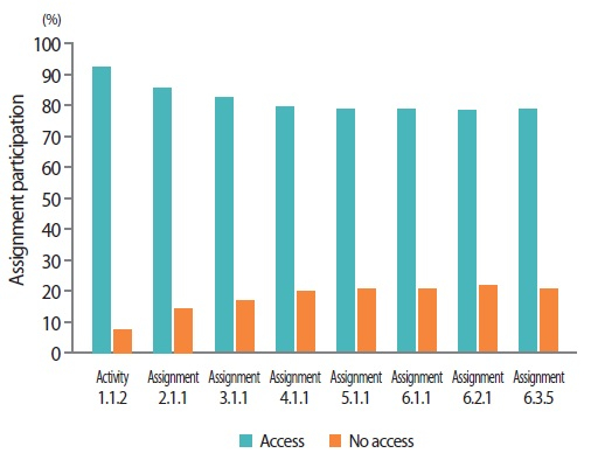
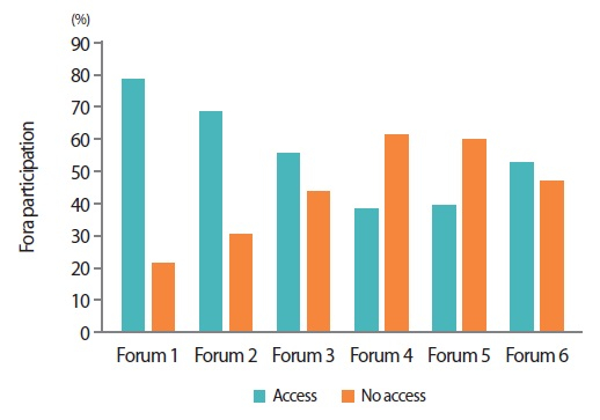
Learners’ course dedication can be measured with respect to their participation in the quizzes, assignments, and the forum contained in each week of the course. We visualize the course dedication by a column chart depicting the percentage of learners that had accessed a quiz or not (Fig. 9). The column chart can give the general picture while we can focus on a shorter time interval by utilizing the surface chart of Fig. 10, that demonstrates the density of quiz accesses during each day of the selected interval. In a similar way we have produced column graphs illustrating the learners’ participation in weekly assignments and fora (Figs. 11 and 12, respectively), in order to obtain a measurement of learners’ engagement.

Quiz participation.

Density of quiz accesses during some days of the course.

Assignment participation.

Fora participation.
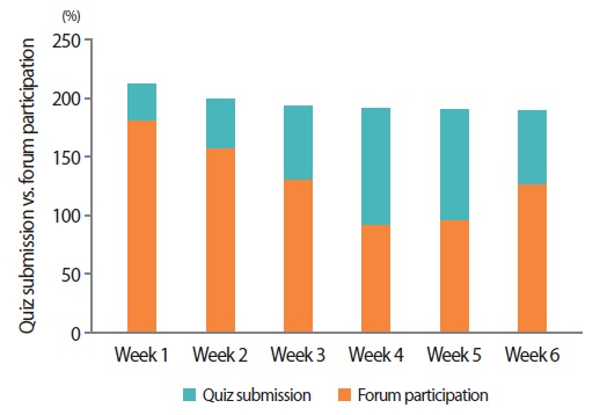
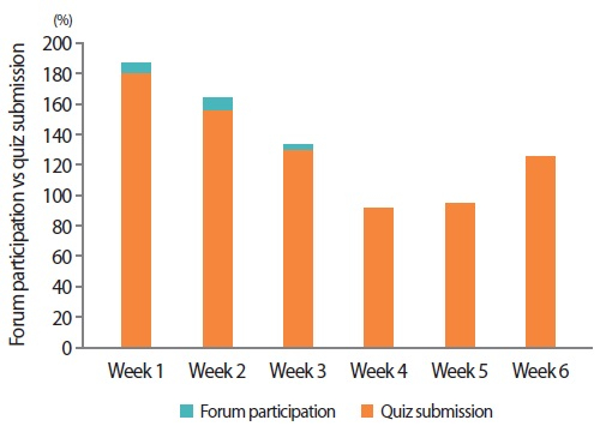
To investigate whether the active forum participation (read a topic, reply to it or post a new one) of a learner helps him/her to submit the assignments and quizzes, and, consequently, to successfully complete the course, we have produced two column charts that compare the number of learners that have participated in weekly fora, given that they have submitted the corresponding quizzes (Fig. 13), and vice versa (Fig. 14). By this way, one can recognize how close the number of students who had participated in a forum (post or read a discussion so as to take advice from it) is with the number of students who had submitted the quiz for a week of study.

Number of learners that have participated in weekly fora, given that they have submitted the corresponding quizzes.

Number of learners that have submitted weekly quizzes, given that they have participated in the corresponding forums.
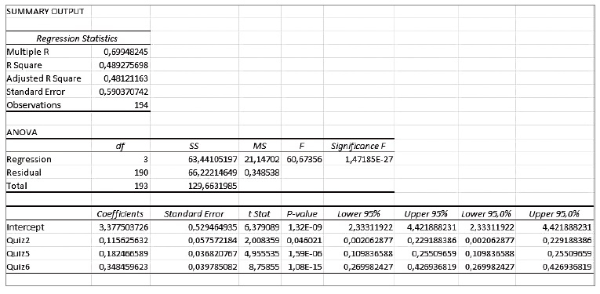
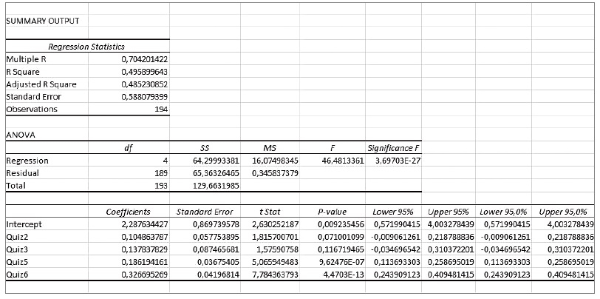
Our last issue was to predict a learner’s performance during the final quiz of the course, i.e. the final quiz grade. We initially applied a simple multiple linear regression function of the form y = b + m1x1 + m2x2 + . . . +mk xk, where x1, x2, . . ., xk are the independent variables, b is the intercept, y is the dependent variable, and m1, m2, . . ., mk are the coefficients of the independent variables which accrue from the regression implementation (Larson & Farber, 2012, p. 524; Bethea, Duran, & Boullion, 1995, p. 313). In our case, x1, x2, . . ., xk are the grades of the quizzes, y is the predicted grade of the final quiz, m1, m2, m3, . . ., mk are the coefficients of the quiz grades which come out from the implementation of the regression, and b is the intercept value. Since not all variables were statistically significant, we had to further elaborate in order to select the statistically significant ones (i.e., those that have P-value less than 0.05) for better accuracy of the prediction (the final multiple linear regression model is given in Fig. 15). For the cases where the multiple linear regression model is not sufficient, one can perform sensitivity analysis for the omitted variables by applying the methodology of Hosman, Hansen, and Holland (2010). The enhanced model is given in Fig. 16.

The final multiple linear regression model.

The multiple linear regression model after the application of sensitivity analysis.
5. TECHNICAL DETAILS
Some technical details for the implementation of the methodology steps above are discussed here. 2-D line charts were used to draw Figs. 4 and 5. For the first one, the accesses and the IDs for each week of study are counted, and next a calculation of the average accesses per week is performed. The latter figure was obtained by sorting the IDs, applying conditional formatting, filtering by color, and next, counting the IDs that cope with the activities of each week.
In order to visualize the activity of learners during the day and during the week (Fig. 1), the column “Time” in the log files is split into two columns (Date and Time). A pivot table is constructed by using the Distinct Count feature and by using the columns “time” and “User ID.” This results in the number of accesses during each minute and subsequently by summing them to the number of accesses during each hour. In a similar fashion, for the visualization of the number of active learners during the hours of the day (Fig. 2) and the number of learners’ activities during the hours of the day (Fig. 3), one pivot table for each hour was constructed.
To calculate the distribution of accesses to contents, we sum up the number of users that have accessed each piece of content. The COUNT function and Remove Duplicates are used for the calculations. In the row chart of Fig. 6, the blue row corresponds to the number of learners who have accessed the content while the orange row depicts the number of the rest of them. We have created the column charts of Figs. 7, 8, and 9, by removing duplicates, counting all discrete user IDs that have submitted a quiz or an assignment, and, next, by dividing this number by the total number of learners in order to obtain the corresponding percentage. Figs. 11 and 12 have been produced in a similar way.
For the surface chart of Fig. 10, i.e., a topological map that illustrates the density of quiz accesses during each day of a selected interval by using different colors, a pivot table is used by applying distinct count and by defining the days of the interval with the use of the appropriate date filter.
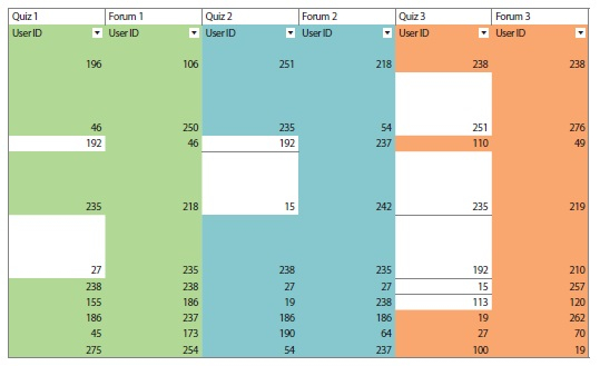
To count the appropriate number of learners and to produce the column charts of Figs. 13 and 14, we had to deal with each user and identify whether he/she has participated in a forum or not and also whether he/she has submitted a quiz or not. To do this, the learners’ IDs with forum accesses have to be compared with the learners’ IDs with quiz submissions by doing several manipulations to the data sheet, as shown in Fig. 17. To produce this, we used certain buttons and options within Excel for conditional formatting, formatting of only unique or duplicate values, and selection of a color for each week with formatting, and, next, in the “Format All” drop down list, “duplicate” is selected. In order to count the colored cells, Filter by Color is applied, for example, “green” or “no fill.” The “green” color stands for the User IDs that have submitted the quiz, or those who have accessed the forum of the first week. The “no fill” (the white color) stands for those who have not submitted the quiz or have not accessed the forum of the first week.

Forum access vs quiz submission comparison in User IDs level.
Multiple linear regression in Excel can be implemented by selecting Data > Data Analysis > Regression. The Input Y Range corresponds to the cells with the values of the dependent variable selected and the X Range corresponds to the values of the multiple independent variables. The sensitivity analysis implementation is achieved as follows. Data tables are constructed containing the values of a variable, which satisfy the P-value criterion and the values of a previously omitted variable. This procedure is repeated for all omitted variables. One can construct a data table by considering the values of two variables and the cost function (in our case the final grade). This procedure is repeated for all omitted variables. The row and the column of each data table contains a grade increased gradually.
6. RESULTS
In this section we present the findings obtained when applying the methodology presented in Section 4. Also, conclusions and implications are discussed concerning stakeholders like learners, teachers, instructional designers, and administration.
Learners’ timing behavior during every week of the course is visualized in Figs. 1 to 5. Fig. 1 depicts the learners’ activity during the week (for every hour of the day and every day of the week) while Fig. 4 relates the number of weekly accesses with the successful evaluation of the learners (the average number of accesses per week, for learners that successfully passed the final quiz). It is obvious that the learners are more active from the afternoon (14:00) until late in the evening (22:00), while the busiest days are Monday and Tuesday. The results are quite reasonable. The learners are more active during non-working hours and in the first two days of the week when a new unit starts. Moreover, one can see that learners are more engaged during the last three weeks of the course, since their average activity is maximized during this period. Fig. 2 shows the distribution of active learners during the hours of the day. One can conclude that the most active learners appear in the evening (from 17:00 to 21:00) while quite enough users exist from midday to midnight. In Fig. 3, we visualize learners’ activities during the hours of the day. It is obvious that the learners submit activities mainly from the afternoon (17:00) until late in the evening (23:00), but also, they submit many activities from the morning until the afternoon (9:00-17:00). The total time spent by the learners during the day in certain activities ranges from 4 to 8 hours as is apparent above. Finally, in Fig. 5, we give the distribution of active learners per week that finally earned a passing grade at the final evaluation. One can easily conclude that a few learners lost interest during the middle of the course, although they finally succeeded in the final evaluation.
During a week, a teacher may schedule a time slot for online support of students (answering questions or giving feedback for an assignment) or an online synchronous lecture or discussion with students. In order to maximize students’ participation, it would be better to select the day and the hour of the week where students are more active. Rescheduling of online quizzes and assignments may be necessary in order for them to comply with the timing behavior of the learners. Moreover, extra care should be taken (forum posts and discussions, teleconferences, or more online scheduled short tests) to enhance learners’ participation and engagement during every week the course lasts (not only at the start and at the end of the course).
We consider now the educational content of the course (activities and resources) in order to recognize whether learners have accessed them or not. In Fig. 6 a row graph visualizing access to every activity or resource during the course is given. The Total Accesses is the number of learners who have accessed all the material (the blue row), while by subtracting it from the total number of learners, the number of No Accesses (the orange row) is obtained.
By examining the graph, an instructional designer can recognize whether material has been accessed by the learners, so as to re-design the course in order to highlight content (resource or activity) that is important for the students to access, remove content that seems not to be necessary for the students, and so on. The participation and the engagement of the students is also depicted in the graph. One can observe that there are more accesses to the content of the first week (the first seven contents) while at the second week the learners are losing their interest (content accesses are graded down). Moreover, the teacher can derive important conclusions considering the accesses to material and the students’ performance during the midterm online tests and the final exams of the course.
To participate in the final examination and complete the course, a learner has to submit all of the intermediate quizzes and assignments (and receive a passing grade to each of them). Thus, it is important for the teacher to have a picture of the submissions during the course. In this way, the teacher will be aware to send a reminder to those learners who have not submitted a quiz or an assignment and subsequently to take special care, and to assist learners that meet difficulties in submitting a quiz or an assignment, and so on.
The proportion of submitted assignments and quizzes is given in Figs. 7 and 8, respectively. The blue column depicts the percentage of learners that have submitted the corresponding assignment or quiz, while the orange one is the percentage of those who have not. It is apparent in both graphs that from the beginning of the course there are about 10% of the learners who have no interest and who do not submit the quizzes and the assignments. This ratio gradually increases to 20% at the end of the course.
The task that follows is to measure learners’ course dedication with respect to their participation in the quizzes, assignments, and the forum contained in each week of the course. A global view can be seen in Fig. 9, where the blue column corresponds to the number of learners that have accessed the quiz and the orange one to the rest of them. As one can see, there exists a small number of learners that never dealt with the course. The participation of the learners gradually decreases from the first to the third week, while their interest remains almost stable for the rest of the weeks. Thus, this chart offers a general view of learners’ participation and engagement with the content.
The surface chart of Fig. 10 offers a more detailed view of quiz accesses in a short time interval. One can observe that during the third week of the course (from March 20 to March 26), the learners have accessed mainly the second and the third quiz, while during the fourth week (from March 27 to April 3), the learners have accessed mainly the third and the fourth quiz. A course instructor can use such a surface chart so as to have a more detailed view of dedication in a shorter time interval. Moreover, by comparing Fig. 8 to 9, the teacher can realize that despite the fact a large number of learners have accessed the first and second quiz, not all of them submitted those quizzes, too. This does not hold for the next four intermediate quizzes and the final one, where almost all learners who have accessed them have also submitted them.
Learners’ participation in assignments and fora is another way to measure their engagement with the course. In Figs. 11 and 12, the percentage of learners that have participated (or, not) in the assignments and fora of the course is drawn. One can observe that the interest of learners gradually decreases for the activities of the first three weeks, while it almost remains stable for the rest of them (assignments 3.1.1 and 6.3.5 correspond to the third and sixth week of the course, respectively). Moreover, while a large number of learners participated in the first week’s forum, this number gradually decreases until the fourth week, at the fifth week the forum participation remains almost the same and finally, there is an increment to the number of accesses in the forum in the last week of the course. A teacher can identify the learners that lost their interest in the middle of the course, focus on them, and take action to keep them up to pace.
We next investigate how close is the number of students who participated in a forum (posted or read a discussion so as to take advice from them) with the number of students who had submitted the quiz of a week of study. In Fig. 13 one can see that the number of learners who have taken the advice of each weekly forum is significant smaller than those who have submitted the corresponding quiz. Therefore, we can conclude that there exists a proportion of learners who submit each weekly quiz without having participated in the corresponding discussion forum of the course. The next step is an investigation into which of the learners who have submitted a weekly quiz had also participated in this week’s forum (Fig. 13) and in addition, which of the learners who have participated to a weekly forum have also submitted this week’s quiz (Fig. 14).
In Fig. 13, during the fourth week, for example, 192 learners have submitted this week’s quiz (the blue column) while only 92 of them—less than half of them—have participated in this week’s forum (the orange column). One can realize that almost all learners participate in the forum of the first week, read the discussions, and take advice from them so as to submit the corresponding quiz. This portion decreases gradually during the next weeks (this means that many learners have submitted the quizzes without having any participation in the fora) and the portion increases significantly during the last week. On the other hand, as can be seen in Fig. 14, almost all learners that have participated in a week’s forum have submitted the corresponding quiz in the sequel. For example, during the third week, from the 134 learners who have participated in the forum of this week (the blue column), 130 of them have submitted the corresponding quiz (the orange column). This observation may mean that active forum participation helps learners to keep their interest and encourage them to study and submit the online assignments.
The final task, according to Section 4, is the prediction of the final quiz grade (or, an intermediate quiz grade) of a learner while the course is in progress. The application of the multiple linear regression model (Fig. 15) produces the equation
where y is the predicted grade of the final quiz and x1, x2, x3 are the grades of the second, the fifth, and the sixth quiz, respectively.
When applying the methodology of Hosman et al. (2010), the more accurate model (Fig. 16) given by the equation
exists, where x1, x2, x3, x4 are the grades of the second, the third, the fifth, and the sixth quiz, respectively, and y is the predicted grade. By setting the values of the grades of the intermediate quizzes, the teacher can predict the performance of the student at the final exam.
7. CONCLUSIONS AND FUTURE WORK
In this work, we have proposed a methodology to analyze and visualize educational data by exploiting the power of Microsoft Excel. Data were obtained from the Moodle log file of an e-learning course developed by the HOU for enhancing the information computer technology skills of school teachers in primary and secondary education in Greece. The analysis resulted in interesting outcomes about learners’ behavior and activities and resource effectiveness. The relation of active forum participation and quiz submission has also been studied, while by using a multiple linear regression method and sensitivity analysis the prediction of learners’ performance in the final examination is feasible. An application of this study in a distance learning course would provide stakeholders with some recommendations and suggestions.
Specifically, the analysis has shown that learners are more active during the non-working hours and in the first two days of the week when a new unit starts. Learners’ activity decreases until the fifth week of study and then it increases until the end of the course. Several learners lose their interest in the middle of the course and the percentage of learners who do not submit quizzes and assignments increases from 10% to 20% at the end of the course. Also, some learners have accessed the quizzes and assignments without submitting them. Most of the educational content has been accessed by most of the learners. This also holds for learners’ participation in fora. Moreover, forum participation elevates the progress of the learners by helping them to maintain their interest, to study, and to submit the online assignments.
Teachers, instructional designers, and administration can take advantage of the above observations and findings in order to make decisions that will improve the course and will benefit potential learners. The course can be redesigned, and the educational material can be revised in order to maintain the interest of the learners from the start to its end. Teachers must prompt learners in order to actively participate in the fora and take advice from them, in order to submit the assignments and quizzes with success. Moreover, they must identify the learners who are losing their interest, retain their interest, and encourage them to keep their pace, so that the submission percentage and course dedication are not decreased. Activities of the last week of the course can be enhanced to better prepare learners for the final evaluation of the course. Finally, administration can consider the whole progress of the learners in order to take decisions to invest in improving the educational services it will provide in future.
This work can be extended to discover learners’ behavior models and content access patterns by implementing more sophisticated techniques in Excel and R programming language, such as clustering and classification. A manual clustering according to the grades obtained can be performed to result in different models of learners’ behavior for each cluster. Data cubes can be suitably defined in order to discover learners’ access and behavior patterns—see, for example, Kamber, Han, and Chiang (1997) and Bentayeb (2008). To this aim, evolutionary clustering algorithms (Chi, Song, Zhou, Hino, & Tseng, 2007) can be employed for clustering with temporal smoothness instead of basing on historic data. Moreover, variables dependencies can be exploited by using chi-square test and contingency tables.
References
, Alachiotis, N. S., Stavropoulos, E. C., & Verykios, V. S. (2017). Learning analytics with Excel in a blended learning course. In , Proceedings of the 9th International Conference in Open & Distance Learning, , Athens, Greece (pp. 8-18)., , Learning analytics with Excel in a blended learning course., In Proceedings of the 9th International Conference in Open & Distance Learning, (2017), Athens, Greece, 8, 18
, Bentayeb, F. (2008). K-Means based approach for OLAP dimension updates. In , Proceedings of the 10th International Conference on Enterprise Information Systems, , Barcelona, Spain (pp. 531-534)., , K-Means based approach for OLAP dimension updates., In Proceedings of the 10th International Conference on Enterprise Information Systems, (2008), Barcelona, Spain, 531, 534
Automated machine learning won’t replace data scientists. () ((2017), Retrieved February 18, 2019) Berkman, J. (2017). Automated machine learning won’t replace data scientists. Retrieved February 18, 2019 from https://www.datascience.com/blog/automated-machine-learningwont-replace-data-scientists. , from https://www.datascience.com/blog/automated-machine-learningwont-replace-data-scientists
, Chi, Y., Song, X., Zhou, D., Hino, K. & Tseng. B. L. (2007). Evolutionary spectral clustering by incorporating temporal smoothness. In , Proceedings of the 13th ACM SIGKDD International Conference on Knowledge Discovery and Data Mining, , San Jose, CA, USA (pp. 153-162)., , Evolutionary spectral clustering by incorporating temporal smoothness, In Proceedings of the 13th ACM SIGKDD International Conference on Knowledge Discovery and Data Mining, (2007), San Jose, CA, USA, 153, 162
, Chovanak, T., Kassak, O., & Bielikova, M. (2017). Behavioral patterns mining for online time personalization. In , Proceedings of the 25th Conference on User Modeling, Adaptation and Personalization, , Bratislava, Slovakia (pp. 361-362)., , Behavioral patterns mining for online time personalization., In Proceedings of the 25th Conference on User Modeling, Adaptation and Personalization, (2017), Bratislava, Slovakia, 361, 362
, Dee, H., Cufi, X., Milani, A., Marian, M., & Poggioni V. (2017). Playfully coding: Embedding computer science outreach in schools. In , Proceedings of the 2017 ACM Conference on Innovation and Technology in Computer Science Education, , Bologna, Italy (pp. 176-181)., , Playfully coding: Embedding computer science outreach in schools., In Proceedings of the 2017 ACM Conference on Innovation and Technology in Computer Science Education, (2017), Bologna, Italy, 176, 181
, Dierenfeld, H., & Merceron, A. (2012). Learning analytics with Excel pivot tables. In , Proceedings of the 1st Moodle Research Conference, , Heraklion, Greece (pp. 115-121)., , Learning analytics with Excel pivot tables., In Proceedings of the 1st Moodle Research Conference, (2012), Heraklion, Greece, 115, 121
, Dragos, S., Halita, D., & Sacarea, C. (2015). Behavioral pattern mining in web based educational systems. In , 2015 23rd International Conference on Software, Telecommunications and Computer Networks, , Split, Croatia (pp. 215-219)., , Behavioral pattern mining in web based educational systems., In 2015 23rd International Conference on Software, Telecommunications and Computer Networks, (2015), Split, Croatia, 215, 219
, Gkontzis, A. F., Karachristos, C. V., Lazarinis, F., Stavropoulos, E. C., & Verykios, V. S. (2017a). Assessing student performance by learning analytics dashboards. In , Proceedings of the 9th International Conference in Open & Distance Learning, , Athens, Greece (pp. 101-115)., , Assessing student performance by learning analytics dashboards., In Proceedings of the 9th International Conference in Open & Distance Learning, (2017a), Athens, Greece, 101, 115
, Gkontzis, A. F., Karachristos, C. V., Lazarinis, F., Stavropoulos, E. C., & Verykios, V. S. (2017b). A holistic view on academic wide data through learning analytics dashboards. In , Proceedings of the Online, Open and Flexible Higher Education Conference on Opportunities and Impact of New Modes of Teaching, , Milton Keynes, UK (pp. 12-27)., , A holistic view on academic wide data through learning analytics dashboards., In Proceedings of the Online, Open and Flexible Higher Education Conference on Opportunities and Impact of New Modes of Teaching, (2017b), Milton Keynes, UK, 12, 27
, Gkontzis, A. F., Karachristos, C. V., Panagiotakopoulos, C. T., Stavropoulos, E. C., & Verykios, V. S. (2017). Sentiment analysis to track emotion and polarity in student fora. In , Proceedings of the 21st Pan-Hellenic Conference on Informatic, , Larissa, Greece (Article No. 39)., , Sentiment analysis to track emotion and polarity in student fora., In Proceedings of the 21st Pan-Hellenic Conference on Informatic, (2017), Larissa, Greece, (Article No. 39)
, Kamber, M., Han, J., & Chiang, J. Y. (1997). Metarule-guided mining of multi-dimensional association rules using data cubes. In , Proceedings of the Third International Conference on Knowledge Discovery and Data Mining, , Newport Beach, CA, USA (pp. 207-210)., , Metarule-guided mining of multi-dimensional association rules using data cubes., In Proceedings of the Third International Conference on Knowledge Discovery and Data Mining, (1997), Newport Beach, CA, USA, 207, 210
, Kaucic, B., & Asic, T. (2011). Improving introductory programming with Scratch? In , Proceedings of the 34th International Convention, IEEE MIPRO, 2011, , Opatija, Croatia (pp. 1095-1100)., , Improving introductory programming with Scratch?, In Proceedings of the 34th International Convention, IEEE MIPRO, 2011, (2011), Opatija, Croatia, 1095, 1100
, Liu, D. Y. Τ., Froissard, J.-C., Richards, D., & Atif, A. (2015). An enhanced learning analytics plugin for Moodle: Student engagement and personalized intervention. In , Proceedings of the 32nd Conference of the Australasian Society for Computers in Learning in Tertiary Education, , Perth, Australia (pp. 180-189)., , An enhanced learning analytics plugin for Moodle: Student engagement and personalized intervention., In Proceedings of the 32nd Conference of the Australasian Society for Computers in Learning in Tertiary Education, (2015), Perth, Australia, 180, 189
, Molenaar, I., & van Campen, C. K. (2016). Learning analytics in practice: The effects of adaptive educational technology Snappet on students’ arithmetic skills. In , Proceedings of the Sixth International Conference on Learning Analytics & Knowledge, , Edinburgh, UK (pp. 538-539)., , Learning analytics in practice: The effects of adaptive educational technology Snappet on students’ arithmetic skills., In Proceedings of the Sixth International Conference on Learning Analytics & Knowledge, (2016), Edinburgh, UK, 538, 539
General plugins (Local): SmartKlass Learning Analytics Moodle. (SmartKlass) ((2017), Retrieved January 7, 2019) SmartKlass. (2017). General plugins (Local): SmartKlass Learning Analytics Moodle. Retrieved January 7, 2019 from https://moodle.org/plugins/local_smart_klass. , from https://moodle.org/plugins/local_smart_klass
, Steiner, C. M., Kickmeier-Rust, M. D., & Albert, D. (2014). Learning analytics and educational data mining: An overview of recent techniques. In , Learning Analytics for and in Serious Games: Proceedings of Joint Workshop of the GALA Network of Excellence and the LEA’s BOX Project at EC-TEL 2014, , Graz, Austria (pp. 6-15)., , Learning analytics and educational data mining: An overview of recent techniques., In Learning Analytics for and in Serious Games: Proceedings of Joint Workshop of the GALA Network of Excellence and the LEA’s BOX Project at EC-TEL 2014, (2014), Graz, Austria, 6, 15
, Weintrop, D., & Wilensky, U. (2015). To block or not to block, that is the question: Students’ perceptions of blocks-based programming. In , Proceedings of the 14th International Conference on Interaction Design and Children, , Medford, MA, USA (pp. 199-208)., , To block or not to block, that is the question: Students’ perceptions of blocks-based programming., In Proceedings of the 14th International Conference on Interaction Design and Children, (2015), Medford, MA, USA, 199, 208
, Wise, A. F., Zhao, Y., & Hausknecht, S. N. (2013). Learning analytics for online discussions: A pedagogical model for intervention with embedded and extracted analytics. In , Proceedings of the Third International Conference on Learning Analytics and Knowledge, , Leuven, Belgium (pp. 48-56)., , Learning analytics for online discussions: A pedagogical model for intervention with embedded and extracted analytics., In Proceedings of the Third International Conference on Learning Analytics and Knowledge, (2013), Leuven, Belgium, 48, 56
, Zaiane, O. R., & Luo, J. (2001). Towards evaluating learners’ behavior in a web-based distance learning environment. In , Proceedings of the IEEE International Conference on Advanced Learning Technologies, , Madison, WI, USA (pp. 357-360)., , Towards evaluating learners’ behavior in a web-based distance learning environment., In Proceedings of the IEEE International Conference on Advanced Learning Technologies, (2001), Madison, WI, USA, 357, 360