1. INTRODUCTION
Today, we can observe libraries’ migration into digital space following potential users. The rapid growth of network information resources around the world, including library resources (websites, social network accounts, blogs, etc.), necessitated their organization and evaluation. On this ground, there arises webometrics and the need for webometric research. To date, webometrics has received several definitions. First, the use of the term “webometrics” in relation to quantitative indicators has been defined—“web statistics.” Another webometrics definition refers to it as “a field of research using the methods of bibliometrics of network information resources, structures, and technologies” (Björneborn & Ingwersen, 2001).
Libraries today have to compete with the alternative of instant access to information on the web. That is why libraries are now doing a great job of creating, analysing, and managing web resources (Udartseva, 2018). Libraries are aware of the webometric study potential to provide useful information about user behaviours on their web resources and have several aspects for use: service quality improvement, self-presentation of library products and services in virtual space, and use of empirical data for the implementation of various solutions at the level of web resource management (Lowe, 2012; Paul & Erdelez, 2009). Conducting webometric research, libraries, one way or another, need to tackle a number of pressing issues, the answers to which are a key factor in ensuring library competitiveness in the information services market, being, in particular, the basis for their effective activities in the online space:
-
• What tools to choose when analysing library web resources?
-
• What metrics to consider key ones for library web resources?
-
• What is the trend of web resource traffic?
-
• Where do users come from (traffic sources)?
-
• How much time do users spend on the library website on average?
-
• When do library web resources get the most users?
-
• How many pages do users view before leaving the website?
-
• What website pages are the most popular?
-
• What pages of the library website are considered as target pages?
-
• What is the target audience of library web resources?
-
• Who links to library web resources?
Especially today, libraries need theoretical justification of existing issues and their practical resolution. Due to constant transformation of the web space, libraries look for new models and mechanisms of website management. Webometric research will help to better understand the user audience and evaluate library performance in web space. The world libraries of different levels and types are engaged in the development of the issues raised.
The aim of this research was to:
-
• study the preferences of scientific libraries in Siberia and the Far East in choosing web-based analytical tools,
-
• identify key metrics for evaluating library website effectiveness,
-
• identify the most productive traffic sources for the analysed libraries, and present related findings on audience segmentation depending on the traffic nature, and
-
• compare the results in order to build a rating of scientific libraries in Siberia and the Far East.
In addition, some metrics correlation was found; this feature was taken into account in this study, which allowed us to give an optimal interpretation of current indicators.
2. LITERATURE REVIEW
2.1. Key Traffic Metrics
Using web analytics as a globally recognized tool, commercial and non-profit organizations seek to improve their current performance indicators (Jacoby & Luqi, 2007; Mihajlova, 2017; Redkina, 2017; Sen, Dacin, & Pattichis, 2006; Srinivasan, Amir, Deshpande, & Zbarsky, 2004). Thus, to be competitive in web space, libraries need not only to find the necessary set of web-based analytical tools, but to set up their own optimal development strategy as well. The strategy is based on key metrics from web analytics tools that allow measurement of the achievement of libraries’ strategic goals. For each library, the main question arises: What key metrics will become important in the information market in the near future? This issue concerns large academic libraries (Kann, 2017; Udartseva & Rykhtorova, 2018), regional libraries (Chepushtanova, 2016), university libraries (Chakravarty & Wasan, 2015; Mihajlova, 2017; Tian, 2012), and other libraries that use web-based analytical tools to effectively evaluate activities in web space. In the existing studies, the authors propose different criteria to classify key indicators (Chepushtanova, 2016; Kann, 2017; Udartseva & Rykhtorova, 2018). The key traffic metrics for library web resources, based on the goals and objectives, are considered as follows (Udartseva & Rykhtorova, 2018): visits, visitors, new visitors, traffic sources, average visit time (time on website), visit depth (average indicator), and bounce rate. In many foreign studies related to evaluation of library websites, the emphasis is also placed on these traffic indicators (Fagan, 2014; Jansen, 2009; Vecchione, Brown, Allen, & Baschnagel, 2016).
2.2. Potential of Key Performance Indicators to Measure Library Website Performance
In 2013, the American Library Association’s topic “Developing a Web Analytics Strategy for Your Library” was covered by a seminar, which discussed issues of setting goals and choosing suitable key performance indicators (KPIs). Most KPIs in web analytics tools are focused on commercial websites; therefore, libraries need to set separate indicators to assess how users receive information that meets their needs and objectives. This conclusion was made by a group of American scientists of the Boise State University Albertsons Library (USA) (Vecchione et al., 2016). The authors propose to use the bounce rate as a key metric. Web analytics tools typically measure this indicator automatically, but “for libraries, it is a complex metric that needs to be understood in context because library websites also serve as information portals to other websites” (Vecchione et al., 2016, p. 3). The library web team created a control panel in Google Analytics, which included specially selected domains with the changed tracking code. Event tracking is a method of measuring any activity that occurs on a website. The authors describe in detail the technical process of creating a series of labels consistent with each event. Depending on the bounce rate, the web team identified the most popular products and services on the library website. The data obtained have formed the basis for revising the popular content placement on the website main page, which significantly reduced the user path in finding the necessary information, and as a result reduced the bounce rate from 92.8% to 67%. Thus, by promoting popular content and providing users with what they need, the bounce rate can be significantly reduced, and instead the time users spend on the website can be increased (Vecchione et al., 2016).
Association for Research Libraries (ARL) and National Information Standards Organization (NISO) distinguish only one “virtual visit” webometrics (Fagan, 2014). In 2009, Jansen (2009) grouped webometric indicators into four categories, depending on the affiliation to a particular website: commerce, content/media, support/self-service, and lead generation. Fagan (2014) believes that libraries today combine the first three indicator categories, and in detail specifies the value of each indicator to evaluate the library web resources performance. Among the web metrics in the “commerce” category suitable for library web resources, Fagan (2014) highlights the following:
-
• average order value (comparing the order value for specific subscription resources will allow estimation of its demand),
-
• average visit cost (total number of visits will allow estimating efficiency/inefficiency of website pages: efficiency/inefficiency of the advertising campaign, the need to redesign pages, and changing of authentication mechanisms),
-
• bounce rate (calculating the percentage of visitors who leave after viewing one page will determine the landing page performance for different traffic sources),
-
• conversion rate (calculating the percentage of visitors who have completed certain actions will assess the success of the current advertising campaign), and
-
• loyalty (assessment of overall success, determined by the visit frequency of new and existing users).
In the “content” category for library websites, Fagan (2014) has highlighted the following:
-
• visit depth (page views/visits will allow evaluation of interaction with the web resource),
-
• repeat visitors (unique visitors/total visits number will allow assessing the quality of the content of interest to target users),
-
• new users (new/unique visitors will allow evaluating the website or website pages performance), and
-
• popular pages (page views/unique visitors show the popularity of the page and may indicate a correspondence between the website goals and visitor interests).
Web metrics for library websites in the “self-service” category include:
-
• visit depth (low numbers of page views/visits indicate that users quickly find the information they need),
-
• popular pages (high numbers of page views/unique visitors indicate an area where many people have problems [support issues, not from the website]),
-
• bounce rate (low percentages of visitors who leave after viewing one page, usually indicating information performance, with some exceptions),
-
• average time per page (comparison of total time spent on a page/visits with past time periods or similar page types),
-
• user satisfaction (comparison with previously obtained indicators to check information usability), and
-
• keywords/phrases for internal search (identifying the most common issues, both with support issues and navigation) (Fagan, 2014).
In the metrics choice for libraries, Fagan proposes to be guided by two questions in relation to each metric: “What can be done to improve them if necessary?” and “Who can take action?” If these questions cannot be answered, the metric usefulness is questionable (Fagan, 2014, p. 31). By choosing indicators that can actually be useful to make a success of a common strategy, libraries can quickly and efficiently manage their own web resources in the virtual space.
Most of the metrics offered by different library teams and individual scientists as key metrics relate to website traffic analysis in one or another way. This pattern leads to the conclusion that traffic metrics are the basis for library website analysis, so they deserve special attention from the analyst.
2.3. Evaluation of the Library Website Performance
Using Tools for Competitive Intelligence The literature review also showed that competitive intelligence by webometric indicators (tools selection for competitors assessing; collection, processing, and analysis of statistical indicators; comparison/ranking of web resources against each other) remains an insufficiently studied area in the Russian library segment. Most researches aim at studying web resources of libraries where they work (Chepushtanova, 2016; Kann, 2017; Udartseva & Rykhtorova, 2018) due to the closed access to the statistics of other library web resources. However, there is a large number of web-based analytical tools that allow conducting competitive intelligence (SimilarWeb, Alexa, Pr-Cy.ru, etc.).
Their choice depends on the goals and objectives set for the analyst: comprehensive web resource evaluation, optimization assessment, content and popularity evaluation, etc. Authors use different methods and tools in their research (Dastani, Atarodi, & Panahi, 2018; Jowkar & Didegah, 2010; Kann, 2017; Udartseva & Rykhtorova, 2018). Udartseva and Rykhtorova (2018) studied the available analytical functionality and methods of collecting statistics by such tools and identified possible goals of website analysis, noting negative and positive aspects of assessing by such tools. Comparison of SimilarWeb and Alexa tools in the study by Prantl and Prantl (2018) showed that the use of these tools would approximate the significance of a particular website. Thus the study results have shown that the tools of this group have sufficient potential for competitive intelligence (Prantl & Prantl, 2018; Udartseva & Rykhtorova, 2018). Assessment of the Iranian Newspapers websites using Alexa data concluded that the websites require development, and their work is estimated as insufficiently effective in the web environment (Jowkar & Didegah, 2010). Kann (2017) stresses that, using SimilarWeb, it is possible to identify regular attendance of libraries, assessing the entire range of links connecting the library website with its partners and similar pages. It should be noted that for detailed analysis of website use, it is better to apply more complex web-analytical tools with advanced functionality, for example, Yandex.Metrica, Google Analytics, LiveInternet, and AWStats. The technology for collecting data from such tools is slightly different: counters (data about visits is collected using JavaScript code installed on the website pages); log analysers (data on all server accesses are recorded in log files). However, it will be possible to conduct competitive intelligence with the help of these groups of tools only if the statistics are open for general use, or private access to temporary data is provided.
2.4. Other Library Website Assessment Methods: Webometrics Rating
Dastani et al. (2018) have evaluated the websites of 23 electronic libraries of Iranian medical universities on the basis of evaluation criteria. S is the size (number of pages on the website recorded by Google search engine); R (Rich files) is the value (number of full text files on the website); Sc (Scholar) is academic quality (number of publications and citations recorded by Google Scholar); and V is visibility (number of unique external links to the website recorded by MOZ search engine). The main study conclusion was the proof that the rise in indicators for the selected evaluation criteria increases the website success in the web environment. This method of web resources evaluation is also used to evaluate the websites of libraries and other scientific organizations (Guskov, Kosyakov, & Bykhovtsev, 2016). This analysis method is aimed primarily at quantitative measurement of the website content, and user audience and the website traffic remain virtually unexplored. An alternative approach that complements the existing methodology, in our opinion, is the study of web traffic and attendance resources, so this study will focus on the evaluation of web traffic sources and the analysis of traffic metrics.
3. METHODOLOGY
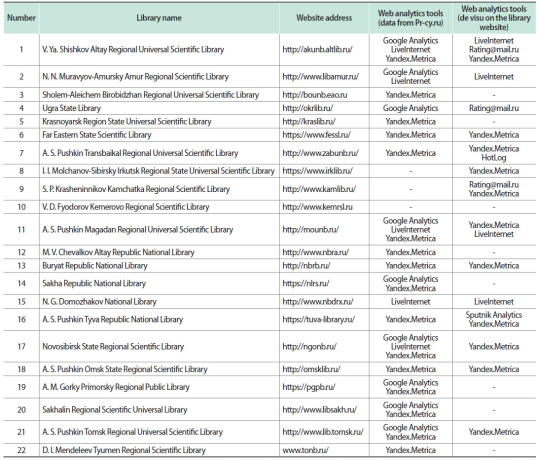
In this study the author used a quantitative approach. This study was conducted based on a sample of websites of the largest scientific libraries in Siberia and the Far East. The obligatory condition for selection was that the library had the status of a coordinating centre for the libraries of the region, territory, and republic in Siberia and the Far East and that it was working in web space through its official website. Based on these criteria, there were selected 22 library websites of the largest scientific libraries of Siberia and the Far East, which are research institutions in the fields of library science, bibliography and book history, and are organizational-methodical and coordinating centres of libraries of the region, territory, and republic. The relevance of the library website URL address was checked manually during direct visits to the website. At the time of the study, all website URL addresses of the Siberian and Far Eastern scientific libraries, presented in Table 1, were relevant. In order to assess the popularity of web-based analytical tools, which are preferred by the Siberian and Far Eastern scientific libraries, the Pr-cy.ru analytical tool was used, as well as the analysis of websites by general browsing (de visu) for the purpose of additional evaluation. Pr-cy.ru is a free website analysis service that offers a variety of indicators and is an affordable online tool. In this study, we used it due to availability. When analysing the website, Pr-cy.ru determines the unique identifier of the counter being used by the counter code, which is located on the website pages. Monitoring was conducted in June 2018.

Web analytics tools for scientific libraries in Siberia and the Far East (June 2018)
Using web analytics tools makes it possible to analyse the library segment in the web space and identify the main competitors in this area. One of such tools is SimilarWeb, a web service of the Israeli group of developers, which collects, analyses, and provides data on user digital behaviors, allowing creation of a prototype of user behavior and assessment of the audience involvement and loyalty on the website and mobile application. The basis of the web service functioning is the big data processing technologies characteristic of such web analytics tools. SimilarWeb is widely used for competitive intelligence and is especially important in a situation where the web-analytical data describing library websites is not accessible. The accuracy of the data obtained, according to the web service users in Russia, is 90-95% (Mamon, 2017). With the use of SimilarWeb service, data on the attendance of scientific libraries in Siberia and the Far East for a six-month period have been collected. The period (six months) was not chosen by chance. First, SimilarWeb service provides data only for the last six months, and second, this period is optimal, allowing predicting data for the other half of the year, which generally gives a good result. Monitoring was conducted 3-27 July 2018 by key traffic metrics (visits, average visit time, average visit depth, bounce rate, and traffic sources) since they are potentially important for explaining the effective development of libraries on the web. Noting the importance and crucial significance of traffic metrics to assess the efficiency/inefficiency of the library website, we will take them as a basis for our research.
Data from reports of Pr-cy.ru and SimilarWeb services have been entered into an Excel spreadsheet, sorted and constructed to define the regularities of using web analytical tools and current development of scientific libraries of Siberia and the Far East. Webometric indicators without analysis present formal statistics; of particular value is the interpretation of data collected using analytical systems. Interpretation of webometric indicators was based primarily on:
-
1. definition of terms:
-
• “visits” means the user interaction with the website for a certain period of time;
-
• “average visit time” means the user visit duration;
-
• “average visit depth” means the number of pages viewed during a visit;
-
• “bounce rate” means the percentage of visitors who left the website directly from the login page or viewed not more than one website page; and
-
• “traffic sources” means other web resources from which the user navigated to the website;
-
2. quantitative data obtained; and
-
3. assessment of the existing experience of Russian and foreign colleagues.
For ease of analysis, the data collected were compiled into separate tables, and the indicators summarized based on the assessment were reformatted into visual elements to make them easier for researchers to understand.
4. RESULTS
Twenty-two websites of the Siberian and Far Eastern scientific libraries have been monitored for the use of web-based analytical tools and their openness. As a rule, statistics from the web-analytical tools of most libraries are closed to “outsiders”; in particular, 15 of the 22 viewed library websites have closed counters. At the time of the study, the following libraries had open access to the statistics of some web analytics tools: N. N. Muravyov-Amursky Amur Regional Scientific Library (LiveInternet), A. S. Pushkin Magadan Regional Universal Scientific Library (LiveInternet), Novosibirsk State Regional Scientific Library (Yandex.Metrica), N. G. Domozhakov National Library (LiveInternet), S. P. Krasheninnikov Kamchatka Regional Scientific Library (Rating@mail.ru), A. S. Pushkin Zabaikalsky Regional Universal Scientific Library (HotLog), and V. Ya. Shishkov Altay Regional Universal Scientific Library (Rating@mail.ru). This confirms the statement that most libraries close their analytical tool data.
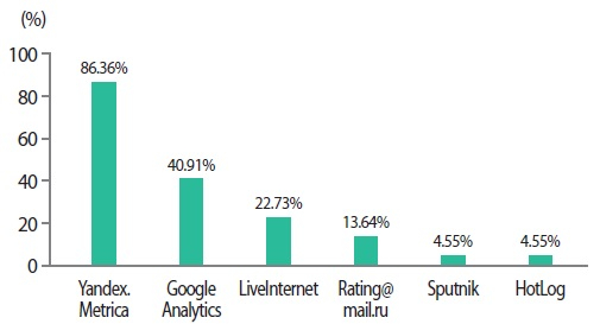
According to Pr-cy.ru, the most commonly used web analytics tools of libraries are Google Analytics, Yandex.Metrica, and LiveInternet. Yandex.Metrica holds the leading position; this analytics system is used by 16 libraries, Google Analytics takes the second place (9 libraries) and, finally, LiveInternet takes the third position; this counter is installed on the websites of five Siberian and Far Eastern scientific libraries (Fig. 1). The data obtained by general browsing on the library website are slightly different, since Pr-cy.ru has not identified such web-analytical tools as Rating@mail.ru, Sputnik, and HotLog. All of these are free Russian-language analytical systems that allow collecting data on website traffic by installing the counter code on the website pages.

Popular web analytics tools for scientific libraries in Siberia and the Far East (Russia).
As a result, we can conclude that the Pr-cy.ru marketing tool defines only classical acknowledged web analytical systems (Table 1). Another interesting fact is that using general browsing, no information was found on any websites about the collection of statistical data using Google Analytics.
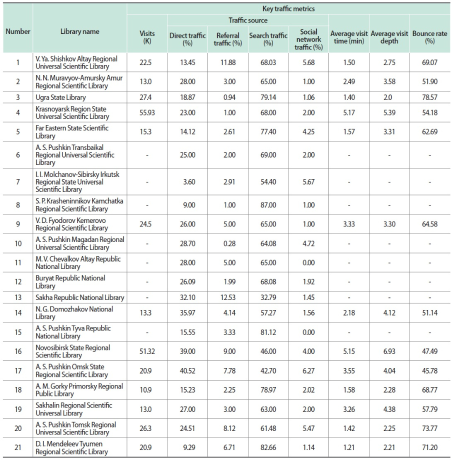
An important indicator of the success and popularity of the library website in virtual space is the increase in its traffic (attendance). To obtain a correct attendance assessment of a library web resource, it is necessary to constantly monitor a number of the selected key traffic metrics. Webometric attendance characteristics of the Siberian and Far Eastern scientific libraries according to SimilarWeb are presented in Table 2, with the exception of data from the website of Sholem Aleichem Birobidzhan Regional Universal Scientific Library (data not available in SimilarWeb), and data from eight libraries which are only partially presented.
Attendance of scientific libraries in Siberia and the Far East according to SimilarWeb (1 January-31 June 2018)
The high visit rate is shown by the website of the State Universal Scientific Library of the Krasnoyarsk Territory: 55.93 thousand per month. The average time of website visit is 5.17 minutes. It is also the best indicator among the websites of the Siberian and Far Eastern scientific libraries. Only the website of the Novosibirsk State Regional Scientific Library is slightly behind: The average visit time is 5.15 minutes, and the average visit depth has the highest rate among the libraries analysed at 6.93 pages. The average visit depth for the websites of the Siberian and Far Eastern scientific libraries is 3.58 pages; based on the informational component of library websites, this is a pretty good indicator. The lowest bounce rate (45.78%) is for the website of A. S. Pushkin Omsk State Regional Scientific Library, and the highest (78.57%)—is the website of the Ugra State Library.
Traffic sources are the channels through which users come to library web resources. A steady flow of users through these channels is the key to the success of any library web resource. Direct traffic is received by entering the website through a targeted search, typing in the search box the address of a particular website or going from previously saved bookmarks. The websites of A. S. Pushkin Omsk State Regional Scientific Library (40.52%), Novosibirsk State Regional Scientific Library (39.00%), and N. G. Domozhakov National Library (35.97%) have the highest rates of this type of traffic, which is an indicator of the positive image of their permanent audience. Referral traffic (Referrals) is the traffic of visitors who have followed links from third-party portals. The highest rate of this traffic is for the website of the National Library of the Republic of Sakha: 12.53%. The average rate of referral traffic for the Siberian and Far Eastern scientific libraries is 4.5%. High rates of transitions from search engines (Search), so-called organic traffic, are the result of well-conducted promotion of a web resource in search services. The websites of S. P. Krasheninnikov Kamchatka Regional Scientific Library (87.00%), D. I. Mendeleev Tyumen Regional Scientific Library (82.66%), and A. S. Pushkin National Library of the Republic of Tyva (81.12%) stand out for the highest rates of this kind of traffic, which is an indicator of the websites’ quality. Traffic from social networks is quite relevant today because users spend a lot of time there, and the task of libraries is to use it correctly. The highest rates of traffic received from social networks are from the websites of A. S. Pushkin Omsk State Regional Scientific Library (6.27%), V. Ya. Shishkov Altay Regional Universal Scientific Library (5.68%), and I. I. Molchanov-Sibirsky Irkutsk Regional State Universal Scientific Library (5.67%). The websites of A. S. Pushkin Omsk State Regional Scientific Library and V. Ya. Shishkov Altay Regional Universal Scientific Library receive the most traffic from VKontakte social network, along with the website of I. I. Molchanov-Sibirsky Irkutsk Regional State Universal Scientific Library—from Facebook. The average traffic rate from social networks for the Siberia and Far Eastern scientific libraries is only 2.9%, which is the result of the lack of effective library work on social networks. It is obvious that in terms of promoting their own resources and services, some libraries do not work with social networks and do not even have accounts, which affects the overall traffic. Knowledge of traffic sources will allow libraries to conduct marketing activities in virtual space most effectively.
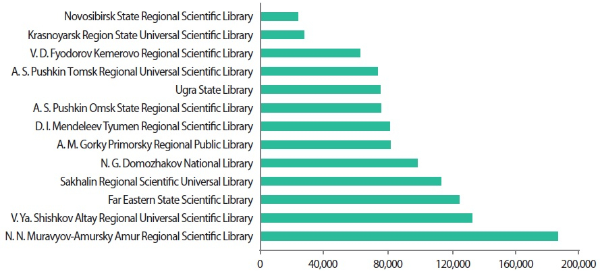
The analysis of traffic metrics allowed ranking the library websites in Siberia and the Far East by attendance, comparing the key attendance indicators and highlighting the most effective websites (Fig. 2).

Ranking of scientific libraries in Siberia and the Far East (Russia) according to SimilarWeb (1 January-31 June 2018).
As on several library websites, some of the traffic metrics were absent in SimilarWeb, and only 13 websites of the Siberian and Far Eastern scientific libraries are presented for ranking, the traffic metrics of which are presented in full. A checklist of libraries is provided in Appendix. Each website selected for the study was carefully evaluated based on the checklist and data table. A high position in the rating of the websites’ attendance of the Siberian and Far Eastern libraries is an indicator of competitive advantage among the analysed libraries’ websites.
5. DISCUSSION
5.1. Web Analytics Tools
The analysis data showed that among the scientific libraries of Siberia and the Far East, the most popular web-analytical systems for assessing the performance of their own activities are Yandex.Metrica (86.36%) and Google Analytics (40.91%).
The leading position of Yandex.Metrica analytical system is explained primarily by the fact that the system has a Russianlanguage interface since its inception. But today, other tools are also being Russified, so in the future, libraries may change their preference and give it to other analytical tools of similar functionality and ease of use. In a pilot study of the websites of scientific research organizations by a group of Russian authors (Guskov, Bykhovtsev, & Kosyakov, 2015), a similar pattern was found in the use of Google Analytics (41%) and Yandex.Metrica (77%) analytical systems. Turner (2010) finds the advantage of these analytics systems in the use of JavaScript code on web pages that allows collecting technical and demographic information. The choice in favour of analytics tools such as Yandex.Metrica and Google Analytics may indicate library interest in assessing the attendance of their websites, given the fact that these tools have great analytical functionality.
5.2. Visits
In our opinion, the first place among the key metrics to evaluate library performance on the web belongs to the visit metric. This metric is interesting to libraries as an indicator that shows the overall usability of the library website by users. As a rule, a high rate of visits has a positive interpretation, indicating the library website popularity (Fagan, 2014). Fagan (2014) clarifies the value of this indicator to assess library web resources performance in the “content” category. However, if this indicator is considered for the purpose of assessing the user “self-service,” then, according to Fagan (2014), it should be concluded that high rates of visits may indicate a poor or insufficiently clear navigation of the web resource (Fagan, 2014). The second version of the indicator interpretation (visits), in our opinion, requires additional qualitative assessment with the help of analytical systems with advanced functionality (visits to individual pages of the website, click map, goals setting, webvisor), which will allow specifying of the data and getting an objective assessment. In addition, the “self-service” evaluation is more focused on the analysis of specific website pages, allowing drawing conclusions about how clear the website is for the users. For the purposes of competitive intelligence, the total number of website visits is estimated. In this case, high values of the webometric indicator—visits—have a positive value, indicating the performance of the specific website in relation to other websites’ libraries. In our study, the website of the State Universal Scientific Library of the Krasnoyarsk Territory demonstrates high attendance, which allows us to talk about its high popularity among users.
5.3. Average Visit Time
Another important key indicator is the average visit time. We accept that library websites are full of information, and therefore time is required for a thoughtful acquaintance (Rykhtorova & Udartseva, 2018). Based on this, high metric values indicate a general interest of users in the provided library content. The above average data are demonstrated only by three websites of scientific libraries in Siberia and the Far East: Krasnoyarsk Region State Universal Scientific Library, Novosibirsk State Regional Scientific Library, and A. S. Pushkin Omsk State Regional Scientific Library. The average visit time for the websites of scientific libraries in Siberia and the Far East is 2 minutes 51 seconds. If we evaluate this indicator from the point of “self-service” (Fagan, 2014), this is a good result. About three minutes is enough for a modern user not only to quickly solve the task, but also additionally analyse the related information. However, some pages of library websites require deeper studying, so it is important to conduct additional qualitative analysis using the functionality of authoritative analytical systems (Yandex.Metrica, Google Analytics). Thus the optimal session time for overall website assessment is about three minutes, while the optimal time for a particular page of the website will be calculated based on the tasks that the user can solve while staying on this page (number of links, number of words, presentation of visual information, availability of a fillin form, etc.).
5.4. Average Visit Depth
High indicators of “visit depth” metrics can indicate both poor optimization of the website landing pages and user interest in the proposed content. Such interpretation ambiguity did not allow us to immediately draw the appropriate conclusions, but a deep analysis of the data obtained in comparison with each other revealed some regularity: High indicators of the “average visit time” metric are correlated with high indicators of the “visit depth” metric. Moreover, to obtain an objective assessment of this metric, one more metric should be taken into account: bounce rate. If the library website, along with high rates of visit depth, has a bounce rate that varies in the range of 35-65%, then this indicator can be interpreted as a positive result, indicating the user interest in the content. In turn, if the situation is the opposite, where both the visit depth indicator and the bounce rate are high, the result should be considered negative. It signals existing problems on the website (the website is not optimized for technical devices applied by users, links on the website pages are outdated, incomprehensible design, long page loading, etc.). Thus the high indicators of the “visit depth” metric of the websites of the Novosibirsk State Regional Scientific Library, State Universal Scientific Library of the Krasnoyarsk Territory, and the Sakhalin Regional Scientific Universal Library in relation to the bounce rates show the audience’s general interest in the content provided.
5.5. Bounce Rate
A complex metric for library websites is the bounce rate (Fagan, 2014; Vecchione et al., 2016). Studies have shown that high bounce rates cannot be interpreted as a positive result (Vecchione et al., 2016). Most scientists are inclined to believe that the lower the bounce rate, the more effective the website is (Fagan, 2014; Guskov et al., 2015; Vecchione et al., 2016). Therefore, libraries should strive to reduce the overall bounce rate on the website. The average bounce rate for the analysed libraries in Siberia and the Far East is 61.3%. Reducing the overall bounce rate for a particular library website can be interpreted as its effective development, improving the current website processes, showing that users do not have problems interacting with the website and that they successfully find the necessary information. Additional monitoring of the bounce rate on website landing pages will help identify current problems (inactive links, non-unique content, slow page loading, inconvenient navigation, pop-ups, etc.), which will increase attendance and reduce the total number of the library website bounces.
5.6. Traffic Source
The study of web traffic of scientific organization websites showed that direct visits to the pages with scientific content are an indicator of the constant audience of the organization website (Guskov et al., 2015). In the course of this study, we noted that the websites of scientific libraries in Siberia and the Far East with high direct traffic rates had higher average visit times than did libraries with lower values. Thus high rates of this traffic can indicate both the web resource visit by the library staff and the well-deserved authority of the library among its regular readers.
Given that new visitors come mainly from search engines (Guskov et al., 2015), a preliminary conclusion can be made that a large audience share for the websites of Siberia and the Far Eastern scientific libraries is new users.
The analysis results show that the most effective traffic sources for libraries are: “direct traffic” (average indicator—23%); and “search traffic” (average indicator—65.53%), which allows making preliminary conclusions about the audience of websites of the Siberian and Far Eastern scientific libraries, distributing it into two segments: regular (23%) and new (65.53%) users.
In the process of research, the key metrics of library website traffic have been identified that will allow evaluation of the library performance on the web, and a possible approach was proposed for interpreting the generalized indicators of key metrics for six months obtained to conduct competitive intelligence using marketing tools.
Attendance estimation by key webometric indicators can be a full-fledged way to assess the performance of library websites, along with the already traditional method of evaluation upon criteria: Size, Rich files, Scholar, and Visibility (Dastani et al., 2018; Guskov et al., 2015). High rates of both methods indicate effective website development in the web environment and raises the ranking position.
6. RECOMMENDATIONS
Library website performance depends largely on the improvement of its webometric indicators, which reproduce the current situation of each website individually. From the discussion above, it is clear that libraries need to review the current strategy of their own websites’ development. For this reason, we provide the following recommendations to help libraries achieve greater efficiency. This study showed that the presented attendance key metrics most fully recreate the picture of the current development of library websites. Based on the data obtained, it is recommended to libraries with low visit rates (A. M. Gorky Primorsky Regional Public Library, N. N. Muravyov-Amursky Amur Regional Scientific Library, Sakhalin Regional Scientific Universal Library, N. G. Domozhakov National Library) to increase website productivity by reconstructing the whole website or its individual pages. In addition, a clear way to attract more users is placing interesting content and links to other popular resources on the pages of the library website, which in turn will contribute to the increase of another no less important indicator—average time spent on the website. Another recommendation is that the content should be up-to-date and constantly updated, which will increase the response rate of users to the published content. While high depth with low bounce rate indicates audience interest in the library website, low depth with high bounce rate indicates problems. As recommendations to libraries whose websites demonstrate such indicators (Ugra State Library, A. S. Pushkin Tomsk Regional Universal Scientific Library, D. I. Mendeleev Tyumen Regional Scientific Library), it is offered to carry out optimization to eliminate the arising problems when users interact with them. Library websites with high bounce rates (Table 2) should pay attention to the website navigation system to facilitate the search for necessary information.
The increase in quantitative indicators of traffic contributes not only to the growth of the visitors’ numbers, but also to the increase of awareness in general, along with conversion of traffic into targeted actions on the website: subscription to a newsletter, seeking advice, ordering literature from electronic catalogues, application for any services, etc. Libraries are recommended to work not only with the most efficient traffic sources (“direct traffic” and “search traffic”) to increase their efficiency and promote their own web resources, but also pay attention to the insufficiently productive traffic sources (“social traffic”) to conduct a detailed analysis and improve current performance. Based on the study results, we can give several recommendations for further research. In order to study library website convenience, we recommend usability testing. In combination with the results of the work made, it will allow taking into account the website user preferences. Another way is to make a detailed analysis of the website using the advanced functionality of analytical systems (Google Analytics, Yandex. Metrica) that will expand the results of this study regarding the attendance key metrics.
7. CONCLUSION
The experience of Russian libraries in the field of webometrics should be expanded by studying and transforming the existing foreign practice. The literature review showed that the current state of Russian libraries significantly differs from their foreign competitors. Libraries are just beginning to gain experience in this area, are engaged in the selection of web analytical tools, realize the need to use key metrics, and are building the necessary technology to assess the performance of their own web resources, while facing various analytical difficulties.
The study results show that the Siberian and Far Eastern scientific libraries use the analytical systems Yandex.Metrica, Google Analytics, and LiveInternet to collect statistics, which also confirms the hypothesis that scientific organizations are interested in assessing their own resources.
Metrics tracking with web analytics tools is a great way to manage library websites. For successful functioning of a web resource, it is important to conduct a webometric study: to analyse webometric indicators, conduct competitive intelligence, determine one’s own target audience, study the factors affecting the implementation of targeted actions on the website, and so on. Literature review (Chepushtanova, 2016; Fagan, 2014; Guskov et al., 2015; Jansen, 2009; Kann, 2017; Udartseva & Rykhtorova, 2018; Vecchione et al., 2016) showed that key traffic metrics are the foundation for evaluation of library websites’ performance. By choosing attendance indicators for monitoring, libraries will be able to usefully conduct webometric studies of their own websites.
Using data from web-based marketing tools to collect and analyse data, such as SimilarWeb, Alexa, Pr-Cy.ru, and others, will allow libraries to provide an analytical overview of competitors in the web environment. Use of SimilarWeb service can be recommended as an alternative source for collecting key traffic metrics: visits, traffic source (direct traffic, referral traffic, search traffic, and social traffic), average visit duration, pages per visit, and bounce rate. Based on the received data, the most effective websites of the Siberian and Far Eastern scientific libraries have been revealed. The important webometric attendance indicators are considered separately, and the interpretation based on the study objectives is given. Analysis of webometric indicators allowed assessing the current state of scientific libraries in Siberia and the Far East. The three leaders are the websites of the Novosibirsk State Regional Scientific Library, State Universal Scientific Library of the Krasnoyarsk Territory, and V. D. Fyodorov Kemerovo Regional Scientific Library. Any library is able to improve its own position by collecting and analysing key indicators of their website traffic.
Analysis has shown that two types of traffic are the most effective for libraries: direct and search. The same conclusion was reached by scientists (Guskov et al., 2015) who studied the websites of universities of the Siberian Branch of the Russian Academy of Sciences (10 websites), which may reflect a certain regularity for the websites of scientific organizations. Further research will confirm or refute the hypotheses previously put forward in this study.
Analysis of traffic metrics showed how effective/inefficient the activity of scientific libraries in Siberia and the Far East is. Based on the traffic indicators, the rating of libraries in Siberia and the Far East was built, thus clearly presenting the current status of website attendance (traffic). This study results indicate the libraries’ potential to improve their web resources. The study will give impetus to libraries with insufficient attendance to take the necessary measures to improve current performance and change their own development strategy.
As a result, we note that the generalized statistics of website traffic using SimilarWeb service does not give specifics on the existing problems of the website. Nevertheless, it is interesting, allowing us to assess the current development of the websites of the Siberian and Far Eastern scientific libraries. Projecting the positive experience of a competitive library towards oneself is one of the important reasons to conduct such research.
Appendices
APPENDIX. A checklist of libraries
1. N. N. Muravyov-Amursky Amur Regional Scientific Library
2. Far Eastern State Scientific Library
3. V. D. Fyodorov Kemerovo Regional Scientific Library
4. Krasnoyarsk Region State Universal Scientific Library
5. N. G. Domozhakov National Library
6. Novosibirsk State Regional Scientific Library
7. A. S. Pushkin Omsk State Regional Scientific Library
8. A. M. Gorky Primorsky Regional Public Library
9. Sakhalin Regional Scientific Universal Library
10. V. Ya. Shishkov Altay Regional Universal Scientific Library
11. A. S. Pushkin Tomsk Regional Universal Scientific Library
12. D. I. Mendeleev Tyumen Regional Scientific Library
13. Ugra State Library
References
, Chepushtanova, T. A. (2016, April 19-29). Web analyst in assessing the performance of the electronic library (on the example of the electronic library of the Novosibirsk State Regional Scientific Library). In B. A. Dejch (Ed.), , Social and cultural practices in modern Russian society: Materials of the scientific forum of teachers, students and graduate students, (pp. 92-95). Novosibirsk State Regional Scientific Library., , Web analyst in assessing the performance of the electronic library (on the example of the electronic library of the Novosibirsk State Regional Scientific Library). In B. A. Dejch (Ed.), Social and cultural practices in modern Russian society: Materials of the scientific forum of teachers, students and graduate students, 2016, April 19-29, Novosibirsk State Regional Scientific Library, 92, 95
, Guskov, A. E., Kosyakov, D. V., & Bykhovtsev, E. S. (2016, June 6-12). On the place of academic libraries in the web-space of science. , The Second World Professional Forum “The Book. Culture. Education. Innovations” (“Crimea-2016”), (pp. 422-429). NPLS&T Russia., , On the place of academic libraries in the web-space of science., The Second World Professional Forum “The Book. Culture. Education. Innovations” (“Crimea-2016”), 2016, June 6-12, NPLS&T Russia, 422, 429
((2017)) Evaluation of the library site using webanalytics tools. Libraries of National Academies of Sciences: Functioning Problems, Development Trends: Scientific-Practical and Theoretical Collection, 14, 130-139 http://nbuv.gov.ua/UJRN/bnan_2017_14_16.
Analyze the quality of the semantics of competitors through SimilarWeb. Collection of rules and practices, methods of collecting semantics. () ((2017), Retrieved November 15, 2018) Mamon, A. (2017). Analyze the quality of the semantics of competitors through SimilarWeb. Collection of rules and practices, methods of collecting semantics. Retrieved November 15, 2018 from http://semyadro.pro/sbor/analiziruem-kachestvo-semantiki-konkurentov-cherezsimilarweb-4. , from http://semyadro.pro/sbor/analiziruem-kachestvo-semantiki-konkurentov-cherezsimilarweb-4
Web analytics in library practice: Exploration of issues. (, ) ((2009), Retrieved November 15, 2018) Paul, A., & Erdelez, S. (2009). Web analytics in library practice: Exploration of issues. Retrieved November 15, 2018 from https://onlinelibrary.wiley.com/doi/pdf/10.1002/meet.2009.14504603105. , from https://onlinelibrary.wiley.com/doi/pdf/10.1002/meet.2009.14504603105
Grammar-based task analysis of web logs. In D. Grossman (Ed.), Proceedings of the thirteenth ACM international conference on information and knowledge management (, , , ) ((2004)) ACM Press Srinivasan, S., Amir, A., Deshpande, P., & Zbarsky, V. (2004). Grammar-based task analysis of web logs. In D. Grossman (Ed.), Proceedings of the thirteenth ACM international conference on information and knowledge management (pp. 244-245). ACM Press. , pp. 244-245