1. INTRODUCTION
1.1. The Need for the Study
Research performance indicators play an important role in academia. They are supposed to convey the academic standing of researchers to the academic world in large, and they also play a role in the allocation of resources in science policy decisions (Jonkers & Zacharewicz, 2016). Despite their importance, many existing measures of research performance are marred, to varying degrees, with methodological flaws. The main goal of this paper is to derive a new measure for research assessment: the research excellence-index, denoted by RE-index. The measure addresses many of the flaws of three popular research assessment measures: “publication counts,” “citation counts,” and the h-index (Hirsch, 2005), and a less popular measure, the g-index (Egghe, 2006). To explain the protocol for deriving the RE-index, we first outline the major flaws of the foregoing four research assessment measures.
1.2. Earlier Research Assessment Measures
Early attempts to assess research could be traced to Fisher (1959), who suggested the use of number of publications by US companies as a measure for basic research in industry. The measure could also be applied to individual researchers. Measuring research performance by publication counts fails to quantify the quality of research, does not take into account co-authorship and completely ignores research impact. The measure also does not make any distinction between two research papers in the same field; one is 3 pages long and the other is 30 pages long. It is highly likely that the longer paper required much more effort to make than the shorter one. The use of publication counts, with its discount of co-authorship, as a research performance indicator links it to the publish or perish culture (Abelson, 1990), which includes the make up of an enormous amount of joint papers that may induce the fictitious belief of doing great work in research. In reality, Fanelli and Larivière (2016) concluded from statistical studies that, when publications are adjusted for co-authorship, the publication rate of scientists in all disciplines during the twentieth century has not increased overall. What is worse are the tangible practices associated with the publish or perish culture, which fall into the category of academic misconduct; such practices include:
-
Unethical practices in authorship of research papers, like the inclusion of “fictitious” authors. A fictitious author could be either a guest author (Biagioli et al., 2019), a senior faculty member exploiting his/her graduate students or junior faculty members (Strange, 2008), or a buyer of a paper through the black market (Stone, 2016).
-
The proliferation of predatory journals, which offer a quick way for increasing publication counts.
-
The emergence of fraudulent claims of authorship in dubious commercial web sites, such as ResearchGate; see https://academia.stackexchange.com/questions/47481/what-should-i-do-if-someone-is-claiming-my-research-on-researchgate
-
Conducting flawed research (Steen, 2011) and creating an “avalanche” of sub-standard papers with poor methods or false discovery rates (Smaldino & McElreath, 2016).
-
The formation of “acceptance circles,” in which groups of authors implicitly or explicitly agree to favourably review each other’s papers (and, may be, harshly review outsiders), so that publication is facilitated by being a member of this circle (Biagioli et al., 2019). This practice together with the massive submission of articles to journals induce misconduct in processing manuscripts submitted for publication and in the peer review process (Colussi, 2018; Shibayama & Baba, 2015). In turn, some mediocre papers may appear in good journals, while good papers are rejected in these journals. The latter situation may contribute to the publication of some quality papers in predatory journals.
-
Plagiarism (Honig & Bedi, 2012; Maddox, 1995; Roig, 2010), self-plagiarism (Moskovitz, 2016; Roig, 2010) and covert duplicate publication (Tramèr et al., 1997; von Elm et al., 2004).
Westbrook (1960) advocated the use of citation counts of publications by universities or companies to identify significant research. The indicator could also be used to measure the performance of a researcher. Citation counts have one clear advantage: Citing the work of a researcher, in a supportive way, generally means the impact of the cited work. Garfield (1973) went further to associate high citation counts with distinction in research. However, there are several disadvantages with citation counts; they include “indirect-collective citing” (Száva-Kováts, 2004), “excessive self-citations” (Seeber et al., 2019), “confirmatory bias” (Nickerson, 1998), and bias of theoretical papers for citing similar papers even though the cited theoretical papers depend on data papers (MacRoberts & MacRoberts, 2010). Another misuse of citation counts occurs when departmental faculty members cite each other to improve the reputation of themselves and their academic institute (Biagioli et al., 2019). For more information on problems of citation counts, see MacRoberts and MacRoberts (1986, 2018). There are four additional problems with citation counts that are of particular interest. Firstly, as journals and similar publications differ in stature, so should be the citations appearing in them. But citation counts do not provide a metric to measure the value of a citation. Secondly, the citation counts measure does not take into account co-authorship. Thirdly, citation counts do not take into account citation patterns for different types of publications or fields, which could be very different. Fourthly, citation counts do not make a distinction between critical and supportive citations. A citation is called negative if the citing source finds confirmed errors, false statements, or deceiving statements in the cited source. Any other citation is called nonnegative. So, a subjective statement in the citing source that is in disagreement with the cited source is considered a nonnegative citation. Despite their shortcomings, citation counts should remain a tool in research assessment, but it is important to address their disadvantages.
A conceivable way of deriving a better research performance indicator could be by devising a mechanism to aggregate publication and citation counts into a single number. This is the idea of the h-index. A more mathematical formulation of the original definition of the index is as follows: Assume that a scientist X has m papers x1, …, xm that are ordered in a non-increasing order in terms of citations. For each i ∈ {1, …, m}, denote the number of citations of paper xi by ci. So, c1 ≥ … ≥ cm. Furthermore, assume that c1 > 0. Define the positive integer n by n = max{i ∈ {1, …, m} : ci > 0}. Scientist X has the h-index k if k = max{i ∈ {1, …, n} : ci ≥ i}. Due to the simple evaluation of the h-index, it has become popular throughout academia. Despite its popularity, the h-index has several serious shortcomings. First, as the h-index uses the aspects of publication and citation counts in its evaluating mechanism, it inherits, to some degree, their shortcomings, which were described in the preceding two paragraphs. Second, the value of the h-index for a scientist could depend on the dataset used to count the number of publications and citations the scientist has. Third, the h-index may not take into account the overall academic work or its impact (Abramo et al., 2013; Zhang, 2009). Fourth, despite Hirsch’s claim (2005) that two researchers with equal h indices could be regarded as comparable in terms of their overall scientific impact, even if their total numbers of papers or citations are very different, examples could be provided to refute this claim; see, for example, Bornmann et al. (2010). The interest in the h-index and its improvement has induced several variants (Alonso et al., 2009). A notable improvement of the h-index, which we will also consider in the paper, is the g-index (Egghe, 2006). With the same terminology used to define the h-index, a scientist X has the g-index l if l = max{i ∈ {1, …, n} : ∑ij=1cj≥i2}. It is known that the h-index of a scientist cannot be higher than his/her g-index. The main advantage of the g-index over the h-index is that papers with highest citations could contribute more to the evaluation of the g-index than the h-index. The g-index is usually a more credible research performance indicator than the h-index for researchers who produce serious research work with substance and impact. However, the g-index is less popular than the h-index, probably because it requires more effort to evaluate.
Throughout this paper, we use the phrase academic publication to mean an intellectual publication that is written on either one main academic field or at least two main academic fields. The latter type is called interdisciplinary. An academic publication could be either a book, a book chapter or a paper. If x is an academic publication, we will always denote the number of authors of x by n(x). A researcher is someone who has at least one academic publication. It is clear that the definition of a researcher may depend on the choice of the database source for academic literature. A perfectionist is a researcher who primarily works on major research problems and produces, throughout his/her academic career, relatively few publications with considerable impact on his/her field(s) of study. (It should be noted that the h-index could be devastating to a perfectionist, due to his/her relatively low number of publications.) By an academic periodical publication, we mean either a scholarly journal, a book series, a conference proceeding, or a trade journal (also known as trade magazine). Sometimes, the expression “scholarly journal” is abbreviated as journal, while keeping trade journal as is. Journals are of two types; single-field and multidisciplinary. A single-field journal is one which publishes articles in only one main academic field, while a multidisciplinary journal is one which publishes either articles in different fields or interdisciplinary articles (or both). Note that a conference proceeding may appear as part of a book series, a special edition of a scholarly journal or a book of essays. Papers in trade journals focus on topics of interest to professionals in a specific industry.
1.3. Features of the RE-index
Based on the foregoing main flaws of the four research performance indicators: publication counts, citation counts, and the h and g indices, the protocol in deriving the RE-index is introduced through the following eight features:
Feature 1. The RE-index would choose a dataset, which takes advantage of the wide coverage of Scopus and the Library of Congress, and deals at the same time with the Scopus database depth problem.
Feature 2. The RE-index would distinguish between different types of academic publications according to their contributions to research advancement, and would provide a metric, called the prestige-type score, quantifying this distinction between academic publications.
Feature 3. The RE-index would use the SCImago Journal Rank (SJR) scores to introduce a metric, called the (most relevant) quartile score, which measures the research quality of academic periodical publications. The quartile score of an academic periodical publication J at a year t is derived from the most relevant SJR score of J to the year t (see Definition 3).
Feature 4. The RE-index would take into account the length of academic publications, and would quantify this aspect through a metric, called the length score.
Feature 5. If x is a paper in an academic periodical publication J, which has a quartile score, the RE-index would assign a value score to x, which is derived from the prestige-type score of x, the quartile score of J and the length score of x. For any academic publication y without an associated quartile score, the RE-index would provide a value score for y, which stems from the prestige-type and length scores of y.
Feature 6. For every cited academic publication x, the RE-index would present a citation value score of x, which is derived from the value score of x and the value score(s) of the citing document(s) of x. Negative citations are discarded in the citation counts of x.
Feature 7. The RE-index would consider co-authorship. In any joint academic publication x, the RE-index would assume equal contributions from all authors of x. If x is cited, citation credit will be equally distributed among the authors of x.
Feature 8. The RE-index would take into account the overall research record of the researcher and all the nonnegative citations his/her work receives.
Remark 1. (1) None of the measures: h-index, g-index, publication counts, or citation counts, takes into consideration any of Features 1-7, and the latter two measures each consider only one of the two aspects in Feature 8.
(2) The rationale for discarding negative citations in Feature 6 is twofold. A paper retracted as a consequence of receiving one or more negative citations would be eliminated from the researcher’s record and so are all citations of the retracted paper. Also, it is illogical to reward a document with a negative citation it received.
(3) Egghe (2008) tackled the issue of co-authorship by introducing two fractional indices for each of the h and g indices. However, these fractional indices do not addresses any of Features 1-6.
2. MATERIALS & METHODS
2.1. Feature 1 of the RE-index. Choice of Dataset
Scopus, Web of Science (WOS) and Google Scholar (GS) may not agree on the recognizable academic periodical publications and publishers, and may have different starting years for collecting some data. None of the three datasets provided by the three organizations is free of drawbacks. GS is the most problematic one; it could be tricked by fictitious articles (López-Cózar et al., 2014). Scopus and WOS provide good datasets (see https://instr.iastate.libguides.com/c.php?g=901522&p=6492159). The SJR uses the Scopus data, while the Journal Impact Factor (JIF) uses the WOS data. Scopus and its associated SJR have some advantages over the WOS and the associated JIF; such advantages are listed as follows:
-
Scopus covers more peer-reviewed journals and has more interdisciplinary field coverage than WOS has (see https://instr.iastate.libguides.com/c.php?g=901522&p=6492159).
-
Scopus has a more detailed author profile system.
-
To the author’s best knowledge, there have not been problems with the data supplied by Scopus to calculate the SJR scores. In contrast, the data supplied by Clarivate (previously known as Thompson Scientific), the organisation that operates WOS, yielded different values for metrics from those published by the company, and Clarivate was unable to supply data to support its published impact factor for journals (Rossner et al., 2007).
-
The SJR is viewed as a more accurate measure in ranking academic periodical publications than the JIF. The SJR takes into account in its iterative process the journal prestige (not all citations are considered equal), and excludes a journal’s self-citations through each step of the iterative process. Popular journals cited frequently by journals of low prestige have high JIF scores and lower SJR scores, while journals that are prestigious may be cited less, but by more prestigious journals, giving them high SJR scores and lower JIF scores (Butler, 2008). It should be noted that the Eigenfactor score for ranking journals by the WOS has a somehow similar methodology to the SJR score.
-
The SJR is an open-access resource, while the JIF requires paid subscription (Falagas et al., 2008). The SJR scores are also available for the last 20 or 21 years.
Scopus has one main drawback; some currently Scopus indexed journals were not indexed prior to the year 1996. These journals include the prestigious math journal Annals of Mathematics. Consequently, Andrew Wiles’ 1995 paper in the journal, which proved Fermat’s Last Theorem, does not appear in his Scopus profile (see https://www.scopus.com/authid/detail.uri?authorId=24281995700). In contrast, the WOS has a database going back to the year 1945 (Burnham, 2006). Scopus is dealing with the depth problem; it indicates that it added 7.5 million pre-1996 article abstracts to its database, and that some of its records go back to the year 1788 (see https://www.elsevier.com/solutions/scopus/how-scopus-works/content). Scopus has another minor problem; a few journals have discontinuity in their coverage by Scopus.
Academic books will be considered in the evaluation of the RE-index. Scopus mainly indexes academic periodical publications, and the WOS database of books is not as extensive as the one in the Library of Congress. The dataset we use in this paper (see Definition 1) includes all the data in the Library of Congress and Scopus, and would deal at the same time with the depth problem in the Scopus dataset. Throughout the paper, the ranking year means the year at which the ranking formulas and research assessment indicators are calculated. If the ranking year is the current year, we use the phrase “the current ranking year”.
Definition 1. Let t be the ranking year. The dataset at the year t that we use in the paper, denoted by D(t), is made up of the data in the following three items:
(i) All the data in either the Library of Congress or Scopus that are gathered up to the year t.
(ii) Any academic publication in a publishing venue J at a year t0, t0 < t, if J is indexed in the Web of Science Core Collection and J is (was) indexed in Scopus at a year t1 satisfying t0 < t1 ≤ t.
(iii) Any citation if both the citing and cited sources are in D(t) by virtue of items (i) or (ii).
(iv) All available SJR scores for all possible years.
When there is no need to emphasize the year t at which the dataset is considered, we write D instead of D(t). From now on, we assume that all academic publications and citations we consider in this paper are in the dataset D.
Remark 2. (1) An example illustrating item (iii) of Definition 1 is given here: A citation at a year t2, t2 < t, where the citing source is indexed either in the Library of Congress or in Scopus at the year t2, and the cited source, published in the year t3, is indexed in the Web of Science Core Collection and was (is) indexed in Scopus at a year t4 with t2 < t4 ≤ t.
(2) The dataset D would enable the inclusion of many credible papers, like Wiles’ 1995 paper in Annals of Mathematics, and four good research papers by C. Peligrad; see Section 3.
(3) Let s and t be two years with s < t. If there were no retracted papers in the intervening years, then from the fact that the number of academic publications keeps rising with time and Definition 1, it is seen that D(s) would be a proper subset of D(t).
(4) The reason for stating item (iv) in Definition 1 is that the SCImago Research Group seems to keep the SJR scores and associated quartile rankings for about 20 or 21 years; see subsection 2.3.
2.2. Feature 2 for the RE-index and the Prestige-type Score
Although the original definitions of the h and g indices confine the cited work of a researcher to his/her papers, it seems nowadays that the evaluations of the two indices include all academic publications in the counting of the cited and citing sources. However, no distinctions are made between different types of academic publications or academic periodical publications. This is a disadvantage for the following three reasons:
Reason 1: Different types of papers and academic periodical publications may have different impact on research. Springer (see https://www.springer.com/gp/authors-editors/authorandreviewertutorials/writing-a-journal-manuscript/types-of-journal-articles/10285504) classifies papers into five main categories: “research papers,” “case studies,” “methods,” “review (survey) papers,” and “letters.” This classification would be adopted. A research paper contributes new results or findings to its topic (or topics) of investigation, while a review paper generally summarises the existing literature on a topic with the goal of explaining the current state of understanding on the topic. Case studies, which appear in scholarly journals in biological sciences and medicine, are equally important to research papers, as they report the occurrence of previously unknown or emerging pathologies; see, for example, https://academic.oup.com/clinchem. Case studies also have a prominent place in some scholarly journals in social sciences; see, for example, https://journals.sagepub.com/home/qix. Methods are articles that present experimental methods, tests or procedures. An article in this category should describe a demonstrable advance on what is currently available.
Research papers, case studies and methods appearing in scholarly journals and book series are at the forefront of research advancement. The web site: https://en.wikipedia.org/wiki/Conference_proceeding indicates that conference proceedings related to computer science, which include subjects like electronic engineering, are viewed in high regard in academia. This is in contrast to conference proceedings in other fields. Furthermore, the web site: https://www.scimagojr.com/journalrank.php?area=1700&type=all shows that computer science conference proceedings could be ranked among the top overall research publications in the field, which include the four categories: journals, book series, conference proceedings, and trade journals. In contrast, among 2,796 publications in mathematics recognized by Scopus, none of the top 100 publications is a conference proceeding; see the web site: https://www.scimagojr.com/journalrank.php?area=2600&type=all. Similarly, among 7,125 publications in medicine indexed by Scopus, none of the top 100 publications is a conference proceeding; see the web site: https://www.scimagojr.com/journalrank.php?area=2700. Note that the acceptance rate in some conference proceedings related to computer science might be as low as 10%; see the web site https://academia.stackexchange.com/questions/18349/difference-between-conference-paper-and-journal-paper.
There is no general consensus on whether papers in trade journals are peer reviewed. On one hand, the web site: https://guides.lib.utexas.edu/popularscholarlytrade views trade journals as being non-peer reviewed. On the other hand, the trade journal “IEEE Geoscience and Remote Sensing Magazine” asserts that articles in the journal are peer reviewed; see https://ieeexplore.ieee.org/xpl/aboutJournal.jsp?punumber=6245518. This seems to be supported by the web site: https://www.scimagojr.com/journalrank.php?area=2200, which ranks the trade journal as #41 among 6,335 publications in the field of engineering.
Other categories of papers and academic periodical publications have the following drawbacks:
(i) Review papers could play a negative role in citation counts. An article x might cite a review paper containing references where the original research was made, but these articles containing the original research are not cited in x.
(ii) Most letters have very little impact on the advancement of research. To the author’s best knowledge, a letter to an editor contains brief comments on a paper. This seems not to represent any significant advance in research, otherwise, it would have been submitted as a paper.
(iii) Research papers, case studies and methods appearing in conference proceedings that are not related to computer science often contain partial results, and they do not usually go through the presumed rigorous peer-review process that papers submitted to scholarly journals, book series or computer science-related conference proceedings go through. In addition, a paper x in a conference proceeding, not related to computer science, may induce either a more completed article, a variant of x or a covert duplicate publication of x.
Reason 2: Citation patterns for different types of academic publications could be very different. Some argue that academic publications, which cite more references (like review papers), get themselves many citations (Webster et al., 2009), and citation counts (alone) are not indicative of research impact.
Reason 3: The impact of different types of books need to be specified. From now on, the phrase “comprehensively-authored academic book” is used to mean either a monograph or a textbook, with the author (authors) being responsible for the entire contents of the book. Note that a monograph can be made of chapters or papers with different authors (see, for example, Meteorological Monographs of the American Meteorological Society), but this type of monographs represents a very small percentage of monographs. A typical monograph is an academic book written on a single specialized topic with usually one author, and it is devoted mainly to research works. Other academic books include books of essays (also known as edited books), handbooks, and reference books. A book of essays could be a conference proceeding, a collection of book chapters or a collection of new articles written, in honoring an eminent scholar, by colleagues or former students of the scholar with the articles reflecting a theme in which the scholar was interested. We are not considering here a book of essays that is made up of collected, previous works by an eminent scholar, since such books are repetitive of previous works. Comprehensively-authored academic books contain authoritative information, including comprehensive accounts of past or developing research, overviews, and experts’ views on topics. Book chapters are also important for learning and research, but their contribution to research seems to be smaller than comprehensively-authored academic books, and this may reflect on decisions of promotion and tenure. Note that monographs and book chapters could both appear in book series, which are academic periodical publications.
Reasons 1-3 entail the creation of a ranking of academic publications that is based on their types. This is done in Definition 2. To simplify the definition, some notation are introduced. Let S1 and S2 be 2 subsets of a set S. The union of S1 and S2 is denoted by S1 ∪ S2, and their intersection is denoted by S1 ∩ S2. We denote the set difference between S1 and S2 by S1\S2. The empty set is denoted by ∅. We use the symbol B1 to mean the set of all comprehensively-authored academic books. The set of book chapters found in books of essays is denoted by B21. We denote by B22 the set of articles written, in honoring an eminent scholar, that are not parts of conferences or similar gatherings but could be found in books of essays. The set of handbooks and reference books is denoted by B23, and the set made up of chapters or papers found in monographs is denoted by B24. We write B21 ∪ B22 ∪ B23 ∪ B24 as B2. The set of papers presented in conferences and similar gatherings, not related to computer science, that could be found in books of essays is denoted by B3. We define a trade journal to be vigorously reviewed if its SJR score puts it in the top 50% of all publications (journals, book series, conference proceedings, and trade journals). We denote the set of vigorously reviewed trade journals by TJ+. The set of all other trade journals is denoted by TJ−. Papers appearing in scholarly journals, book series or conference proceedings could be partitioned according to the Springer classification. Table 1 explains this. We denote by PJ the set of all papers in scholarly journals. The set of all papers in book series is denoted by PBS. By PCP-CS, we mean the set of all papers presented in conferences or similar gatherings related to computer science, and PCP-NCS denotes the set of all papers presented in conferences or similar gatherings that are not related to computer science.

Papers notation
In Table 1, the intersection of a column and a row represents a set of academic publications. For example, Pccs is the set of case studies presented in conferences or similar gatherings related to computer science. The symbol N/A means not applicable. Note that Prcs ∩ (Prb ∪ Prj) ≠ ∅, since conference papers could appear in book series or in special editions of scholarly journals. Similar observations could be made for every Z ∈ {Pccs, Pmcs, Prncs, Pcncs, Pmncs} with the corresponding first two sets belonging to the same column of Z.
Definition 2. The set of all academic publications in the dataset D (see Definition 1) is denoted by AP. The set AP is partitioned into the four mutually disjoint sets W1, …, W4 defined by:
(1)
w1=[(Prj∪Prb)\Prncs]∪[(Pcj∪Pcb)\Pcncs]∪[(Pmj∪Pmb)\Pmncs]∪Prcs∪Pccs∪Pmcs∪B1∪TJ+,w2=Psj∪Psb∪B2,w3=Prncs∪Pcncs∪Pmncs∪B3∪TJ_,w4=Plj.Note that W1 is not a disjoint union of seven sets. For example, the intersection Prcs ∩ B1 is not an empty set, since there are papers in conference proceedings related to computer science that are published in books of essays. Similarly, the set W3 is not a disjoint union of five sets.
For each k ∈ {1, … , 4}, we assign the rank k, called the prestige-type ranking, to the set Wk. We introduce a function ω : AP→ { 1,34,12,14} as follows: For every k ∈ {1, 2, 3, 4} and every x ∈ Wk, we define ω(x) by
The number ω(x) is called the prestige-type score of x.
2.3. Feature 3 of the RE-index and the Quartile Score
Research quality is classified into three categories: cognitive quality, methodological quality, and esthetic quality (Moed et al., 1985). Papers in academic periodical publications with high SJR scores usually excel in at least one of these three categories. So, it is tempting to use the SJR score as a measure of research quality. But among many fields that encompass applied and pure subjects (like mathematics), there is a discrepancy in citation patterns between different subjects in any of these fields, with applied subjects or subjects that are closely linked to applied fields drawing more citations than pure subjects of the field. Such discrepancy could be reduced with the use of the SJR-induced quartile ranking, since, virtually in any field with applied and pure subjects, there are several Q1 academic periodical publications which mainly publish articles in pure subjects of the field. (Another advantage of the quartile rankings is that they have lower probabilities of variation from a year to the next than the SJR scores. This could make the evaluation of the RE-index less complicated over two successive years; see Section 3.) Quantifying research quality could be done through the introduction of a metric based on the quartile rankings of academic periodical publications. There is still a problem with this approach; it is the fact that the SJR score of an academic periodical publication J at a year t0 may be either undefined or unavailable. This could be because either J is (was) not indexed in Scopus at the year t0 (despite being possibly indexed in the database D), or J was indexed in Scopus at the year t0 but the SJR of J at the year t0 is no longer available. The problem could be tackled by introducing the notion of the most relevant SJR score of J to the year t0 (see Definition 3). If the SJR score of an academic periodical publication J indexed in Scopus at a year s is available, we denote this score by SJR(J, s).
Definition 3. Let t be the ranking year, and suppose that J is an academic periodical publication.
(i) Let T −(t) be the set of all years s such that s ≤ t, J was indexed in Scopus at the year s and SJR(J, s) is available. Assume that T −(t) is nonempty. The most relevant SJR score of J to the year t is defined to be SJR(J, t1), where t1 = max{s : s ∈ T −(t)}.
(ii) Let t0 be a year satisfying t0 < t, and suppose that J was operational at the year t0. Let T +(t0) be the set of all years s such that t0 ≤ s ≤ t, J was indexed in Scopus at the year s and SJR(J, s) is available. Assume that T +(t0) is nonempty. The most relevant SJR score of J to the year t0 is defined to be SJR(J, t2), where t2 = min{s : s ∈ T +(t0)}.
The definition of the most relevant quartile score of an academic periodical publication to a given year is given next.
Definition 4. Let ˆt be the ranking year, and let y be an arbitrary year satisfying y ≤ ˆt. Denote by J(y) the set of all scholarly journals at the year y. Let JM(y) be the subset of J(y) consisting of multidisciplinary journals. For every field F, denote by J(F, y) the subset of J(y) consisting of journals specialized in the field F, that is, F is the main, dominant field of all papers published in any journal in J(F, y). Let F be the collection of all fields. It is clear that
Define the partition Ω(J(y)) of J(y) by Ω(J(y)) = {JM(y)} ∪ {J(F, y) : F ∈ F}. Let t be a year satisfying t ≤ ˆt, and let J1(t) ∈ Ω(J(t)). Suppose that J ∈ J1(t). Assume that the most relevant SJR score of J to the year t can be determined as explained in Definition 3; denote this score by SJR(J, s) for some year s. Suppose that, among the SJR scores of the entities in J1(s), the score SJR(J, s) indicates that J is in quartile k for some k ∈ {1, 2, 3, 4}. The most relevant quartile score of the journal J to the year t, denoted by q(J, t, s), is defined by
Formula (3) represents the methodology of quantifying research quality in journals. Similarly, we define the most relevant quartile score of a book series, a conference proceeding or a trade journal to a given year. (The SCImago Research Group does not provide the quartile ranking of a conference proceeding, but it could be determined from the SJR scores.)
Remark 3. Let t0 be a year, and let J be an academic periodical publication with which the most relevant SJR score of J to the year t0 can be determined. We will assume henceforth that the first time the most relevant SJR score of J to the year t0 was calculated, say at a year t, would always represent the most relevant SJR score of J to the year t0 at any subsequent year t' of t.
2.4. Feature 4 of the RE-index and the Length Score
Research papers, case studies or methods can considerably vary in length. The length of any of these papers is usually indicative of the number of results or their complexity (or both). Suppose that x1 and x2 are two papers in the same field, and that they are of the same type and prestige-type score (see (1) and (2)). In addition, assume that x1 and x2 appeared, respectively, in journals J1 and J2 with the same research quality (see (3)). Furthermore, suppose that x1 is 3 pages long and that x2 is 30 pages long. It would not be fair to equate the effort in producing x1, which probably lasted for few weeks, to the effort in producing x2, which probably lasted for a year or more. Some may argue that papers, short, medium, or long appearing in a journal should be considered of equal value, but such perception is not well-thought. This is because one main criterion for the appearance of a paper in a given journal could be its quality rather than its length. Furthermore, papers of different quality or length could appear in the same journal because different reviewers could have, for a variety of reasons, different standards. As citation counts play a role in the derivation of the RE-index, it is natural to investigate the relation between the length of a cited document and the number of citations it draws. In the field of medicine, a study (Falagas et al., 2013) found that, with the exclusion of review articles, experimental studies, and meta analyses, longer articles in five top ranking journals are cited more than shorter articles. The findings should not be surprising, but the study did not deal with a larger sample of journals, and it is confined to the field of medicine. The whole picture among all fields of human knowledge is different; there is a phenomenon, in which short papers could be cited in some fields more than long papers with a great deal of substance. To elaborate, the author brings two examples, including a personal one:
(1) Some top ranking journals (by any methodology), like Nature, severely restrict the number of pages for papers published in the journals (in the case of Nature, the upper bound of five pages is usually given for papers appearing in the journal). Such high ranking journals must attract large number of citations, regardless of the methodology of ranking the journals. It is highly doubtful that significant research in some, and probably many, fields could be given within a five page limit, taking into consideration the introductory and the references parts in the papers. A substantial paper in mathematics would require much more than five pages to include essential proofs, calculations, concepts or notions.
(2) Farid’s paper (1991) is one of only three relatively “light weight” papers, in terms of substance that the author has. In contrast, the rest of the author’s papers are longer and most of them are substantial, including Farid (1998). But the shorter, less significant paper has drawn more citations than the longer paper with more substance!
The phenomenon described by the preceding two examples, which contradict the findings in (Falagas et al., 2013), could be partially attributed to the methodologies used in many research performance indicators, as they do not reward the hard, serious research work done in long papers, and this may reduce the incentives for some readers to spend many hours reading and understanding such long papers. So, some substantial papers in some fields, like mathematics, could be ignored. The RE-index tries to re-invigorate interest in longer papers by considering the articles’ length in determining their value scores.
The foregoing discussion stipulates the inclusion of documents length in the determination of their values and the values of the citations they receive. For every x ∈ AP (see Definition 2), we denote the number of pages of x by l(x). If x is a book, it is highly likely that l(x) ≥ 30. The author conducted a survey of articles’ length in several fields to determine what suitable bounds could be set for articles’ length. Based on the survey, a partition of AP into four sets in terms of documents length is given as follows:
A score for academic publications that is based on the partition (4) of AP is given next.
Definition 5. Define a function v : AP → { 1,34,12,14} as follows: For every k ∈ {1, 2, 3, 4} and every x ∈ Nk, we define v(x) by
The number v(x) is called the length score of x.
2.5. Feature 5 of the RE-index and the Value Score for an Academic Publication
Definition 6. (i) Suppose that x is a paper that was published in an academic periodical publication J at a year t. In addition, assume that the most relevant SJR score of J to the year t can be determined; denote it by SJR(J, t, s) for some year s. The value score of x, denoted by VS(x), is the arithmetic mean of the prestige-type score ω(x) of x, the length score v(x) of x and the quartile score q(J, t, s). This is shown from the following diagram:
So,
Dividing ω(x) + v(x) + q(J, t, s) in (6) by 3 is for normalization. Remark 3 explains why V(x) was not associated with time.
(ii) Suppose that y ∈ AP (see Definition 2) and that y has an undefined or unavailable most relevant SJR score. The value score of y, denoted by VS(y), is the arithmetic mean of ω(y) and v(y), that is,
Note that in item (ii), y is usually different from a paper. But in few cases, it could be a paper; for example, y could be a conference paper that appeared in a book, which is indexed by the Library of Congress but not indexed by Scopus.
The logic behind the mathematical set-up of formula (6) is given in Remark 4. A similar reasoning could be given for formula (7). Note that two papers are compared if they are either in the same field or interdisciplinary articles with the same fields covered. The remark focuses on the case of two papers in the same field. The other case is similarly discussed.
Remark 4. Let x1 and x2 be two papers in the same field F, and let m ∈ {1, 2}. Assume that xm appeared in the academic periodical publication Jm at the year tm, and that the most relevant SJR score of Jm to the year tm is well-defined, and it indicates that Jm is in quartile km for some km ∈ {1, … , 4}. Furthermore, assume that xm ∈ Wim ∩ Njm for some im, jm ∈ {1, … , 4} (see (1) and (3)). The triple (im, jm, km) is called the identifying triple of xm. (To the author’s best knowledge, there are no letters that are 10 pages long or more. So, the total number of all possible identifying triples of a paper is 52 rather than 64.) Formula (6) is made so that if i1 + j1 + k1 = i2 + j2 + k2, then VS(x1) = VS(x2). So, for example, papers x1 and x2 with the following data have the same value scores:
-
x1 is a research paper, presented in a conference not related to computer science, and it appeared in a special edition of a journal of quartile 3. The length l(x1) of x1 satisfies 10 ≤ l(x1) < 20.
-
x2 is a review paper that appeared in a journal of quartile 4, and the length l(x2) of x2 satisfies 10 ≤ l(x2) < 20.
2.6. Feature 6 of the RE-index, Research Impact and the Citation Score
It is essential to derive a metric that would provide a value for each citation. Otherwise, it is possible to see two researchers of different stature in the same field with identical h or g indices. An extreme type scenario is described as follows: Researchers X1 and X2 work in the same field, they only publish papers, and they have the same number of publications and citations, and when publications for both researchers are ordered in a non-increasing order in terms of citations, the two researchers have identical publications-citations charts. However, researcher X1 publishes in Q1 journals and his/her publications are cited in Q1 journals, while researcher X2 publishes in Q4 journals and his/her publications are cited in Q4 journals. (The preceding example could occur but cannot happen frequently since the quartile score based on the SJR scores still depends to a considerable extent on citations counts. But less extreme examples could happen more frequently.)
Originally, the research impact of an article was identified by the number of citations it receives. But, as indicated in the Introduction, citation counts are marred with several disadvantages. A possible improvement of identifying research impact is to use weighted citations. This stems from the fact that citing articles appear in journals of different stature and could have different citation patterns. There are two well-known schools of thought in regard to the use of weighted citations: They are “the citing article impact” (Giuffrida et al., 2019) and “the citing journal ranking” (Davis, 2008; Yan & Ding, 2010). The two approaches have their merits and drawbacks. The first approach is supported by the fact that among many journals, a small percentage of articles in any of these journals contributes to most citations received by the journal; see Callaway (2016). However, defining the citing article impact by the citation counts it receives, or a variant of it, does not necessarily indicate a high academic significance; for example, the citing article could be a review paper drawing many citations, a paper that drew many negative citations (if such citations are counted) or an article that was published in an average journal and was mainly cited by papers in similarly average journals. These disadvantages may prompt the adoption of the citing journal ranking approach as a more appropriate choice for evaluating research impact. But a high ranking of the citing journal, based on citation counts, could have been influenced by articles in applied subjects or review articles, or by excessive journal self-citation. Using a different citation-based methodology in ranking journals, such as the Eigenfactor methodology, may not necessarily lead to very different findings. Davis (2008) deduced that, among 171 journals in medicine, a journal ranking based on the Eigenfactor yields very little differences from a journal ranking based on citation counts.
The methodology we use in evaluating research impact has profound differences from the two foregoing methodologies (see Definition 7). The value of a citation that a cited document x receives is derived from the value scores of the citing document and that of x. As indicated in Section 1, only nonnegative citations are counted.
Definition 7. Let t be a given year. Suppose that X is a researcher with respect to the dataset D(t) (see Definition 1). We denote by AP(X, t) the set of all x ∈ D(t) such that researcher X is an author of x. Let x ∈ AP(X, t). The set of all y ∈ D(t) such that y recorded a nonnegative citation of x is denoted by C+(x, t). We denote by C−(x, t) the set of all z ∈ C+(x, t) such that X is not an author of z. The citation score of x at the year t, denoted by CS(x, t), is defined by
Also, the citation score, excluding self-citations, of x at the year t, denoted by CSesc(x, t), is defined by
The reasoning for the set-up of (8) is given next. A similar argument is made for (9).
Remark 5. The inclusion of VS(x) in (8) is to tackle the problem of x getting many citations despite not having a high value score. Such problem may arise if x is a review paper, a short paper with catchy phrases that attracted many citations, or is published and highly cited in journals with low SJR scores. For each y ∈ C+(x, t), the product VS(x) VS(y) could be viewed as the adjusted value score of VS(y). Also, formula (8) satisfies the following condition:
So, the use of addition is a suitable choice for an elementary operation representing the citation value of x at the year t. Defining CS(x, t) by a product of the terms VS(x) and VS(y), y ∈ C+(x, t), or a variant of it, is not a suitable choice. Such formulation could make CS(x, t) less than the adjusted value score of at least one of y ∈ C+(x, t) by virtue of the fact that VS(x) and VS(y) could be both in (0, 1); see (6) and (7). (Even if we did not normalize the value score of an academic publication, its value score could still be less than 1.) Divisions or subtractions of the terms VS(x) and VS(y), y ∈ C+(x, t), are inappropriate operations to define CS(x, t).
2.7. Feature 7 of the RE-index
The inclusion of co-authorship in research assessment is essential for academic integrity. To explain this, let us consider the following example: Assume that x and y are two research papers in the same field. The two papers have the same bounds for articles length (see (3)) and appeared in journals with the same quartile ranking, but x is a 1-author paper while y has four authors. Although the two papers may be considered, with the use of a metric, to be of equal value, it would be a travesty of justice to assign the same credit to the author of x and each author of y. The set of 1-author articles is becoming more distinct. Waltman (2012) indicated that 89% of all publications indexed in the WOS in the year 2011 were joint publications. In mathematics and statistics, Grossman (2005) showed that back in the 1940’s, 1-author papers accounted for nearly 90% of all research papers in Mathematics and Statistics and that the percentage dropped to around 60% in the 1990’s. I conducted a 2017 survey of 25 journals in “mathematics & statistics” from all four journal quartile scores (based on the 2016 SJR), with a total of 3,127 papers surveyed. The survey seems to indicate that the dwindling trend of the percentage of 1-author research papers is continuing unabated.
Our methodology to address co-authorship is to assume equal contributions from all authors in a joint academic publication, and thus we distribute the credit of publication equally among the authors of the joint academic publication. This assumption may not always represent the actual contributions of the authors, but, due to the complexity of the interrelation that may exist between all or some of the authors in a joint paper, it may be difficult or even impossible to get credible information about the actual contribution of each author. Having said that, we believe that the proposed assumption of equal contributions from all authors reduces the unfairness that results from discounting the aspect of co-authorship altogether in research assessment. Some scholarly journals require authors of joint publications to declare individual contributions. This is supposed to remedy the problem of determining the actual contribution of each author, but there is no guarantee that such declarations are accurate, and journals may never be able to verify the accuracy of such declarations. Vavryčuk (2018) introduced a combined weighted counting scheme for the contributions of authors in joint papers. The scheme provides the seemingly sensible suggestion of giving a bonus to the corresponding author if the authors are listed in alphabetical order. However, there are situations where the corresponding author changed after the paper was accepted for publication. Vavryčuk (2018) also suggests giving a bonus to the first author and corresponding author if the authors are not listed in alphabetical order. But, because of possible coercive practices by some senior authors, such bonuses might not, in some cases, be fair to the other authors. The consideration of co-authorship also applies to citation credit. If a joint academic publication is cited, equal distribution of citation credit would be allocated to the authors of the cited document.
2.8. Feature 8 of the RE-index: Inclusion of the Overall Researcher Record
Researchers, who are perfectionists, usually make significant contributions to research. In fairness to them, all the citations they get should be taken into account. If all scholars followed the methodology of the h-index, we may never have researchers who would tackle the hard problems that each may require devoting several years of hard work. The author also shares the belief of some researchers, who emphasize the need to consider the overall research record and impact of each scholar. The elimination of some citations in the calculation of the h-index makes it susceptible to slight changes, and may result in the index being inconsistent in comparing scholars in the same field over different instants of time; see the first two examples in Waltman and van Eck (2012).
3. RESULTS
We use the formulas developed in the previous section together with the notions of equal authors contributions and equal citation credit distribution in joint academic publications to introduce several scores measuring the combined quantitative and qualitative aspects for both a researcher’s publications and the citations he/she receives. From these scores, we derive two versions of the RE-index, with one version including self-citations and the other excluding them (see (17) and (18)). We assume throughout the first four subsections of Section 3 that t is the ranking year, and X is a researcher with respect to the dataset D(t). So, AP(X, t) ≠ ∅ (see Definition 7). To simplify terminology, we introduce some notation. The set of all x ∈ AP(X, t) such that x is either a research paper, a case study, or a method is called the set of creative publications of X up till the year t, and is denoted by CP(X, t). We write AP(X, t) \ CP(X, t) as IP(X, t), and call it the set of informative publications of X up till the year t. We chose to write AP(X, t) as the disjoint union of CP(X, t) and IP(X, t) because research papers, case studies and methods signify the creativity aspect of the researcher.
The cardinality of a nonempty set S is denoted by card S. Recall that the number of authors of an academic publication x is denoted by n(x).
3.1. Scores of the Creative Publications and Their Citations
Assume that CP(X, t) is nonempty, and write the set as {x1, … , xK}. The creative work score of researcher X at the year t, denoted by CWS(X, t), is the sum of the “adjusted to co-authorship” value scores of x1, … , xK, that is,
If CP(X, t) = ∅, we set CWS(X, t) = 0. As the value score of an academic publication measures its quality, the score CWS(X, t) measures the combined quantitative and qualitative aspects of the creative publications of a researcher. Remark 6 provides more information about the algebraic formulation of (10).
Suppose that {y ∈ CP(X, t) : C+(y, t) ≠ ∅} is nonempty (see Definition 7), and write the set as {y1, … , yL}. The creative work citation score of researcher X at the year t, denoted by CWCS(X, t), is the sum of the “adjusted to co-authorship” citation scores of y1, … , yL, that is,
If {y ∈ CP(X, t) : C+(y, t) ≠ ∅} is empty, we set CWCS(X, t) = 0. The score CWCS(X, t) measures the combined quantitative and qualitative aspects of the research impact of the researcher’s creative publications.
Assume that {z ∈ CP(X, t) : C−(z, t) ≠ ∅} is nonempty, and write the set as {z1, … , zL1}. The creative work citation score excluding self-citations of researcher X at the year t, denoted by CWCSesc(X, t), is the sum of the “adjusted to co-authorship” citation scores, excluding self-citations, of z1, … , zL1 , that is,
If {z ∈ CP(X, t) : C −(z, t) ≠ ∅} is empty, we set CWCSesc(X, t) = 0. The score CWCSesc(X, t) measures the combined quantitative and qualitative aspects of the research impact of the researcher’s creative publications when self-citations are excluded.
The logic behind the mathematical set-up of formula (10) is given in the following remark. Similar explanations can be provided for formulas (11) and (12), and for the next set of formulas (14)(15)-(16).
Remark 6. In (10), dividing VS(xi) by n(xi), i = 1, … , K, stems from the notion of equal author contributions in joint papers. Also, formula (10) ensures that
Multiplying the terms VS(χ1)n(χ1) , … , VS(χK)n(χK) is not a proper way of defining CWS(X, t), since (13) might not be satisfied in this case. This is by virtue of the facts VS(xi) ∈ (0, 1] (see (6) and (7)) and n(xi) ≥ 1 for all i = 1, … , K. Using divisions or subtractions to define CWS(X, t) is invalid.
3.2. Scores of the Informative Publications and Their Citations
Suppose that IP(X, t) is nonempty, and write the set as {u1, … , uM}. The informative work score of researcher X at the year t, denoted by IWS(X, t), is the sum of the “adjusted to co-authorship” value scores of u1, … , uM, that is,
If IP(X, t) = ∅, we set IWS(X, t) = 0. The score IWS(X, t) measures the combined quantitative and qualitative aspects of the informative publications of a researcher.
Assume that {v ∈ IP(X, t) : C+(v, t) ≠ ∅} is nonempty, and write the set as {v1, … , vN}. The informative work citation score of researcher X at the year t, denoted by IWCS(X, t), is the sum of the “adjusted to co-authorship” citation scores of v1, … , vN, that is,
If {v ∈ IP(X, t) : C+(v, t) ≠ ∅} is empty, we set IWCS(X, t) = 0. The score IWCS(X, t) measures the combined quantitative and qualitative aspects of the research impact of the researcher’s informative publications.
Suppose that {ω ∈ IP(X, t) : C −(ω, t) ≠ ∅} is nonempty, and write the set as {ω1, … , ωN1}. The informative work citation score excluding self-citations of researcher X at the year t, denoted by IWCSesc(X, t), is the sum of the “adjusted to co-authorship” citation scores, excluding self-citations, of ω1, … , ωN1, that is,
If {ω ∈ IP(X, t) : C −(ω, t) ≠ ∅} is empty, we set IWCSesc(X, t) = 0. The score IWCSesc(X, t) measures the combined quantitative and qualitative aspects of the research impact of the researcher’s informative publications when self-citations are excluded.
3.3. The RE-index
The RE-index, including self-citations, of researcher X at the year t, denoted by RE(X, t), is given by:
The RE-index, excluding self-citations, of researcher X at the year t, denoted by RE1(X, t), is given by:
The following remark explains the logic behind (17). Formula (18) could be explained similarly.
Remark 7. We opted not to set the RE-index, including self-citations (see (17)), as the sum of the scores (10), (11), (14) and (15) since the sum could tilt the score heavily towards either (11) or (15) (or both) and this becomes contentious in light of the misuse of citations. A weighted sum has its problems as well because assigning weights should take into consideration the differences in citation patterns among different fields and different subjects within the same field, and selecting weights for interdisciplinary research with their large variety of topics is another problem. Observe that, based on the definitions of a researcher, the sum of the scores (10) and (14) is larger than 0. Note that it is not logical to represent the RE-index as the product of the scores (10), (11), (14) and (15) because one, or more, of these scores could be in the interval [0, 1), and, in this case, the RE-index would be less than at least one of these four scores. This situation is problematic since it could either lead to having an RE-index of 0 or downgrade the contribution of at least one of the scores (10), (11), (14) and (15) into the make up of the RE-index. A weighted product is even more problematic as it inherits the problems with defining the RE-index as the product of the scores (10), (11), (14) and (15), and also shares the same problems of a weighted sum. Formula (17) has the clear advantage in identifying each of the scores (10), (11), (14) and (15), and this is constructive because different researchers may pursue different forms of research work; some scholars publish mainly books, which translates to possibly high IWCS(X, t) score and low CWS(X, t) and CWCS(X, t) scores; some researchers produce many papers with many collaborators, which could translate to relatively average to high CWS(X, t) and CWCS(X, t) scores; while others publish a relatively small number of substantial papers with significant impact, which translates to relatively low to medium CWS(X, t) score and high CWCS(X, t) score. All of the foregoing characterizations of high and low scores are relative to the field(s) of the researcher. Observe that if a researcher publishes mainly research papers, case studies or methods, then his/her IWS(X, t) and IWCS(X, t) scores could be very small or zero.
It should be noted that the RE-index is harder to calculate than the other research performance indicators discussed in the paper. But research assessment is a serious issue that should not be addressed by an easy-to-calculate index that is marred with numerous flaws.
The following notation is used in the following remark. For a square real matrix A = (aij) of order n, we denote the n × n diagonal matrix whose i − th diagonal entry is aii, i = 1, …, n, by D(A).
Remark 8. We observe that the two versions of the RE-index could be represented using matrices. We focus our attention of the version defined by (17), and use the notation of subsections 3.1 and 3.2. Notice that K ≥ L and M ≥ N, and since X is a researcher, we have max{K, M} > 0. Let Q = max{K, M}. Define the 4 × Q score matrix S = S(X, t)=(sij) of researcher X at the time t by
-
First row of S:
Case 1. CP(X, t) ≠ ∅: s1j = VS(xj) if 1 ≤ j ≤ K; s1j = 0 if K < j ≤ Q.
Case 2. CP(X, t) = ∅: s1j = 0 for all j = 1, … , Q.
-
Second row of S:
Case 1. {y ∈ CP(X, t) : C+(y, t) ≠ ∅} ≠ ∅: s2j = CS(yj , t) if 1 ≤ j ≤ L; s2j = 0 if L < j ≤ Q.
Case 2. {y ∈ CP(X, t) : C+(y, t) ≠ ∅} = ∅: s2j = 0 for all j = 1, … , Q.
-
Third row of S:
Case 1. IP(X, t) ≠ ∅: s3j = VS(uj) if 1 ≤ j ≤ M; s3j = 0 if M < j ≤ Q.
Case 2. IP(X, t) = ∅: s3j = 0 for all j = 1, … , Q.
-
Fourth row of S:
Case 1. {v ∈ IP(X, t) : C+(v, t) ≠ ∅} ≠ ∅: s4j = CS(vj, t) if 1 ≤ j ≤ N; s4j = 0 if N < j ≤ Q.
Case 2. {v ∈ IP(X, t) : C+(v, t) ≠ ∅} = ∅: s4j = 0 for all j = 1, … , Q.
Also, define the Q × 4 authors-counting matrix C = C(X, t) = (cij) of researcher X at the time t by
-
First column of C:
Case 1. CP(X, t) ≠ ∅ : ci1 = 1/n(xi) if 1 ≤ i ≤ K; ci1 = 0 if K < i ≤ Q.
Case 2. CP(X, t) = ∅ : ci1 = 0 for all i = 1, … , Q.
-
Second column of C:
Case 1. {y ∈ CP(X, t) : C+(y, t) ≠ ∅} ≠ ∅ : ci2 = 1/n(yi) if 1 ≤ i ≤ L; ci2 = 0 if L < i ≤ Q.
Case 2. CP(X, t) = ∅ : ci2 = 0 for all i = 1, … , Q.
-
Third column of C:
Case 1. IP(X, t) ≠ ∅ : ci3 = 1/n(ui) if 1 ≤ i ≤ M; ci3 = 0 if M < i ≤ Q.
Case 2. IP(X, t) = ∅ : ci3 = 0 for all i = 1, … , Q.
-
Fourth column of C:
Case 1. {v ∈ IP(X, t) : C+(v, t) ≠ ∅} ≠ ∅ : ci4 = 1/n(vi) if 1 ≤ i ≤ N; ci4 = 0 if N < i ≤ Q.
Case 2. {v ∈ IP(X, t) : C+(v, t) ≠ ∅} = ∅ : ci4 = 0 for all i = 1, … , Q.
Denote the diagonal matrix D(SC) by E = (eij). Then the RE-index, including self-citations, of researcher X at the year t, is the quadruple (e11, e22, e33, e44).
3.4. Other Indices
Assume that CP(X, t) ≠ ∅, and that card CP(X, t) = K. The creative work index of researcher X at the year t, denoted by CWI(X, t), is the pair:
Note that the largest possible value of CWS(X, t) is K. The second coordinate in the pair on the right hand side of (19) could be regarded as indicative of the creative publications quality and the share of the number of 1-author publications in CP(X, t).
The self-citation index of researcher X at the year t, denoted by SCI(X, t), is the percentage corresponding to the quotient of the total number of self-citations of all publications in AP(X, t), divided by the total number of citations of all publications in AP(X, t).
3.5. An Application
We provide an illustration of the theory developed in the paper by estimating the two versions of the RE-index for the two mathematicians Costel Peligrad and myself in the year 2019. The dataset D, introduced in Section 2, will prove its advantage in addressing the aspect of fairness in the research assessment process. We abbreviate researchers C. Peligrad and F. O. Farid by the letters P and F, respectively. Since the ranking year t is the year 2019, we omit t from the formulas containing it in the previous subsections in Section 3. So, for example, the creative work score of C. Peligrad at the year 2019 is written as CWS(P).
3.5.1. Outline of the Research Work of C. Peligrad
Scopus, up till the end of the year 2019, indexed 28 publications of C. Peligrad, and has 95 citations credited to his work. The dataset D we use adds six more credible publications of C. Peligrad, and brings a total of 142 citations credited to his work by the end of the year 2019, including 31 self-citations. The six additional papers are as follows:
-
Szymanski, W., & Peligrad, C. (1994). Saturated actions of finite dimensional Hopf*-algebras on C*-algebras. Mathematica Scandinavica, 75, 217-239.
-
Gootman, E. C., Lazar, A. J., & Peligrad, C. (1994). Spectra for compact group actions. Journal of Operator Theory, 31(2), 381-399.
-
Peligrad, C. (1975). Invariant subspaces of von Neumann algebras. Acta Scientiarum Mathematicarum (Szeged), 37(3-4), 273-277.
-
Peligrad, C., & Zsido, L. (1973). A Riesz decomposition theorem in W*-algebras. Acta Scientiarum Mathematicarum (Szeged), 34, 317-322.
-
Peligrad, C. (1981). Derivations of C*-Algebras which are invariant under an automorphism group. Topics in Modern Operator Theory, 5th International Conference on Operator Theory, Timisoara and Herculane (Romania), June 2-12, 1980 (part of the Book Series: Operator theory: Advances and applications, Vol. 2, pp. 259-268).
-
Peligrad C. (1982). Derivations of C*-algebras which are invariant under an automorphism group. II. Invariant Subspaces and Other Topics, 6th International Conference on Operator Theory, Timisoara and Herculane (Romania), June 1-11, 1981 (part of the Book Series: Operator theory: Advances and applications, Vol. 6, pp. 181-194).
The first four papers were published in journals that were not indexed in Scopus at the times of publication, but the journals are indexed in the Web of Science Core Collection and are now indexed by Scopus. The remaining two papers are conference papers that appeared in the Book Series: Operator theory: Advances and applications, which is listed in the Library of Congress. Among the 34 papers of C. Peligrad, 26 papers are cited. Some calculations show that
and IWS(P) = IWCS(P) = 0. Then from (17) and (20), we get RE(P) ≈ (15.94, 50.5, 0, 0), and from (18), (20) and (21), we obtain RE1(P) ≈ (15.94, 37.91, 0, 0).
3.5.2. Outline of the Research Work of F. O. Farid
Scopus, up till the end of the year 2019, indexed 18 publications of F. O. Farid, and has 140 citations credited to his record. We were only able to verify the existence of 133 citations of the researcher that could be included in the dataset D, including 14 self-citations. Among the 18 papers of the author, 15 papers are cited. Some calculations show that
and IWS(F) = IWCS(F) = 0. Then from (17) and (22), we get RE(F) ≈ (10.35, 48.02, 0, 0), and from (18), (22) and (23), we obtain RE1(F) ≈ (10.35, 38.86, 0, 0).
3.5.3. Geometric Interpretations of the Creative Work Scores and Creative Work Citation Scores for C. Peligrad and F. O. Farid
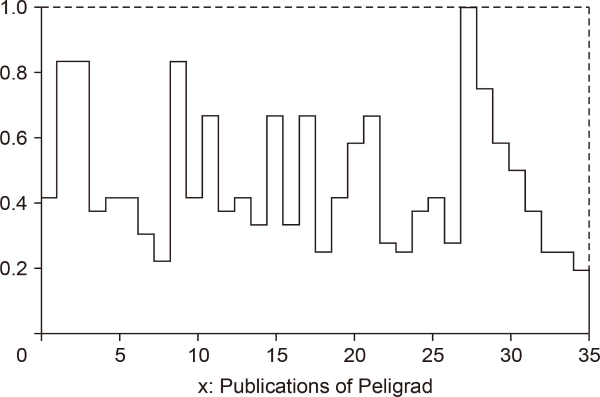
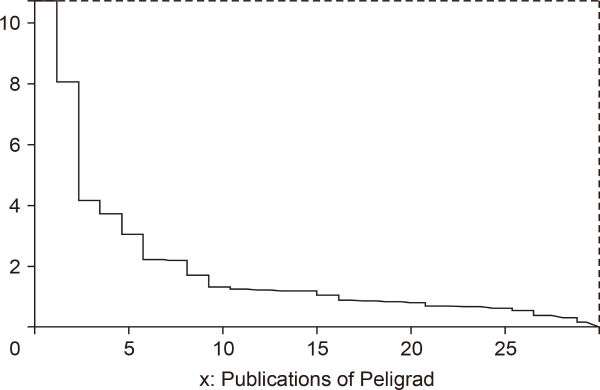
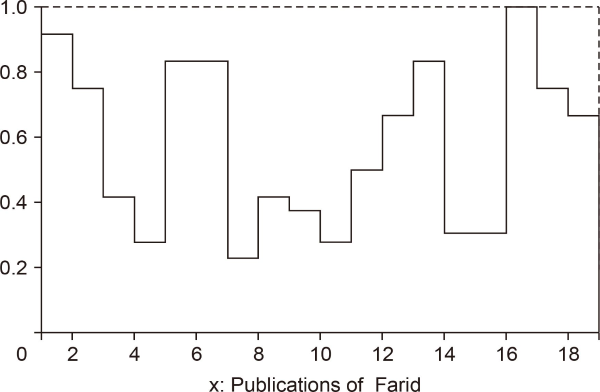
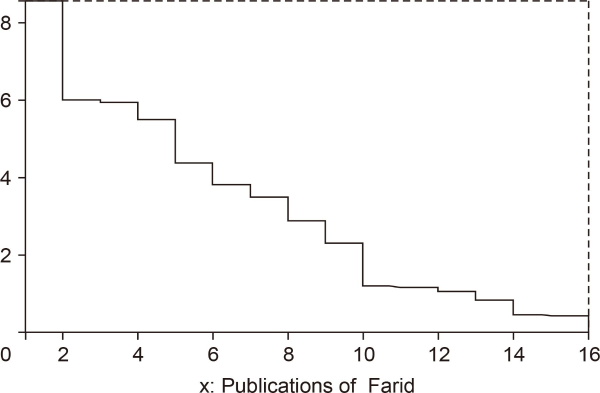
The academic publications of Peligrad are ordered as follows: The cited publications (there are 26 publications of them) are ordered in a non-increasing order in terms of the adjusted to co-authorship citation scores. The remaining eight publications are ordered in a non-increasing order in terms of the adjusted to co-authorship value scores. A similar ordering is used for Farid; see Fig. 1Fig. 2Fig. 3-4. Note that 0 in each of the four figures represents the origin for the vertical axis x = 1.

Creative work score of Peligrad.

Creative work citation score of Peligrad.

Creative work score of Farid.

Creative work citation score of Farid.
In Fig. 1, the area A1 of the region bounded by the broken line, the vertical lines x = 1 and x = 35, and the x − axis (y = 0) represents CWS(P). The second coordinate in CWI(P) (see (19)) is the quotient of A1 divided by 34. In Fig. 2, the area A2 of the region bounded by the broken line, the vertical lines x = 1 and x = 27, and the x − axis represents CWCS(P). Similar observations apply to Fig. 3 and 4.
3.5.4. Comparison of Some Research Performance Indices for C. Peligrad and F. O. Farid
In Table 2, we provide the research performance indicators: publication counts adjusted to co-authorship (abbreviated as publication counts adj.), citation counts, the h-index, the fractional h-index (abbreviated as frac. h index), the g-index and the fractional g-index (abbreviated as frac. g index) and the two versions of the RE-index for the researchers C. Peligrad and F. O. Farid.
Indices charts
Remark 9. (i) Although Farid has an advantage over Peligrad in some aspects of research, such as the number of long papers for both 1-author and multiple author papers and percentage of self-citations (see item (ii)), it would not be fair that any research performance indicator would overall rank Peligrad lower than Farid; this is the case with the h and g indices and the fractional h-index. It should be noted that Peligrad has been producing high quality research for about 47 years, compared to the approximately 31 years Farid has been doing research. Also, Table 3 clearly indicates that Peligrad has an advantage in the number of papers in the top two quartile ranking journals (Q1 and Q2). We believe that the RE-index clarifies the points of strength for each researcher and ranks Peligrad in a higher stature than Farid (mainly due to age difference).
Top quartile journals
(ii) Table 2 shows that, in regard to publication counts adjusted to co-authorship, Farid’s score represents about 57.72% of Peligrad’s score, while Farid’s CWS(F) represents about 64.93% of Peligrad’s CWS(P) (see (20) and (22)). Part of the discrepancy between the two percentages stems from the fact that Farid’s record has a higher percentage of long papers (papers of 30 or more pages) and papers of above average length (papers of 20 pages or more) than Peligrad’s record has. About 22.22% of Farid’s papers are long papers and 55.56% of his papers are above average in length, while Peligrad has one long paper representing about 2.94% of his total number of papers, and he has four papers that are above average in length representing about 11.76% of his total number of papers. In addition, Farid has two long 1-author papers and five 1-author papers that are above average in length, while Peligrad has a single 1-author paper that is above average in length. It is clear from (20)-(23) that CWCS(F) represents about 95.11% of Peligrad’s CWCS(P), while the CWCSesc(F) score is higher than CWCSesc(P). Note that Peligrad’s self-citation index is approximately 21.83%, while Farid’s self-citation index is approximately 10.53%.
4. DISCUSSION
We outline the main attributes of the methodology used in deriving the RE-index, which distinguishes the index from the four popular research performance measures: the h-index, g-index, publication counts, and citation counts:
(i) The dataset D introduced in subsection 2.1 takes advantage of the current, wide coverage of Scopus and the Library of Congress, and at the same time deals with the depth problem in the Scopus database. This would allow the inclusion of many good research papers that are not included in the Scopus database, such as Andrew Wiles’ paper which proved Fermat’s Last Theorem, and four papers by Costel Peligrad; see subsection 3.5.
(ii) The methodology in deriving the RE-index makes two main distinctions among academic publications. One distinction is based on the type of the academic publication, where we adopt the Springer classification of papers into five categories, and classify books into several categories. We provide a ranking of academic publications based on their types, and associate such ranking with a score: the prestige-type score. Another distinction we make for academic publications is done through classifying them into creative and informative publications.
(iii) We use the SJR scores for academic periodical publications to classify each of their four categories (journals, book series, conferences & proceedings, and trade journals) into four quartile rankings, and introduce the most relevant quartile score to a given year, which measures the stature of an academic periodical publication.
(iv) We consider the length of academic publications as indicative of the number of results or their complexity (or both). We introduce a classification of academic publications that is based on their length, and associate this classification with a score: the length score.
(v) For every academic publication x, we introduce the value score VS(x) of x. If x is cited, the citation scores (8) and (9) measure the qualitative aspect of the research impact of x in the cases of including and excluding self-citations, respectively.
(vi) We take into consideration co-authorship. In deriving formulas (10)-(12) and (14)(15)-(16), we apply the notions of equal author contributions, and equal distribution of citation credit in joint academic publications. The rationale for the method was explained in subsection 2.7.
(vii) The creative work score CWS(X, t) of researcher X at the year t blends the qualitative and quantitative aspects of the creative work of the researcher into a single score. A similar observation applies to the informative work score IWS(X, t).
(viii) When self-citations are included, the creative work citation score CWCS(X, t) of researcher X at the year t merges the qualitative and quantitative aspects for the research impact of the creative work of the researcher into a single score. Similar observations apply to the scores CWCSesc(X, t), IWCS(X, t) and IWCSesc(X, t).
(ix) The formulation of each of the two versions of the RE-index as a quadruple of four scores (see (17) and (18)) has the constructive approach of identifying each of the four scores that make up both versions of the index. This, in turn, provides an accurate outlook of the type of research activity the researcher has been engaged in.
(x) The second coordinate in the creative work index (see (19)) is indicative of the quality of the creative publications by the researcher and the share of 1-author publications among the total number of creative publications the researcher has.
5. CONCLUSION
It is the author’s opinion that the methodology used to establish the two versions of the RE-index makes the measure a fair and objective tool for assessing researchers within the same subject of a given field. The other six measures in Table 2 have their flaws in addressing this issue. The use of formula (3) as a normalizing factor in measuring research quality among different subjects of the same field and its use in the derivation of the RE-index may reduce the discrepancy in comparing researchers in different subjects of the same field, but they may not eliminate completely such discrepancy by virtue of the fact that publication and citation rates could still differ among different subjects of the same field. The author considered normalizing techniques among different fields, but opted not to do so for two main reasons: (i) There is an availability issue for citations data in a given field at a given year; for example, if we are trying to find a citation average of articles in journals in a given field 25 years ago, this might not be available in databases for citations. Using the most relevant citation averages techniques for comparing many different fields involves extensive, complex estimations that do not justify the end goal. (ii) Setting a citations average for interdisciplinary articles may be extremely difficult. As a result, the RE-index should not be used in comparing researchers from different fields.
SUPPLEMENTAL MATERIALS
Supplemental materials are available from https://doi.org/10.1633/JISTaP.2021.9.3.5
REFERENCES
(2016) Publishing elite turns against impact factor Nature, 535(7611), 210-211 https://www.proquest.com/docview/1804902988.
(2006) An improvement of the h-index: The g-index ISSI Newsletter, 2(1), 8-9 https://www.issi-society.org/media/1182/newsletter05.pdf.
(1991) Spectral properties of perturbed linear operators and their application to infinite matrices Proceedings of the American Mathematical Society, 112(4), 1013-1022 https://www.ams.org/journals/proc/1991-112-04/S0002-9939-1991-1057943-2/S0002-9939-1991-1057943-2.pdf.
(2005) Patterns of research in mathematics Notices of the American Mathematical Society, 52(1), 35-41 https://www.ams.org/journals/notices/200501/fea-grossman.pdf?adat=January%202005&trk=200501fea-grossman&cat=feature&galt=feature.