1. INTRODUCTION
Research performance in Korean universities is assessed by evaluation standards based on the number and venue of publications, where publication venues are grouped into hierarchical categories that typically start from Nature and Science at the top, followed by Social Science Citation Index (SSCI), Science Citation Index (SCI), Arts & Humanities Citation Index (A&HCI), Scopus, and Korea Citation Index (KCI) journals. The evaluation standards also have provisions for co-authored papers that reduce the assessment score of a publication in proportion to the number of authors (Lee & Yang, 2015, 2017).
Since the formulaic application of the evaluation standard generates scores for the research performance portion of annual faculty review, which in turn leads to annual salary adjustments and eventually affects promotion and tenure, a strategic publication practice is of paramount importance to faculty in Korean universities. For instance, KCI journals, which have much quicker turnaround time than do SCI, SSCI, and A&HCI, seem to be the preferred publication venue for many Korean researchers despite the lower points it garners in the research evaluation process (Lee & Yang, 2017; Yang & Lee, 2012). The number of authors for a publication is also kept to a minimum in accordance with the evaluation standards, which tends to discourage research collaboration. On the contrary, faculty evaluation in the U.S. is generally carried out by peer review, where research collaboration is regarded highly rather than devalued. With such differing research landscapes, it is not surprising to see differences in publication patterns between Korean and international researchers, as prior studies have shown (Yang et al., 2018, 2021).
The research presented here extends earlier studies that assess the state of library and information science (LIS) research in Korea. Specifically, we are interested in finding out how productive and impactful the LIS research is in Korea, what the trend of collaboration is, and what the key areas of research are. In order to gauge these things, we are going to use the state of international LIS research as the baseline.
There are two general approaches to evaluating the state of research in a given domain. One can compile a list of authors in the target domain (e.g., faculty lists of LIS schools) and obtain the list of publications and associated publication data for each author, or identify the set of publication venues (e.g., LIS journals indexed in Web of Science [WoS]) for the domain, and collect the publication data for that set. The former would generate a comprehensive publication dataset of researchers dedicated to the target domain, whereas the latter would lead to a broader cut of research output for the target domain that includes the works by authors from related disciplines. Since our focus is on assessing the state of LIS research, rather than LIS researchers, we opted for the second approach.
For the study we chose WoS and KCI since they are most readily available and represent the core publication venues of researchers in general. Other data sources, such as Google Scholar and Naver Academic, offer more comprehensive data but contain more noise. Books are also excluded from the study since their bibliometric data (e.g., citations) is difficult to obtain. We collected and analyzed bibliometric data of papers published in the past two decades in order to discover the main patterns and trends of LIS research by Korean and international scholars.
The rest of the paper is organized as follows: related research is summarized next, followed by the presentation of research methodology, analysis of results, and discussion of findings and their implications.
2. RELATED RESEARCH
Research effort that investigates the state of LIS research in Korea has been ongoing since the early 2000s. Principal among them are studies that applied bibliometric analysis to investigate publication patterns of specific disciplines,1 research that explored methods for evaluating research performance (Lee, 2006; Lee & Chung, 2014; Lee & Yang, 2011; Yang & Lee, 2013; Yang et al., 2015, 2016; Yoon & Kim, 2005), and those that examined the research evaluation standards practiced in Korean universities (Kim et al., 2012; Lee & Yang, 2015, 2017; Lee et al., 2019).
Earlier research that analyzed the publication pattern in LIS found an infusion of cross-disciplinary citation patterns, namely IS-centric papers citing computer science publications (Oh, 2005), the emergence of information service as a popular topic (Song, 2010), and the surge of productivity by LIS researchers (Chung & Park, 2011). More recent studies, which validated and extended earlier findings, reported library services to be among the dominant topics (Park & Song, 2013) as well as increased citations to LIS journals from other disciplines (Jeong, 2020; Lee, 2015). Others found bibliometric pattern differences across subject areas in LIS, most notably in the topic area of bibliographic studies that showed high productivity but low impact (Yang et al., 2015, 2016). Studies that examined research evaluation standards in Korea found the assessment metric to be unaccommodating to disciplinary differences, insensitive to citations, and unfavorable to collaboration (Lee & Yang, 2015, 2017; Lee et al., 2019).
There are many studies that explore the differences in publication patterns across disciplines (Glänzel & Schoepflin, 1999; Hammarfelt, 2016; Nederhof, 2006; Ochsner et al., 2017; Yang, 2019) but comparative analysis of a given field in different domains, namely domestic and international, is rather scarce. A study that compared KCI and SSCI journal publications found notable differences in citation and collaboration patterns (Yang et al., 2018), which was further validated in a recent study (Yang et al., 2021). This paper presents an extension of the later study with additional data and in-depth bibliometric analysis to highlight differences in publication patterns between Korean and international scholars.
3. METHODOLOGY
3.1. Data Collection
For the study we collected publication data of the articles published in KCI and WoS LIS journals from 2002 to June 2021, which spans 19.5 years. 2002 was chosen as the starting point because KCI LIS journal data begins in 2002. The study data consisted of 6,572 KCI articles from eight Korean LIS (KLIS) journals with 29,597 citations and 89,941 WoS articles from 85 international LIS journals indexed in the SSCI, that were cited 1,396,278 times.
Clarivate’s Web of Science classifies journals into five research areas of Arts & Humanities, Life Sciences & Biomedicine, Physical Sciences, Social Sciences, and Technology, and assigns one or more subject categories to each journal it indexes. Of 164 journals listed under the Journal Citation Report’s Web of Science Category2 of “Information Science & Library Science,” we excluded 78 journals from the Emerging Sources Citation Index as well as an outlier (Library Journal) with over 4,000 annual publications to arrive at 85 WoS LIS (WLIS) journals in the study sample. KCI’s Journal Classification Search3 listed 18 journals under the category of “Library and Information Science,” of which only 10 journals were indexed in KCI. Upon exploratory examination of journal articles, we determined Science Editing and Journal of Convergence for Information Technology to be uncharacteristic of LIS and excluded them from the study sample to arrive at 8 KCI LIS journals. The complete list of journals is shown in Appendix A and B.
3.2. Data Processing
Since data downloaded from KCI and WoS differ in data fields and format, they must be processed into a uniform form to facilitate comparative analysis. Identifying common fields is a rather trivial task, but parsing multi-valued fields, such as co-authors and keywords, must be done with care. The default delimiters for KCI data is a comma, which can cause problems for English author names that are spelled in the format of last name followed by comma and first name. For example, Gildong Hong and John Doe can appear in the KCI co-author field as “Hong Gildong, Doe, John,” which can be erroneously parsed into three authors of Hong Gildong, Doe, and John. The common practice of writing last name before first name in Korea can also cause a slew of problems in normalizing author names.
WoS uses a semicolon as the default delimiter, which makes splitting up multi-valued fields easier. However, WoS does not offer an easy way to obtain author institution information because institution names must be extracted from the author address field, where institution names are embedded in a non-standardized manner. Extraction of institution name from author fields is a non-trivial task since it sometimes contains extraneous information such as subsidiary affiliation (e.g., school/college, department) and location (city, state, country) in various formats. KCI lists the author’s affiliation in parentheses after each author name, but erroneous omissions of the comma delimiter as well as institution and author names containing commas (e.g., “John Doe (UCLA) Gildong Hong (Seoul University),” “Doe, John (Department of Biology, UCLA, Los Angeles, USA), Hong Gildong (Seoul University, Korea)”) complicate the extraction process.
The keyword field in KCI data not only suffers from delimiter errors (e.g., “keyword1. keyword2”) but sometimes contains full sentences rather than keywords (e.g., “A Study of the Propaganda Policy of the United States Information Service in Korea during the Korean War”). Also, some fields in KCI can contain line breaks (1,071 of 6,572 records), which can cause problems if data are exported in a text format for further processing. We spent considerable time and effort to resolve parsing and extraction problems caused by erroneous data via iterative heuristic algorithms, discussion of which is beyond the scope of this paper, but we suspect data problems still exist, especially in the extraction of institution names and keywords.
After extracting author and institution names, we applied normalization steps to conflate the names to their canonical form. We extended name normalization methods from a prior study (Shin & Yang, 2017) that involved acronym identification and name variation conflation by feeding in new data and refining the heuristic iteratively. For author name normalization, we applied two additional steps to deal with anglicization of Korean names. The first step employed a simple heuristic based on detection of capitalization, hyphen, and comma to transform anglicized Korean names to a canonical form (e.g., “Hong, Gildong,” “Hong Gil-dong,” “Hong GilDong” → “Gildong Hong”). The second step, whose task is to match the anglicized Korean name to the name in Korean (e.g., “Hong, Gildong,” “Hong Gil-dong,” “Hong GilDong” → 홍길동), utilized a name-mapping table that matches anglicized Korean names to Korean names and a name-character mapping table that maps a letter of Korean names to its anglicized version (e.g., 홍 → Hong). The name-mapping table was developed by querying Google Translate with Korean names, extracting potential mappings based on frequency and a list of known Korean last names,4 and manually validating the mappings. The name character-mapping table was developed by parsing the name-mapping table entries and manually validating the most frequent character mappings.
3.3. Data Analysis
In addition to the common measures of publication count for productivity and citation count for impact, this study examined citation count per publication (i.e., average citation count) to assess the average impact of publication and number of authors per paper to gauge the degree of collaboration. The average citation count is an important measure in comparing research impact across domains since the size difference among domains (e.g., number of Korean vs. international LIS authors) can unduly influence the raw citation count. Collaboration expressed in terms of number of co-authors per paper is another important measure because university research evaluation standards in Korea that uniformly penalize co-authored papers (Lee & Yang, 2015, 2017) can be disadvantageous to disciplines that tend to collaborate more.
After examining size differences of KCI and WoS domains in the number of authors, institutions, and journals to put publication and citations counts in perspective, this study investigated co-authorship patterns over time to compare collaboration trends of Korean and international scholars, and analyzed the data at author and institution levels to explore how the influences of authors and institutions on research output differ across domains. In addition, the study compared KCI and WLIS journals in terms of publication, citation, and average citation counts over time so as to ascertain how publication venues for KLIS authors differ from international scholars. Last but not least, we conducted publication and citation frequency-based analysis of keywords to identify popular and impactful topics, and visualized top keyword clusters using VOS viewer.5 To examine differences between popular and influential topics as well as to circumvent computational limitations, we created two sets of keyword vectors for clustering: one from documents with popular keywords (i.e., keywords with high publication counts) and another from documents with influential keywords (i.e., keywords with high citation counts).
4. RESULTS
4.1. Size Comparison
The overall statistics shown in Table 1 highlight the size differences between domestic and international LIS research. There are many more international authors than Korean authors, which is likely due to the greater number and size of international institutions in comparison to Korean counterparts. There are also more WoS journals than KCI journals, but international authors face stiffer competition due to their size. The number of WoS journals is 10.7 times as many as that of KCI but the author count ratio of WoS to KCI is 27.2, so international authors will need to compete with 2.5 times as many authors per journal as do Korean authors.

Size comparison of KCI and WoS LIS data
Publication count (pcnt) and citation count (ccnt) are often used as a measure of research productivity and impact, respectively. The overall productivity and impact are greatly influenced by the size of research domain as can be seen in pcnt and ccnt numbers for KCI and WoS. The larger author pool of international research will generate more publications, which will in turn reach more audiences than the smaller domestic research would. To get past the overall performance, however, we need to consider the data in terms of ratios.
The pcnt ratio of WoS to KCI is 13.7 to 1, but the ccnt ratio is 47.2 to 1. Since there are 27.2 times as many WoS authors as KCI authors, WoS authors appear to be only half as productive as KCI authors (13.7/27.2). This is confirmed by the average publication count per author (p/a) value of 0.5. On the other hand, WoS authors are cited almost twice as much (c/a=1.7), while the average citation count of a WoS paper (c/p) is over three times that of KCI paper. In other words, KLIS authors are twice as productive as international authors, who are almost twice (1.7 times to be exact) as impactful, which can be explained by the high average impact of WoS paper (c/p=15.5).
The institutional productivity (p/i) is about the same but WoS institutions have 2.6 times the impact of KCI (c/i: 544.6 vs. 213.1), and the journals show a similar but slightly exaggerated pattern, with comparable levels of productivity (p/j) and 4.5 times the impact. This suggests that international journals and institutions tend to higher quality research output than Korean counterparts on average.
We should be careful in using ccnt as the measure of impact. Aside from all the problems associated with equating ccnt with impact, such as the undifferentiated importance of citations and the impact of citing authors, raw ccnt not normalized across data domains can lead to erroneous inferences. For instance, WoS ccnt, which is affected by much larger numbers of WoS papers and authors than those of KCI, should be scaled appropriately when comparing it to KCI ccnt. At the article level, the measure to use is ccnt divided by pcnt, which can be thought to reflect the average impact of a paper. In the study, we use ccnt divided by the number of authors (aucnt) to gauge the average impact of an author. In short, one should use ccnt divided by the number of units most appropriate for the level of analysis (e.g., author, institution, etc.). The same goes with productivity and pcnt: pcnt divided by aucnt for author productivity and pcnt divided by the number of institutions (incnt) for institutional productivity, and so on.
One of the caveats in bibliometric analysis beyond the quantity versus quality argument stems from inaccurate and incomplete data. Data inaccuracies resulting from faulty data entry, missing data, and parsing and normalization problems can lead to invalid analysis results. Since citation databases are built from truncated citation networks rather than the entirety of the citation universe, publication and citation counts can be underreported. Specifically, KCI journal papers citing WoS papers will not be counted as citations in the WoS database and WoS papers citing KCI papers will not be counted in the KCI database. We assume the data inaccuracies and incompleteness are not large enough to affect the analysis in a significant fashion. WoS includes KCI journal data as one of its regional databases, but it compiles the citation data from the WoS citation database. For the 8 KCI journals in the study, the WoS KCI database had 868 citations (2.7% of KCI citations). Since there is no simple way to include KCI citations to WoS publications and the WoS KCI citation count was small enough, we did not include it in the analysis.
4.2. Co-authorship Trends
One of the most significant findings from prior studies that compared Korean and international LIS research was the difference in co-authorship, where international researchers tended to exhibit a much higher degree of collaboration than Korean researchers. Figs. 1 and 2 exhibit the study results, which confirms prior findings (Yang et al., 2018, 2021).

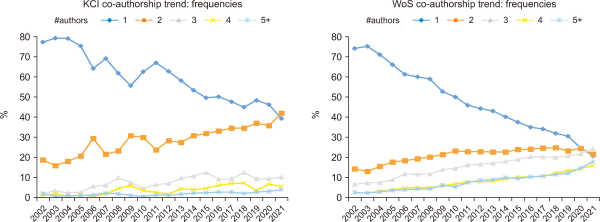
Frequencies of co-authorship by year. KCI, Korea Citation Index; WoS, Web of Science.

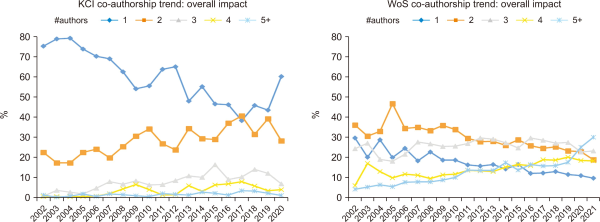
Impact of co-authorship by year. KCI, Korea Citation Index; WoS, Web of Science.
Fig. 1 plots the frequencies of co-authorship by year and Fig. 26 plots the overall impact of co-authorship by year. The frequency of co-authorship, which is represented by the number of co-authors per paper (i.e., author count), is charted by computing the percentage of publications for each author count, and the impact is charted by computing the percentage of citations for each author count. The percentage is used instead of raw counts so as to mute the effects of variations in publication and citation counts over time.
The proportion of single-author publications went from 77% in 2002 to 39% in 2021 for KCI (38% reduction), while WoS single-author paper frequencies show a much sharper decline of 74% to 21% (53% reduction). Co-authorship of two, on the other hand, shows an increasing trend in both KCI and WoS. In KCI 2-author frequencies went from 19% to 42% (23% increase) to surpass single-authorship in 2021, while WoS 2-author frequencies show a more moderate increase of 8% (14% in 2002 to 22% in 2021). Co-authorships with three or more authors also exhibit increasing frequencies, though the gap between them and 2-author frequencies is more pronounced in KCI (Fig. 1).
The impact of single-authors, computed in terms of citation counts, shows a decreasing pattern — from 75% to 60% for KCI and from 30% to 10% for WoS — in contrast to that of multiple authors that shows an upward slope of general increase. Within co-authorships (i.e., author count > 1), KCI and WoS exhibit opposite patterns. For KCI, 2-author impact shows the most pronounced increase over the years while the co-authorship of five or more displays a much more muted rate of increase. For WoS, 5-plus co-authorship exhibits the most markedly upward trend of impact increase while 2-author impact shows a decreasing pattern (Fig. 2). Given the citation lag that tends to underrepresent citation counts of recent years, the sharp increase of WoS 5-plus co-authorship in recent years (18% in 2019, 25% in 2020, 30% in 2021) is rather remarkable.
The apparent rise of 2-author co-authorship in KLIS research could be partially due to the university evaluation standards that award corresponding authors the same credit given to first authors. As LIS programs in Korea matured and began producing graduate students under the tutelage of faculty, 2-author collaboration became more commonplace and abbreviated versions of Master’s theses would often be published in journals. The effect of the penalty imposed by Korean university standards on collaboration beyond two authors, which is proportional to number of authors, is reflected in both frequency and impact of co-authorship charts, where lines are successively lower as author counts get larger (Figs. 1 and 2). Contrarily, the impact of WoS co-authorship exhibits an increasing trend commensurate to author counts, which suggests a more vigorous research collaboration landscape among international researchers than for Korean scholars.
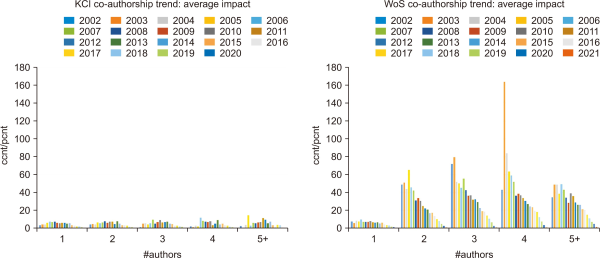
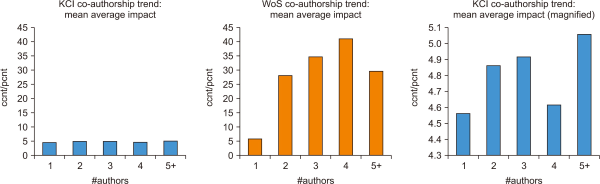
Figs. 3 and 4 display average impact of co-authorship, where we can examine the relative quality of collaborative research. The average impact, computed in terms of citation count divided by publication count, represents the average citation counts per paper, which in turn reflects the quality of research. Fig. 3, which plots average impact by year in clusters of author counts, illustrates the high impact of collaboration that is muted in Fig. 2 due to high volumes of single- and 2-author publications. The rightmost chart in Fig. 4 showing the magnified mean average impact (average impact averaged over year) of KCI co-authorship further highlights how collaboration among researchers can produce higher quality papers, though the gap between average impact of single-author research and collaborated research is much higher in the international arena than among KLIS authors.

Average impact of co-authorship by year. KCI, Korea Citation Index; WoS, Web of Science; pcnt, publication count; ccnt, citation count.

Mean average impact of co-authorship. KCI, Korea Citation Index; WoS, Web of Science.
4.3. Author-level Analysis
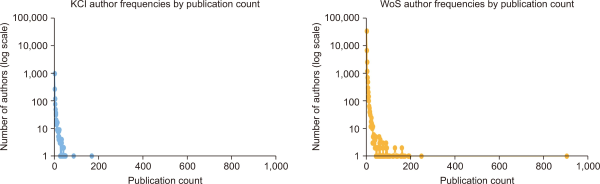
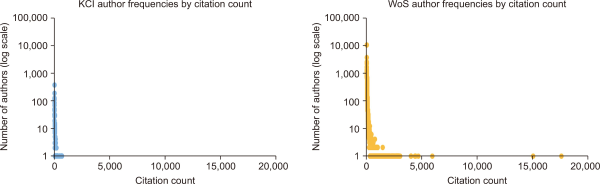
By analyzing publication data at the level of authors, we can explore how productivity and impact is distributed across authors. As with many observable phenomena in the physical world, both productivity and impact of authors conform to Bradford’s law as can be seen by Pareto distributions in Figs. 5 and 6 that reflect Bradford’s law of research. The figures elucidate how a small number of “core” authors are highly productive and impactful while the majority of authors neither publish much nor get cited highly.

Author frequencies by publication count. KCI, Korea Citation Index; WoS, Web of Science.

Author frequencies by citation count. KCI, Korea Citation Index; WoS, Web of Science.
Table 2, which lists percentile numbers of author productivity (pcRank) and impact (ccRank) side by side, further illustrates this phenomenon. The pcRank columns show that 90% of KCI authors published nine or fewer articles (pc/au) with the aggregated output amounting to only 47% of the total publication count (pc%RT) and 40% of total citation count (cc%RT), while 90% of WoS authors published fewer than four articles with the aggregated total of 60% publications and 65% citations. The 95% column indicates that the most productive 5% of KCI authors published 38% of all publications while WoS counterparts published 34%. The ccRank columns show the most impactful 5% of KCI authors receiving 47% of all citations and 5% (2,331) of WoS authors receiving 55% of citations. In other words, the top 5% of authors produce over one third of total journal papers and about half of all citations in LIS. The marked difference in top author output for LIS highlights the heightened significance of core authors for the discipline.
Author ranking distributions by productivity and impact
The productivity and impact distributions of international authors are much wider and longer than those of Korean authors. Although the general productivity level of Korean authors is higher than international authors as discussed in size comparisons (Section 4.1) and shown in Table 2, the 10 most productive WoS authors generated 2.6% (2,505) of all publications as opposed to 0.5% (617) by top 10 KCI authors. The top 10 most impactful KCI authors received 0.5% (3,984) of all citations in comparison to the top 10 WoS authors, who received 4.5% (65,819). The wider distribution spread of international authors over Korean authors can be seen in Figs. 5 and 6 as well.
4.4. Institution-level Analysis
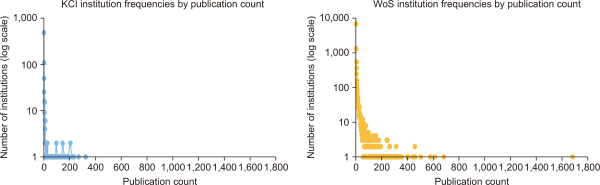
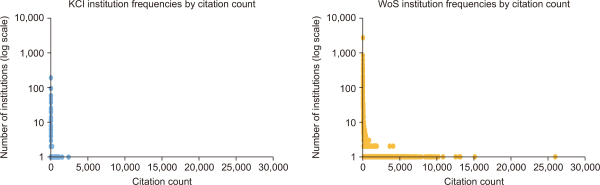
Productivity and impact distributions of institutions follow similar patterns observed at the author level. The skew is more extreme due to the heightened magnitude of frequencies generated from aggregating at the institution level, but Figs. 7 and 8 show clear patterns of Pareto distribution. Intensified skewness of institution-level distributions is highlighted in Table 3. 95% of institutions produced less than a third of total publications (27% in KCI and 30% in WoS) while the top 1% of institutions generated more publications than the 95% (38% KCI and 43% WoS). Citations received by 95% of institutions amounted to less than publication proportions at 22% for KCI and 21% for WoS, while the top 1% garnered 18% for KCI and 44% for WoS institutions.

Institution frequencies by publication count. KCI, Korea Citation Index; WoS, Web of Science.

Institution frequencies by citation count. KCI, Korea Citation Index; WoS, Web of Science.
Institution ranking distributions by productivity and impact
There are currently about 40 universities in Korea with LIS departments, but over 700 institution names were extracted from the affiliation information of first authors in the KCI data. The inordinate number of institutions, which is also true for WoS data, reflects the interdisciplinary nature of LIS research where authors from disciplines outside LIS publish in LIS journals. Despite the diversity of author disciplines reflected in institution counts, the most productive 5% (34) of KCI institutions were all Korean universities with LIS departments. The same was not true for WoS, whose top 5 percentile of productivity comprised 534 institutions. This indicates that LIS research is much more diverse and interdisciplinary at the international level than in Korea.
4.5. Journal-level Analysis7
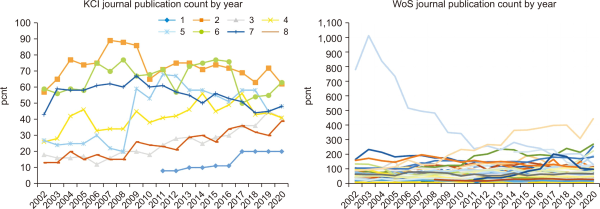
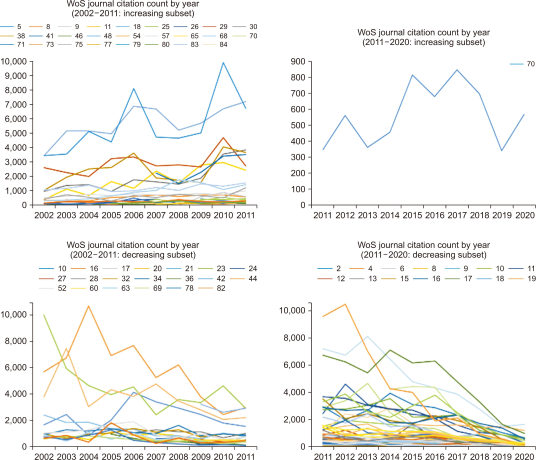
Fig. 9 shows publication counts of KCI and WLIS journals by year. KCI journals, shown on the left, exhibit two types of general patterns: steady increase over years (journals #1, #3, #4, #8), and a decreasing trend in later years after initial increases (#2, #5, #6, #7). Journal 1 is a relatively new journal published by a university research laboratory and the rest in the first group are journals specializing in bibliography and archival science. Other than journal 1, whose upward slope represents the maturing process of a new journal, the increasing publication counts may reflect growing popularity in the subject area of archival science and bibliography. The downward slope of journal 4 (Journal of Studies in Bibliography) at the tail end could be due to recent retirements of prolific scholars in the area.

Journal publication count by year. KCI, Korea Citation Index; WoS, Web of Science.
Journals in the second group are general LIS journals that comprise the main publication venues for the majority of LIS researchers in Korea. These journals went through an initial phase of growth but were not able to maintain the publication volume level in later years. Whether this is due to a cooling of LIS research activity in Korea or researchers finding other venues of publication is unclear. We suspect some of both may be true. Also, the reduction of publication counts in later years are mild enough to view them as stabilization after the peak period.
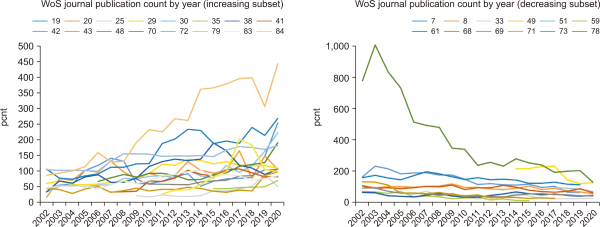
The WoS chart on the right of Fig. 9 conveys little information other than how a few journals show markedly different patterns from most journals, in contrast to KCI journals whose publication counts remain more or less stable and within a reasonable range. By examining WoS journal plots in small batches along with year to year differences in publication counts, we identified 16 journals with increasing publication counts and 12 journals with decreasing counts (Fig. 10). Publication counts of the remaining 57 journals were more or less stable over the years, though they were far from steady. Like author and institution patterns, international journals show far more variance than Korean journals, both in journal to journal and year to year differences.

Web of Science (WoS) journal publication count by year: decreasing and increasing subsets.
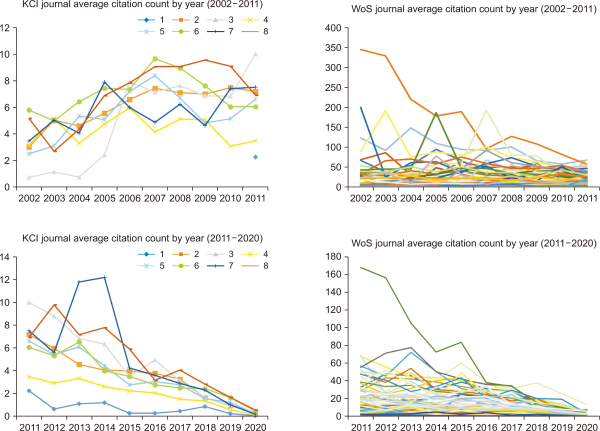
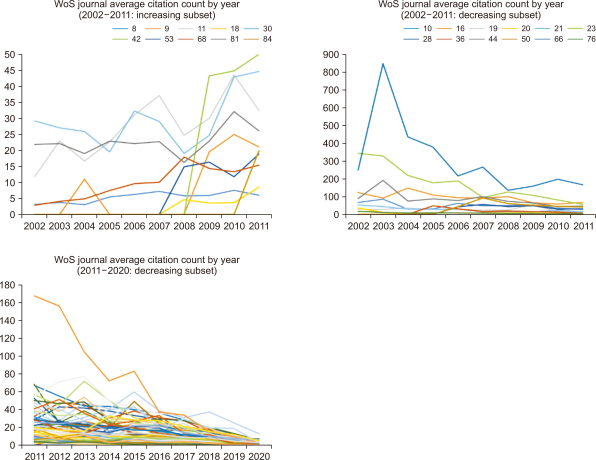
Average citation count, which essentially normalizes citation counts of journals with different publication counts, conveys a more accurate picture of journal impact over time. The average citation count chart of KCI journals in the first decade (upper left chart in Fig. 13) shows a tighter grouping than the citation count chart with a pronounced impact increase of journals 3 and 8, that specialize in archival science. Average citation counts of KCI journals for the second decade (lower left chart in Fig. 13), which tend to plot an earlier decline than citation count, show decrease in impact of KCI journals as early as 2012. By 2015, average citation counts of all KCI journals are in steady decline to shrink to a fraction of the starting values by 2020.

Journal average citation count by year. KCI, Korea Citation Index; WoS, Web of Science.
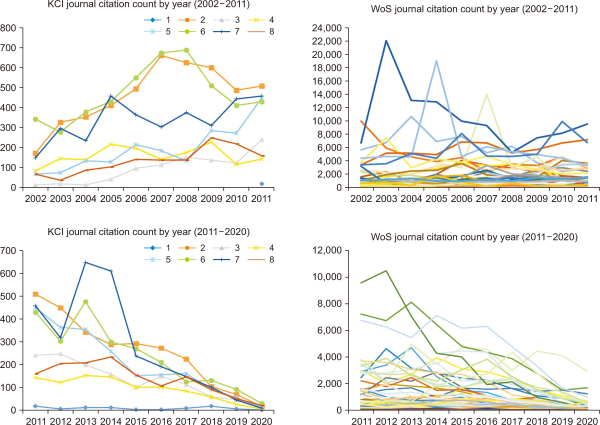
Citations to journals show a general pattern of increase in the first half of the study period followed by rapid decrease in the second half. Fig. 11 displays journal citation count charts in two time periods of 2002 to 2011 and 2011 to 2020 so as to accentuate the opposing patterns.8 Increasing citation counts to KCI journals in the first decade, as can be seen in the upper left chart of Fig. 11, correspond to increases in publication counts during that time period. Rapid citation decreases in the second time period except for brief spikes by two journals in 2013 (lower left chart in Fig. 11), even for the journals with increased publication counts, is a phenomenon that cannot be explained by citation and indexing lags (Yang et al., 2015, 2016).

Journal citation count by year. KCI, Korea Citation Index; WoS, Web of Science.
WoS journals also exhibit patterns of citation decline as early as 2012, although citation plots fluctuate towards decline rather than steadily like KCI journals (bottom right charts in Figs. 11 and 13). In Fig. 13, which shows WoS journal subsets with increasing citations in two time periods followed by those with decreasing citations, we can see only one journal with increasing citation counts in the second decade (the second chart from the left) and many journals with decreasing citations in the same time period (the chart on the far right). Average citation charts in Fig. 14 clarify the pattern further. There were 10 WoS journals with marked average citation count increases in the first decade (left chart in Fig. 14) but none in the second decade,9 while journals with decreasing average citation count went from 12 in the first decade to 69 in the second decade (middle and right charts in Fig. 14).10

Web of Science (WoS) journal citation count by year (decreasing and increasing subsets).

Web of Science (WoS) journal average citation count by year (decreasing and increasing subsets).
The fact that both KCI and WoS journals show a general trend of decreasing citations for the past decade is somewhat troublesome. Citation counts for recent publications will be underreported since seminal papers can continue to be cited for years. Citation lag alone, however, is unlikely to have caused a decade of general citation decline. A simple explanation for decreasing citations would be decline in research impact, but the simplest explanation may not be the best one in this case. Anecdotal evidence of spot-checking reference lists of a few journals revealed increased presence of citations that would be missed by KCI. For instance, recent KCI papers listed a list of references that ranged from WoS articles and other non-KCI journal papers to policy documents and project reports. Prior studies also found evidence of increased cross-discipline citations in recent years (Jeong, 2020; Lee, 2015), which could very well include references to conferences and international papers.
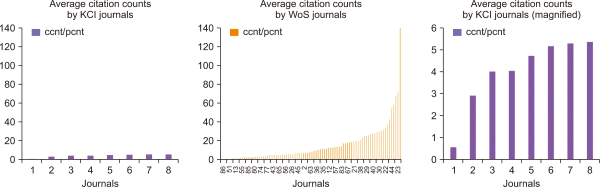
As LIS research became more diverse and cross-disciplinary in Korea, more citations from LIS papers reference publications outside the KCI domain, which would be a contributing factor for decline in citation counts shown in KCI journals. We suggest the similar may be true for WoS publications, though the effect of citations missed by WoS, whose coverage is much more comprehensive than KCI, would be much smaller. Fig. 15, which compares average citation counts of KCI and WoS journals, highlights the much higher impact of WoS journals in general. Not only do WoS journals receive more citations, but the impact differences among WoS journals are much more severe than those among KCI journals. The audience pool of WoS journals is much larger than KCI, so the higher impact of WoS journals seems only natural. The key takeaway here is that WoS journals vary widely while KCI journals are more or less comparable. In fact, about 8% of WoS journals receive the lion’s share (45%) of citations.11

Journal average citation counts. KCI, Korea Citation Index; WoS, Web of Science; pcnt, publication count; ccnt, citation count.
4.6. Keyword Analysis
As described in the data processing subsection of Methodology, the keyword field in the KCI database was inundated with data problems that we were not able to resolve thoroughly. Thus, we focused on analysis of the most popular and influential keywords that can describe the core research areas. After determining the popularity of keywords, which was estimated by ranking keywords by the number of articles they appeared in, and the impact (i.e., influence) of keywords, which was estimated by ranking them by the sum of citations those articles received, we selected the 20 most popular and 20 most influential keywords for each year and for the whole time period. Top keywords by year were then aggregated and sorted by the number of years they appear in to determine the sustained popularity and impact, the top 20 of which are listed in Tables 4 and 5.
Top 20 most popular and influential keywords by year in KCI
Top 20 most popular and influential keywords by year in WoS
Highlighted keywords in tables represents those that are both popular and influential, since they appeared most frequently (pcRank20 column) and were most cited (ccRank20 column) over the years. Library-related keywords, such as types of library and librarian, and archivology-related keywords, such as archival information service and records management, were most popular and influential for the past two decades in KLIS research (Table 4), while a more diverse set of information science-centric keywords, such as knowledge management, e-commerce, bibliometrics, and information systems, constituted the most popular and influential topic areas in international LIS research.
Large numbers and question marks12 in delta columns (ΔcR and ΔpR), which denote the distance between popularity and impact of a keyword, indicate keywords whose popularity and influence do not coincide. For instance, Korean Decimal Classification and ontology in KCI and libraries and information literacy in WoS were popular keywords that did not get cited much, while topic modeling in KCI and technology adoption in WoS were highly cited keywords that were not wildly popular. Another way to view the popularity-impact differential is that keywords in the first group (popular but not influential) represent common research topics that attract relatively low peer interests, and keywords in the second group (influential but not popular) represent topic areas of a relatively few researchers that garner high interest. The latter can also reflect interest from outside the study discipline, as is the case with topic modeling that received many citations from the computer science field.
Keywords in bold indicate common topics in Korean and international LIS research. Though there are a few overlapping keywords in popularity (i.e., academic library/university library, library/libraries, information literacy, digital library) and in impact (i.e., citation analysis), none are popular and influential keywords in both KCI and WoS. Another difference between KCI and WoS keywords can be gleaned from total number of unique keywords in top 20 ranks. Out of the potential 380 unique keywords,13 there were 148 pcRank and 245 ccRank keywords in KCI and 88 pcRank and 208 ccRank keywords in WoS. We can surmise two things from these numbers: First, popular topics in international LIS research are sustained for longer periods than are popular LIS topics in Korea (88 vs. 148). Second, popularity of topics is more consistent over time than impact of topics (148 vs. 245, 88 vs. 208).14
Tables 6 and 7 list the top 20 most popular and influential keywords for the whole study period. The difference between top keywords by year and top keywords overall is akin to macro- and micro-average performances in multiclass classification. The former awards equal importance to keyword rankings of each year while the latter considers only the magnitude of keyword frequencies or citations. In other words, Tables 4 and 5 list 20 keywords that were consistently popular or influential over the years, while Tables 6 and 7 identify 20 keywords that appeared most frequently or were cited most regardless of their sustained importance.
Top 20 most popular and influential keywords in KCI
Top 20 most popular and influential keywords in WoS
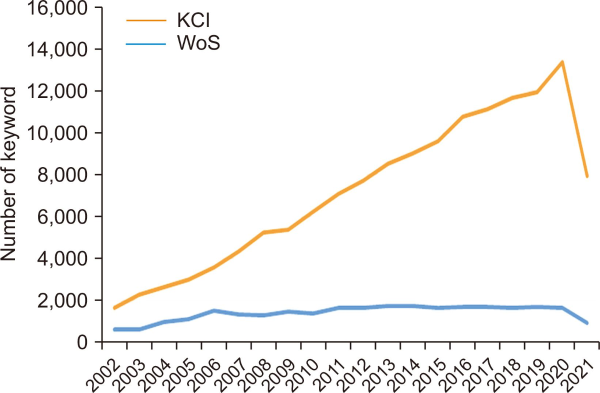
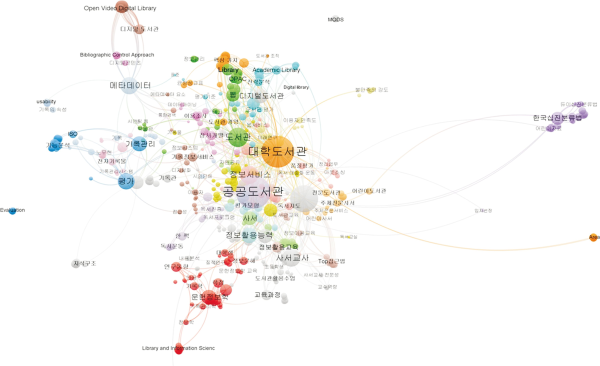
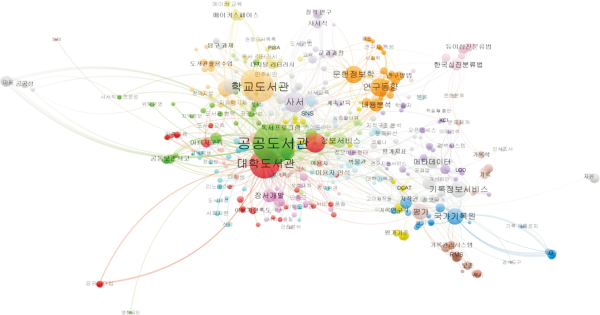
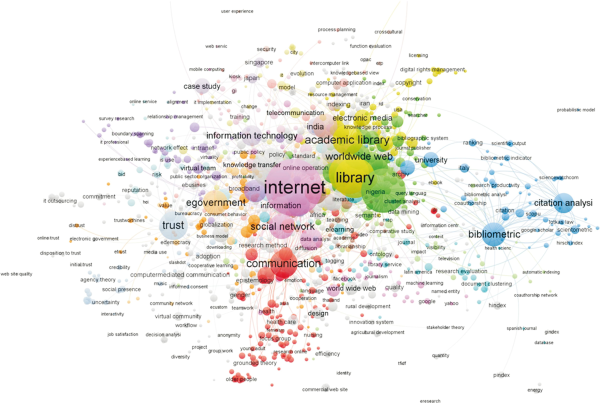
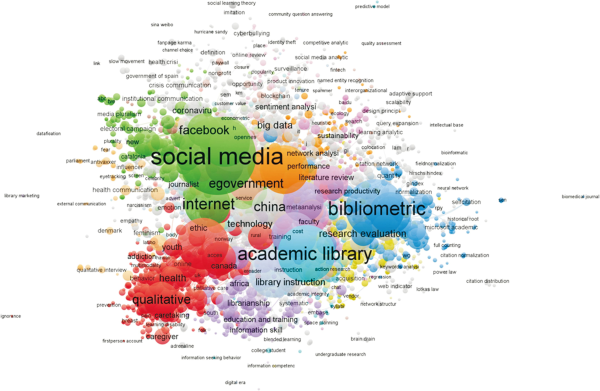
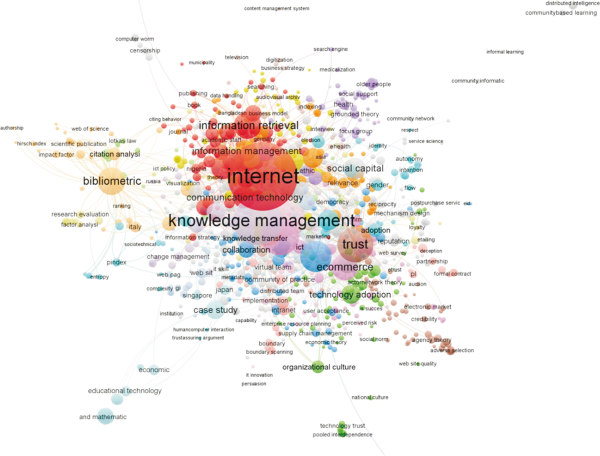
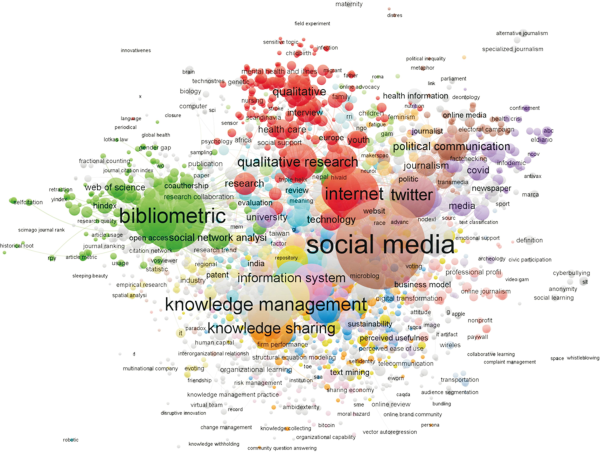
There is much overlap between the two sets of tables. Of the keywords unique to each set, indicated by italicized letters, end of life care and social cognitive theory have notable differences between by-year and overall rankings, which suggests concentrated spurts of high impact for these topics. Another interesting pattern difference between macro- and micro-ranking keyword analysis occurs with popular and influential keywords. When we examine the highlighted keywords with asterisks, which make up the popular and influential keywords unique to macro- and micro-ranking lists, we can see two additional keywords of bibliotherapy and National Archives of Korea in the KCI overall rankings (Table 6) along with WoS keywords of e-commerce, citation analysis, and information systems in by-year rankings (Table 5) and trust in overall rankings (Table 7). Bibliotherapy and National Archives of Korea did not appear in ccRank20 by year but made the ccRank20 overall list because they received high bursts of citations in some of the years that they were highly published (3 of 5 and 3 of 7, respectively). Trust, a highly cited WoS keyword not in pcRank20 by year, made the pcRank20 overall list due to a high count of publications in 6 of 14 years that it was highly cited. We can regard e-commerce, citation analysis, and information systems in a similar fashion. The number of keywords by year chart (Fig. 16) reflects continuing diversification of topics in international research in comparison to more or less static research topic areas in Korea. The topic diversity of international LIS research is better represented in cluster visualizations of WoS keywords (Figs. 21Fig. 22Fig. 23 through 24), which include many more large keyword clusters than those shown in KCI keyword visualizations (Figs. 17Fig. 18Fig. 19 to 20). KCI keywords in tables were translated after analysis, but keyword clusters remain in Korean since it would have required translation of keywords in all 6,572 KCI records. Suffice it to say, keywords clusters resemble keyword tables in content. The main KCI topic areas by popularity are large library-related clusters towards the center (Figs. 17 and 18), archivology-related clusters (upper left in Fig. 17 and lower right in Fig. 18), LIS clusters (lower left in Fig. 17 and left of the northeast quadrant in Fig. 18), and library classification clusters (far right in Fig. 17 and upper right in Fig. 18).

Number of keywords by year: KCI vs. WoS. KCI, Korea Citation Index; WoS, Web of Science.

Korea Citation Index keyword clusters by publication count (2002-2011).

Korea Citation Index keyword clusters by publication count (2012-2021).

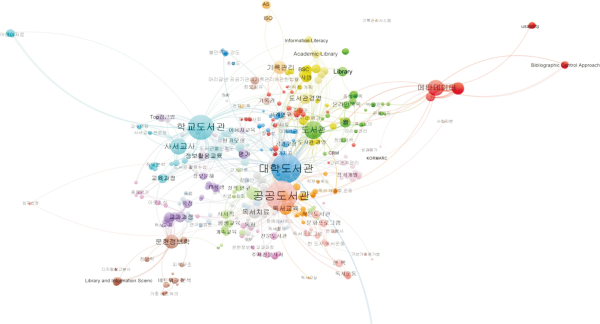
Korea Citation Index keyword clusters by citation count (2002-2011).

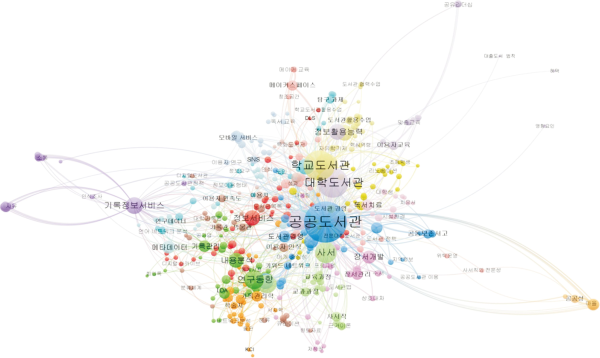
Korea Citation Index keyword clusters by citation count (2012-2021).

Web of Science keyword clusters by publication count (2002-2011).

Web of Science keyword clusters by publication count (2012-2021).

Web of Science keyword clusters by citation count (2002-2011).

Web of Science keyword clusters by citation count (2012-2021).
Cluster visualizations reveal topic relationships that were not apparent in the keyword rankings of tables. The archivology cluster, for instance, is near the metadata cluster, and the general topic cluster of LIS is in close proximity of the research trend topic cluster. In addition, shifts in topic focus can be observed in cluster formations of two time periods, where the partial focus of the archivology cluster shifted from management of archives in the first decade (Fig. 17) to archival information service in the second decade (Fig. 18). Among library-related clusters, information literacy, which was one of the key sub-clusters in the first decade was replaced by information service in the second decade. Keyword clusters in the second decade appear to be denser, which suggests tightening of topic coherence, and contain slightly more clusters of size, which likely reflects diversification of topic areas in recent years.
KCI keyword clusters by citation count (Figs. 19 and 20) resemble those by publication count. The most prominent difference between popular and influential topics in the first decade is the emergence of the school library cluster with teacher librarian and school curriculum sub-clusters (blue clusters northwest of center in Fig. 19) among library clusters, which was unnoticeable in popular keyword visualization (Fig. 17). Network analysis, a new sub-cluster of LIS clusters in Fig. 19, is another topic of high impact but less than stellar popularity in the first decade. The topic of the school library cluster apparently gained in popularity since it appears as the second largest cluster among keyword clusters by publication count for the second decade (north of center in Fig. 18). Network analysis, on the other hand, did not emerge among popular keyword clusters in the second decade. Instead, content analysis became a new sub-cluster of LIS in Fig. 18. National Archive of Korea, a new popular topic cluster in the second decade (lower right corner of Fig. 18) does not appear in clusters by citation count, which points to the topic’s popularity that did not enjoy a comparable level of impact. Among the new topics that emerged in the second decade, LDA, curation, and mobile service are some of the influential topics that were not as popular (Fig. 20), while makerspace and SNS were both popular and influential topics.
As previously mentioned, WoS keyword clusters are much denser and diverse than KCI clusters. In addition, the popular and influential keyword clusters of WoS are quite different from each other, unlike KCI clusters, which are quite similar. The largest cluster in both popular and influential keyword clusters of WoS in the first decade is internet, whose close neighbors of significance are library, communication, social network, e-government, and information technology in popular keyword clusters (Fig. 21) and knowledge management, communication technology, information management, information retrieval, and social capital in influential keyword clusters (Fig. 23). In the second decade, the largest cluster is social media, with neighboring clusters of internet, e-government, Facebook, and big data in popular keyword clusters (Fig. 22) and Twitter, technology, internet, and information system in influential keyword clusters (Fig. 24). Other than the shift from internet to social media, clusters in the second decade are tighter and more prominent. For instance, bibliometrics grew from a mid-size cluster in the periphery in the first decade to the second largest cluster in both popular and influential keyword clusters. Qualitative research is a new topic cluster seen in the second decade with both popularity and impact (Figs. 22 and 24).
One limitation of keyword analysis based on author-assigned keywords lies in the brevity of coverage. Authors must choose a handful of keywords that can best represent their articles, which can often include a broad term (e.g., library and information science) or miss some aspects of their research. Topic modeling using abstracts may produce a better set of research topics, though terms and phrases not germane to research content but typical of abstracts in general may muddy the waters. We did conduct topic modeling analysis of abstracts using LDA and BERTopic, the results of which are to be published elsewhere. In brief, preliminary results of topic modeling were somewhat similar to those presented here but revealed different aspects of topic trends.
5. DISCUSSION
One of the challenges of comparing research trends between different countries is dealing with size differences. The publication and citation count of a country represent the research prowess (i.e., productivity and impact) of the country as a whole. Like the gross national product, larger countries will have more publications and citations since larger countries tend to have larger populations (i.e., more researchers) than smaller countries. For the research productivity and impact of an author, institution, or journal, however, the publication and citation counts, which are influenced by the population size, should be normalized by the unit of analysis. For instance, the author productivity of a domain (e.g., Korea) should be estimated by the number of publications divided by the number of authors in that domain. The journal impact factor normalizes in a similar manner by dividing the number of citations by the number of articles published in the journal for a 2-year period. Accordingly, we need to take into consideration size differences when comparatively analyzing the publication data of KCI and WoS in order to arrive at appropriate interpretations.
At the country level, WoS (i.e., international), which has 27 times as many as LIS authors, 14 times as many LIS institutions, and 11 times as many journals as KCI (i.e., Korea), contained 14 times as many publications and 47 times as many citations as KCI for the study period of 2002 to 2021. At face value, this suggests that the productivity and impact of LIS research in Korea account for only a fraction of the world at large. To take the size difference into consideration in a simplistic manner, we may estimate the size of the WoS population by 1 billion in developed countries15 and KCI population by 51.3 million in Korea16 to arrive at WoS size being 20 times that of KCI. This approximates the 14 to 1 ratio of WoS to KCI publication count but falls much below the 47 to 1 citation ratio, thus indicating a marked difference in citation patterns between Korean and international LIS research.
When we normalize the publication count at the author level with the number of authors, rather than using the estimates based on general population, we see that KLIS authors are twice as productive as international authors on average (p/a column in Table 1). The impact, however, measured in terms of average citation counts per author, shows an opposite pattern where WoS numbers are 1.7 times that of KCI numbers. The examination of publication and citation count distributions over authors revealed a pattern of high skewness for both KLIS and WLIS authors, where top researchers account for the majority of publications and citation counts. The skew is much more pronounced for WLIS citations, which likely contributed to the productivity and impact differential. In other words, there are a number of superstars with exceedingly high impact among WLIS authors, which does not seem to be the case for the KLIS authors.
The higher average citation count per author may not necessarily be due to the innate quality of research in general. There are other factors to consider, such as the bigger pool of publications and citations, a larger author population, and so on. The single most influential factor that affects the average citation count is the citation to publication ratio, which is largely determined by the average number of references per paper for a given domain and peripherally by the degree of citations from outside that domain. WLIS with 15.5 citations per paper means that WLIS authors can expect on average over three times the citation per publication of KLIS authors, who received 4.5 citations per paper. The average citations per WLIS author is a little under twice that of KLIS authors (30.7 WLIS vs 17.3 KLIS) since KLIS authors are twice as productive on average as WLIS authors (3.9 KLIS vs 1.9 WLIS publications per author). One interpretation of this finding is to say that KLIS authors publish more papers with less impact than WLIS papers. Another interpretation is to say that WLIS authors get cited more due to the bigger citation pool. Regardless of which interpretation is true, two facts remain irrefutable: WLIS authors get cited more than KLIS authors on average and there exists a much larger variance in research impact of authors in WLIS than in KLIS. The former is likely due to the fact that WLIS authors tend to cite more than KLIS authors, while the latter reflects the presence of international superstar researchers that lead the LIS field.
The analysis by institution revealed similar trends shown in author-level analysis except that the degree of skew appeared much more pronounced. While KLIS institutions showed comparable levels of productivity and impact, WLIS institutions showed the lion’s share of total productivity and impact concentrated in a fraction of top institutions.
The analysis by journal showed declining citation counts in both KLIS and WLIS journals in the last decade, although this decline seemed more severe in KLIS. Citation lag alone cannot adequately explain the citation decline that began as early as 2012. Based on the data that shows a recent infusion of international authors in KLIS journals, and prior studies that suggest KLIS authors publishing more in international journals in recent years, along with the heightened impact of productivity-driven university standards of research performance evaluation in Korea, we conjecture that KLIS authors of today still consider KLIS journals as publication venues but may be looking towards international journals for articles to cite. As was the case with institutions and to some degree authors, WoS journals show a large variance in “quality” (i.e., skew) while KLIS journals are more or less comparable.
The level of co-authorship, which reflects research collaboration, also showed a marked difference between KLIS and WLIS. There is the general trend of increasing collaboration in LIS research, but single-author papers still account for about 40% of KLIS publications in comparison to 20% of WLIS publications. For papers with multiple authors, 2-author papers make up the majority (70%) in KLIS while making up less than one third (27%) of multi-author papers in WLIS. The impact of collaboration has increased over the years as well. The citation ratio of 2-author papers in KLIS increased for the study period, while WLIS citations to 2-author papers decreased. This reflects the importance of 2-author papers in KLIS and the relative insignificance of its counterpart in WLIS. In WLIS, collaborations with five or more authors showed the highest increase in citations over the years. These WLIS patterns suggest that small collaboration groups of two to three people, that were popular and impactful in early years, have given way to larger collaboration groups, which may reflect the multi-disciplinary and/or increasingly complex nature of modern LIS research on the world stage.
Last but not least, keyword analysis showed a much more diverse topic area in WLIS than in KLIS. WLIS keywords also exhibited less correlation between popularity and impact than KLIS keywords as evidenced by larger KCI numbers of most popular (i.e., frequently appearing) and impactful (i.e., frequently cited) keywords and the dissimilarity of popular and impactful WLIS keyword clusters. Keyword analysis over time showed continuing diversification of topics in international LIS research in comparison to a relatively static topic pool of KLIS research.
This study conducted a comparative analysis of international and domestic LIS research to discover key differences in collaboration and topic trends as well as publication and citation patterns. The study also presented an approach to analyzing research activities of domains that have vast differences in size. Furthermore, the study presented a multi-faceted analysis of data in order to provide a comprehensive assessment that can lead to better understanding and interpretation.
1A comprehensive list of library and information science literature in Korea that analyzes publication pattern is reviewed in the study by Yang and Lee (2012).
2 https://jcr.clarivate.com/jcr/browse-journals
3 https://www.kci.go.kr/kciportal/ci/clasSearch/ciSereClasList.kci
4 https://en.wikipedia.org/wiki/List_of_Korean_given_names
6The KCI portion of Fig. 2 is charted to 2020 only since there were no citations to KCI papers published in 2021 in the KCI database.
7Since journal-level analysis uses raw frequencies instead of percentages of total frequencies, year 2021 with only 6 months of data is excluded to avoid the misleading appearance of a downward slope.
8Time periods are overlapped in the connecting year (i.e., 2011) to provide a reference point for the starting year (i.e., 2012) of the second period.
9The journal with increasing citations in the second decade (second chart in Fig. 12) also had increasing publication counts (from 87 in 2012 to 191 in 2020).
1063 journals in the first decade and 16 journals in the second decade showed fluctuating citations but no clear patterns towards increase or decrease.
11Since there are only so many issues per year and so many articles per issue a typical journal can publish, a majority of journals publish a comparable number of articles.
12A question mark indicates that the keyword did not occur in the corresponding ranking (e.g., ccRank20 for pcRank20 keyword) in any year.
13Excluding 2021, 20 keywords per year for 19 years can amount to 380 keywords if all the keywords appear only once.
14The smaller count of unique keywords over years indicates more consistency in topics.
15United Nations Conference on Trade and Development ( https://unctadstat.unctad.org/wds/TableViewer/tableView.aspx)
16Worldometer ( https://www.worldometers.info/world-population/south-korea-population/)
REFERENCES
, (2011) Analysis of the trends in the field studies of library and information science in Korea Journal of Korean Library and Information Science Society, 42(2), 171-191 https://www.koreascience.or.kr/article/JAKO201123457285970.pdf.
(2020) Journal citation network analysis of library and information science field in Korea Journal of the Korean Society for Library and Information Science, 54(4), 221-238 https://doi.org/10.4275/KSLIS.2020.54.4.221.
, , (2012) A comparative analysis of faculty evaluation systems of national universities in Korea Journal of Korean Teacher Education, 29(1), 143-165 http://doi.org/10.24211/tjkte.2012.29.1.143.
, (2017) A method for same author name disambiguation in domestic academic papers Journal of the Korean Biblia Society for library and Information Science, 28(4), 301-319 https://doi.org/10.14699/kbiblia.2017.28.4.301.
(2010) Trends in library and information science research in Korea: Focused on master's theses and doctoral dissertations from 2001 to 2010 Journal of Korean Library and Information Science Society, 41(4), 333-353 https://www.koreascience.or.kr/article/JAKO201013351026359.do.
, , (2021) Comparison of research performance between domestic and international library and information science scholars Journal of the Korean Society for Library and Information Science, 55(1), 365-392 https://doi.org/10.4275/KSLIS.2021.55.1.365.