Introduction
Species distribution models (SDMs) predict the potential habitat of species by estimating the relationship between species records and the environmental and/or spatial properties (Alexandre da Silva et al., 2019). The prediction of spatiotemporal habitat range provides information on the habitat environment. It can be used for the restoration of appropriate habitats to target species or an early diagnosis and response of species introduction. Riaz et al. (2020) used SDMs to assess the success of reintroductions of freshwater fish in Germany. Especially, modeling is necessary for the invasive species which needs a prediction of the influx and rapid response. It is used for not only estimating the prediction of distribution probability but identifying the effect of environmental factors including climate, water chemistry, and species to species association on invasion probability (Byers et al., 2013; Gallardo et al., 2020; Tikhonov et al., 2017).
Invasive fish species are the major driver of the degradation s of freshwater ecosystems and biodiversity. In Korea, Largemouth bass (Micropterus salmoides) and Bluegill (Lepomis macrochirus) are representative invasive species in the freshwater environment. For resource creation, M. salmoides was introduced from North America, and L. macrochirus was brought from Japan in 1969 for creating resources (Information of Korean Alien Species, 2021). Because of rapid population growth and high predation pressure, it was widely distributed to the freshwater across the country and became a top predator species influencing the diversity of endemic fish species (Byon and Jeon, 1997; Lee et al., 2009). Lee et al. (2020) evaluated the influence of invasive fish species on the fish community and showed that an increase of invasive species was negatively correlated with the total number of fish species and individuals. For these reasons, studies have been continuously conducted to diagnose the introduction and proliferation of invasive species and evaluation of their habitat characteristics (Kim et al., 2013; Kim & Lee, 2018; Son & Byun, 2019). There were studies with a wide range of target areas for identifying the distribution of invasive species (Mamun et al., 2018), but the number of study sites was relatively small compared to the area. Particularly for the aquatic organism, it is necessary to evaluate the possibility of habitat in water environments except for land where it is impossible to habitat. Moreover, the distribution pattern that occurred with the seasonal water quality variation is rarely considered in the modeling.
Environmental DNA (eDNA) is the one of emerging tools for efficient biological monitoring, complementing the traditional survey. eDNA is the genetic materials released from organisms in the environmental samples including water, soil, or air. The availability of eDNA survey method has been validated with studies proceeded with various taxon in the terrestrial ecosystem and aquatic ecosystem (Griffiths et al., 2020; Hunter et al., 2015; Ushio et al., 2018). Several studies proved that the biomass and eDNA have a positive correlation (Di Muri et al., 2020) and the number of eDNA reads can be used for community structure analysis (Olds et al., 2016; Zhang et al., 2019). In addition, with the brief sampling process, eDNA can get the bulk of data regardless of place and seasons. Based on studies, the result of eDNA is judged to be enough to provide reliable species occurrence information. Muha et al. (2017) used the eDNA survey result as occurrence data of invaders and recommended eDNA methodology to retrieve species distributional data for SDMs. Also, Da Silva Neto et al. (2020) suggested that eDNA survey results could be applied for fitting the model. However, there is still a continuous need for research to apply and validate eDNA methodologies in species distribution modeling.
Among the various SDMs, the Maximum Entropy (MaxEnt) software was used for building the model applied eDNA results in this study. It has been used widely based on advantages that cover the limitation of systematic biological survey data and have competitiveness with the highest predictive performance (Elith et al., 2011). Combining eDNA results and MaxEnt, the objectives of this study were 1) to identify potential habitat and the seasonal habitat range of bluegill and largemouth bass, and 2) environmental factors that affect the habitat of them in the urban stream.
Materials|Methods
Study site and species descriptions
Thirty-one sites of Anyang mainstream and 6 tributaries were selected as a study area (Fig. 1). Anyang stream is the first tributary of Han river, rising in the city of Uiwang, Gyeonggi-do (37°21′-37°33′ N, 126°49′-127°00′ E). The catchment of the Anyang stream includes Anyang mainstream, 10 tributaries, and 21 small streams. The total area of the catchment is 286 km2 and streams in the catchment are 73.14 km long. As a representative city stream, the restoration project was carried out from 2000 to 2010, and biodiversity and water quality were improved. The average precipitation in Anyang is 193 mm in summer (July-August) and 83.5 in autumn (October-November).
M. salmoides shows dark blue on the back, yellow on the belly, and has long blue-brown stripes in the center of the body. Its body length is 25 to 60 centimeters. The head and body are flat on the side, but the body is a long fuselage. The head is large, and the eyes are relatively small, and the snout is long and pointed. L. macrochirus features both the lateralized head and body, the high body height, and the short body length about 15 to 20 centimeters. Both males and females have dark blue spots on the slightly protruding rear end of the gill lid. The body has long brownish sides with eight to nine lines. After its introduction, it rapidly spread to rivers around dams and reservoirs. Both species are known to have an ecological advantage in predation relationships and protection of spawning fields, as well as competing with small native fish species. Therefore, it was designated as an invasive disturbance species and managed by the Korea Ministry of Environment in 1998 (Information of Korean Alien Species, 2021). According to Anyang city fish monitoring, M. salmoides and L. macrochirus have been constantly identified in the Anyang stream from 2008 and 2013, respectively.
Species occurrence records: eDNA sampling and analysis
The eDNA sampling was conducted from 16-17 July and 24 October in 2020 and a total of 62 samples were collected. The surface water was collected by a 30 mL syringe and about 240 mL water was filtered through sterivex filters (pore size of 0.45 µm, Merck, Darmstadt, Germany). An independent set of sterilized materials was used to prevent cross-contamination between sites. After sampling, the filters were placed in a zipper bag and stored in an icebox before being transported to the laboratory and frozen until DNA extraction at −20°C. The DNA from the filters was extracted using the DNeasy Blood and Tissue Kits (QIAGEN, Hilden, Germany). The extracted DNA was measured using a Nanodrop 2000c (Thermo Fisher Scientific, Waltham, MA, USA) and kept at −20°C.
Polymerase chain reaction (PCR) was carried out in two stages. The first PCR amplified mitochondrial 12S region using the universal Mi-fish primer set (Miya et al., 2015). The first PCR consisted of 35 cycles with a 12 µL reaction volume and 6 µL of KAPA HiFi ready mix (KAPA Biosystems Inc., Wilmington, MA, USA). The first thermal cycles of this step were as follows: Denaturation at 98°C for 20 seconds, annealing at 65°C for 15 seconds, extension at 72°C for 15 seconds, and a final extension at 72°C for 5 minutes. The PCR products were observed on a 1% agarose gel electrophoresis. Amplifications were diluted to 1/10 and employed as a second PCR template. The second PCR was run for 12 cycles under the identical conditions as the first PCR, with a total reaction volume of 12 µL including the P5, P7 index of the unique dual index identifier. Through a pooling process, the amplified product was refined at the same rate, followed by MiSeq sequencing (300PE, read length 600 bp). From FASTAQ data of Next Generation Sequencing, the Mi-fish pipeline ( http://mitofish.aori.u-tokyo.ac.jp/mifish) was used to create a list of species found by eDNA survey. The Mi-Fish Pipeline analysis covered results from data quality control with FASTAQC to the phylogenetic analysis (Sato et al., 2018). The site which had M. salmoides and L. macrochirus was sorted as presence data for each model.
Measurement of background environmental variables
To evaluate the effect of physiochemical properties of the stream on invasive fish distribution in Anyang stream, the 7 environmental variables were used as background data (Appendix 1). Basic water quality of pH, temperature (Temp, °C), dissolved oxygen (DO, mg L−1), and conductivity (Cond, µS L−1) was measured at the same time as sampling by YSI Pro Plus multiparameter (YSI Incorporated, Yellow Springs, OH, USA). A digital elevation model (DEM, m) was used for analyzing the elevation of study sites and slopes. The stream order which represents the physical characteristic such as stream size was classified by the Horton-Strahler method (Horton, 1945; Strahler, 1957).
Species distribution modeling
Models built by the MaxEnt algorithm (Phillips et al., 2006) is SDM which uses the presence-only data (version 3.4.4). Fifty replicates of each model were generated using bootstrapping for complementing a small sample size (Phillips, 2017), drawing a final model with the average of replicates. The jackknife test was used to assess each environmental variable's contribution to the formation of models. It was used to determine the importance and the relative importance of the individual environmental variables (Yang et al., 2013). The value of area under curve (AUC) indicates the performance of the model and the higher the value, the better prediction of the model. Generally, the value over 0.8 is evaluated as a good model while under 0.7 is poor (Li et al., 2020).
Results
Occurrence data of eDNA survey
The result of eDNA survey clarified that M. salmoides was detected at 13 sites (S4, S5, S7, S11, S12, S13, S14, S15, S19, S20, S21, S29, S30) in July and 16 sites (S3, S4, S5, S7, S9, S10, S15, S18, S19, S20, S21, S23, S25, S29, S30, S31) in October. L. macrochirus was detected at 5 sites (S18, S19, S20, S29, S30) and 11 sites (S10, S11, S12, S13, S18, S19, S20, S21, S23, S27, S29) in July and October, respectively (Fig. 2). Both species have been identified more in autumn than in summer. Moreover, the total number of eDNA reads was also increased during the autumn season. In July and October, respectively, 10,120 and 42,015 eDNA reads of M. salmoides were obtained. Likewise, the number of eDNA reads of L. macrochirus was increased from 782 reads to 31,987 reads. Through these results, it can be estimated that the habitat range of invasive fish expands, and the number of populations increases in autumn.
Maximum entropy modeling of M. salmoides and L. macrochirus
From the fifty model runs, the average AUC of the model was 0.805, 0,841, 0.892, and 0.793 for M. salmoides and L. macrochirus, in July and October, respectively (Fig. 3). For M. salmoides, the prediction value was 0.50±0.21 in July and it decreased to 0.34±0.12 in October. Conversely, the prediction value of L. macrochirus was increased from 0.21±0.26 in July to 0.48±0.13 in October (Fig. 4). The prediction value by streams was varied according to species and seasons (Fig. 5). The prediction value of M. salmoides was increased in October than July except for Anyang stream, the largest stream of the study area. L. macrochirus showed an increase of the prediction value in October except for Mokgam stream and Hakui stream. Contrary to the distribution results of the predictions, both species extended their habitation area in October than July. The study area having over the 0.05 prediction value was 12,110,675 m2 (89.1%) for M. salmoides in July and the area was extended to 13,625,525 m2 (99.3%) in October. Similarly, the area of L. macrochirus was increased from 10,407,350 m2 (76.6%) in July to 13,724,225 m2 (100%) in October. In short, the Anyang stream network was evaluated to be vulnerable in October than July.
Evaluating the importance of environmental variables
All geographical variables and water quality variables were selected as significant contributors to the distribution model of invasive fish (Table 1). However, the percentage of contributing factors and the permutation importance varied between target species and survey season. In July, pH, DEM, stream order and DO contribute more than 10% to M. salmoides distribution while L. macrochirus had only two factors, stream order and slope, that contributed more than 10%. Especially, the distribution of L. macrochirus is considerably affected by stream order (79.6%). In October, DO, Cond, Temp, and slope showed a high contribution percentage to M. salmoides and stream order, Temp, DEM, Cond showed high contribution percentage to L. macrochirus.
Jackknife of regularized training gain also showed the relative importance of environmental variables by season and species (Fig. 6). Cond and Temp had nearly no gain for M. salmoides in July, indicating that those factors were not beneficial for predicting the distribution of M. salmoides in July. On the contrary, in October, Stream order, DEM, Slope and Temp showed the lowest gain in the model. The training gain showed decreasing considerably when the stream order was excluded (the lighter blue bar), so it means that stream order affected a substantial impact to building a model of L. macrochirus in July. Except Temp, the water quality variables had no training gain for the model of L. macrochirus in October.
Discussion
MaxEnt prediction suggested that the occurrence data from eDNA survey could be suitable for distribution modeling of invasive species. Despite the dense distribution of study sites within the same stream network, there was a difference in habitat predictions according to season, species, and streams. The Anyang stream network seemed to be suitable for invasive species to inhabit, and it was judged that it was more likely to be dominated by invasive species in October than in July. Also, the number of eDNA reads was increased in October, amplifying about 4.2 times and 40.9 times for M. salmoides and L. macrochirus respectively. Moreover, models in this study showed environmental factors which affect habitation similar to the literature mentioned that habitat suitability index of M. salmoides and L. macrochirus (Kang & Kim, 2016; Son & Byun, 2019; Stuber et al., 1982a; 1982b).
M. salmoides is known to prefer 24-30°C for growth and 20-21°C for reproduction (Stuber et al., 1982a). Also, it has been confirmed that it forms a habitat at relatively high water temperatures in the winter and low water temperatures in the summer (Son & Byun, 2019). Similarly, this study showed that the prediction value of M. salmoides was affected by temperature (Table 1, Fig. 6). In addition, the result showed that it is more suitable to live downstream than upstream of the study area as it prefers lacustrine area, or stream with slow velocity. Kang and Kim (2016) revealed that invasive species are impossible to go upstream above a certain water velocity. The cumulative precipitation value for the two weeks prior to the sampling date was 53.8 mm in summer and 0 mm in autumn. Therefore, the difference in models with different seasons estimated to be due to increased precipitation in summer, resulting in faster flow rates and reduced habitat suitability. DO levels above 8 mg L−1 are known to be positive for M. salmoides, but the negative correlation that occurred in these results is not due to the effects of DO (Stuber et al., 1982a), but to other geographical properties, including low stream order and high gradient. Habitat conditions of L. macrochirus are very slow (0.1-0.3 m sec−1) or stagnant waters. The proper water temperature of L. macrochirus is known as near 27-30°C and it moves to 2-3 m deep water for warm temperature in winter (Stuber et al., 1982b), whereas it prefers a littoral area with 1-2 m water depth in general. Thus, the results of this study which described the increase in the distribution of L. macrochirus in autumn when the water temperature drops are estimated to require further research through the validation with traditional surveys or eDNA experiments in controlled conditions (Fig. 4). In addition, as with M. salmoides, reduced precipitation in the fall may have affected the water velocity reduction, affecting spread. The stream order is a factor that determines the physical characteristics of streams, and generally, as the number of stream order increases, the size of streams increases, the flow rate slows down, and streams have the smaller riverbed substrate (Harrel et al., 1967; Vander Vorste et al., 2017; Vannote et al., 1980). In the water system of Anyang stream, the second order stream has been confirmed to have the most suitable characteristics for L. macrochirus. However, the SDM has limitations and assumptions. It is affected by the quality of occurrence data and background environmental factors (Da Silva Neto et al., 2020; Mamun et al., 2018). This study also showed unexpected results that pH with little variation by space contributed a lot to the model and the training gain values between seasons differed significantly in the jackknife graph. Thus, further research with precise measurement of physiochemical properties is necessary. Nevertheless, in the case of biological surveys, the use of eDNA is thought to complement traditional surveys, helping to conduct efficient and precise surveys. Muha et al. (2017) described that the result of eDNA survey with higher detectability and accuracy has high potential to overcome the limitation of conventional surveys and improve species distributional data for SDMs. Further, it can be used for not only the distribution of invasive species but detection and distribution prediction for endangered species with low density.
The SDM is a useful tool to predict the future distribution and establish the preemptive response. This study demonstrated that occurrence data obtained from eDNA survey could be suitable for distribution modeling within the same stream network with fine-scale. The prediction of Anyang stream network was different by species, season, and streams. The potential distribution area of M. salmoides and L. macrochirus was increased in October than July. Also, it could clarify the environmental factors which have an effect on the habitat of invasive species. Additional studies of physiochemical background data are needed for precise modeling of invasive species, but we identified the potential of eDNA methodology as a way to obtain species data effectively. Furthermore, it can be effectively applied not only to invasive species but also to modeling species distribution of endangered species with low habitat density.
Acknowledgments
This work was conducted with the support of the Korea Environment Industry & Technology Institute (KEITI) through its Urban Ecological Health Promotion Technology Development Project and funded by the Korea Ministry of Environment (MOE) (2019002760001). This work is financially supported by Korea Ministry of Land, Infrastructure and Transport (MOLIT) as 「Innovative Talent Education Program for Smart City」.
References
Information of Korean Alien Species (2021, Retrieved December 30, 2021) Micropterus salmoides from https://kias.nie.re.kr/home/for/for02002v.do?clsSno=20381&searchClsGbn=eco
(2017, Retrieved December 30, 2021) A Brief Tutorial on Maxent from http://biodiversityinformatics.amnh.org/open_ source/maxent/
Figures and Table
Fig. 1
Study sites (red dots) in the Anyang mainstream and its tributaries (Mokgam, Okgil, Sammak, Samsung, Suam, and Hakui streams). Basic water quality measurement was conducted simultaneously at the same site. DEM, digital elevation model.
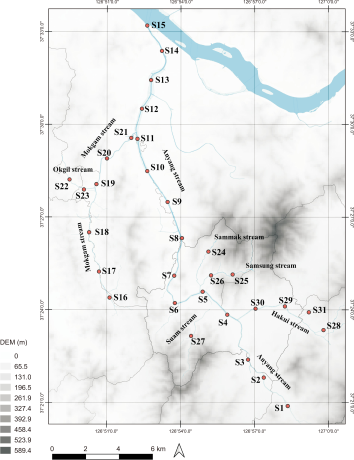
Fig. 2
The change of invasive fish species distribution in the study area by seasons. (A) July. (B) October.
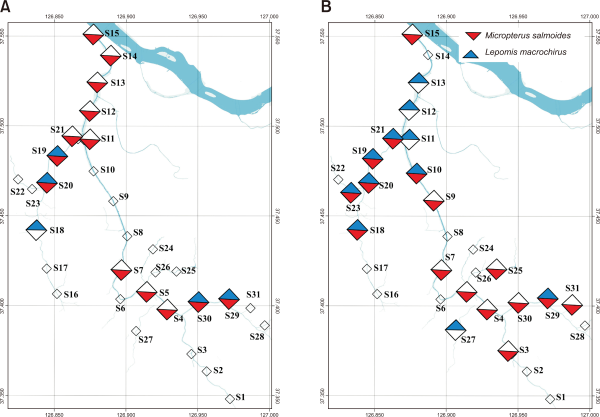
Fig. 3
The average receiver operating curve from the fifty model runs describing relative sensitivity and specificity for invasive species. (A) The area under curve (AUC) of model for M. salmodies in July (left) and October (right). (B) The AUC of model for L. macrochirus in July (left) and October (right).
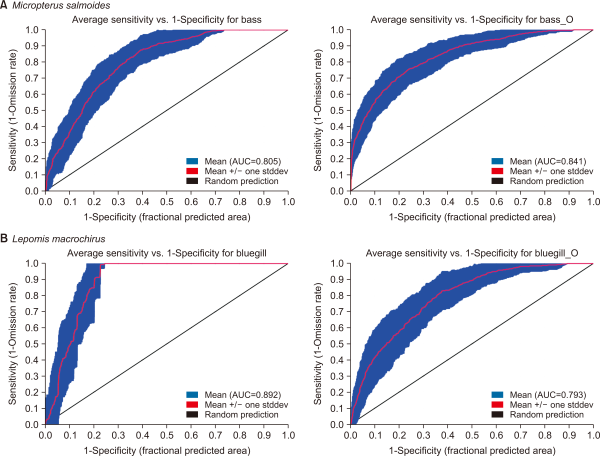
Fig. 4
MaxEnt model prediction for potential distribution of Micropterus salmoides and Lepomis macrochirus by seasons. The species distirbution model of (A) M. salmoides in July, (B) M. salmoides in October, (C) L. macrochirus in July, (D) L. macrochirus in October. MaxEnt, Maximum Entropy.
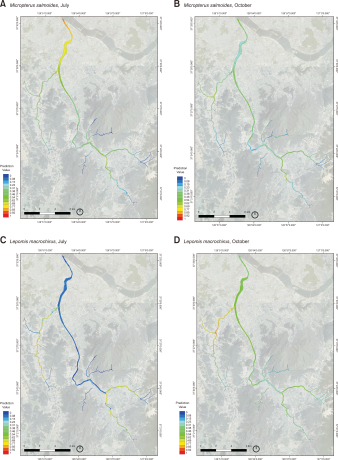
Fig. 5
Prediction value of potential distribution by streams. (A) Anyang stream (main stream). (B) Mokgam stream. (C) Okgil stream. (D) Suam stream. (E) Sammak stream. (F) Samsung stream. (G) Hakui stream. ***P<0.001.
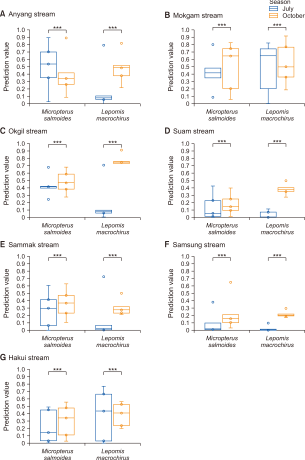
Fig. 6
Jackknife of regularized training gain for Micropterus salmoides and Lepomis macrochirus by seasons. Oct and Jul represent October and July, respectively: without variable (light blue), with only variable (blue), with all variables (red). Jakknife of reugualrized training gain for (A) M. salmoides in July, (B) M. salmoides in October, (C) L. macrochirus in July, (D) L. macrochirus in October. DEM, digital elevation model; DO, dissolved oxygen; Cond, conductivity; Temp, temperature.
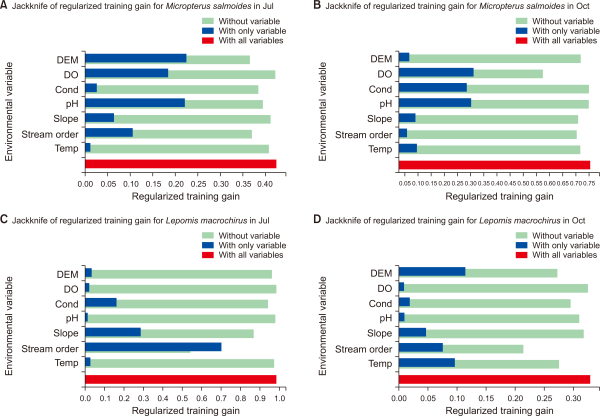
Table 1
Contribution percent and permutation importance of environmental variable to the MaxEnt models according to species and seasons
| Species | Sampling month | ||||||
|---|---|---|---|---|---|---|---|
|
|
|||||||
| July | October | ||||||
|
|
|
||||||
| Variable | % Contribution | Permutation importance | Variable | % Contribution | Permutation importance | ||
| Micropterus salmoides | pH | 28.2 | 52.4 | DO | 34.9 | 21.1 | |
| DEM | 23.2 | 9.2 | Cond | 21.5 | 5 | ||
| Stream order | 18.6 | 11 | Temp | 10.9 | 15 | ||
| DO | 13.8 | 7.6 | Slope | 10.2 | 24 | ||
| Slope | 7.2 | 4.5 | Stream order | 9.4 | 15.7 | ||
| Cond | 5.7 | 7.7 | pH | 7.5 | 3.8 | ||
| Temp | 3.2 | 7.5 | DEM | 5.6 | 15.3 | ||
| Lepomis macrochirus | Stream order | 79.6 | 78.6 | Stream order | 31.4 | 37.4 | |
| Slope | 13.5 | 10.1 | Temp | 28.8 | 37.8 | ||
| Cond | 3.6 | 6.4 | DEM | 15.3 | 12.8 | ||
| DEM | 1.6 | 1.9 | Cond | 10.4 | 3.3 | ||
| Temp | 1.3 | 1.9 | pH | 7.5 | 6.2 | ||
| pH | 0.3 | 0.6 | Slope | 4.7 | 1.1 | ||
| DO | 0.1 | 0.5 | DO | 1.8 | 1.5 | ||