Introduction
South Korea is geographically surrounded by the sea on three sides. In addition, it is one of the largest archipelagos in the world, with small and large 3,952 islands (487 inhabited islands and 3,465 desert islands), after Indonesia (15,000), the Philippines (7,100), and Japan (6,800) (Kim & Lee, 2020). In particular, as more than 60% of the islands are distributed on the southwest coast, there is a highly complex biogeographic structure; these areas have been designated as biosphere reserves by the UNESCO (United Nations Educational, Scientific and Cultural Organization) in 2009 (Hong & Kim, 2011). Islands environmentally have bridgehead effects in which terrestrial organisms disperse into the ocean, serving as a filter of environmental changes coming from the ocean to terrestrial spheres (Hong & Kim, 2011). Furthermore, as islands have independent small streams separated from the inland water system, and the streams within the islands are also distributed in isolation from each other; they are utilized as basic data to examine geographical events of island creations, the geographical distribution of fish, and ecological characteristics of streams (Son & Song, 1998).
Most of the streams on islands in South Korea consist of short and small streams (Han et al., 2016), and play an important role as habitats for endemic and endangered species (Haigh et al., 2004; Wipfli et al., 2007). Despite the high ecological values of the streams on the islands, there are few studies on the management of streams, the biota, and habitat environments (Choi & Lee, 2008a). In fact, studies on freshwater fishes in domestic islands have been conducted on only several relatively large islands, such as Jeju Island (Kim et al., 2014; Lee et al., 1999; 2015), Geoje Island (Son & Song, 1998), Ganghwa Island (Choi & Lee, 2008a; 2008b), Geumo Islands (Chae & Yoon, 2007; Kim et al., 1994), Bogil Island (Han et al., 2017), and Seokmo Island and Gyodong Island (Choi & Lee, 2008b). Although surveys on fish assemblage were conducted on some islands in South Korea, as part of the National Natural Environment Survey by the Ministry of Environment, there is a limited number of studies, such as Choi and Jeon (1980), and on fish assemblage in various Korean islands, merely focusing on the investigation of the current status of fish appearance around specific islands. In addition, most studies have focused on the distribution of freshwater fish in island, but there are only a few comprehensive studies (Han et al., 2016; Lee et al., 2015) on freshwater fish in island along with environmental variables in Korea.
Fish are one of the most sensitive and reliable indicators to estimate the health of aquatic ecosystems, since they are more effective than other living organisms in integrating biological responses to external influences, such as habitat changes and environmental degradation (Harris, 1995; Ibarra et al., 2003; Karr & Freemark, 1985; Park et al., 2006a). They play a role as important members of aquatic ecosystems, through consumption of organisms at low trophic levels and their regulatory effects at various ecosystem levels (Carpenter et al., 1985; Power et al., 1985; Wootton & Power, 1993). In addition, the distribution and frequencies of fish communities are affected by various environmental variables (Kwon et al., 2012). Considering that, various studies on fish communities have analyzed effects of abiotic factors such as water quality (Schofield & Driscoll, 1987), land cover (Allan, 1995; Park et al., 2006a), and physio-chemical factors (Petry et al., 2003; Teixeira-de Mello et al., 2009).
It is crucial to reveal the biota in islands with various environmental conditions and their habitats, so as to establish management strategies for the conservation and protection of biological resources in streams on islands (Chae & Youn, 2007). In this regard, this study analyzed the relationship between fish communities inhabiting Korean islands and the characteristics of various habitat environments. In detail, it aims 1) to categorize distribution patterns of fish communities in domestic islands and 2) to identify the most dominant environmental variables influencing fish communities.
Materials and Methods
Study area and data collection
Fish community data were extracted from the “3rd National Ecosystem Survey (2006-2013)” database in EcoBank ( https://nie-ecobank.kr) of the National Institute of Ecology, Korea. The survey was conducted by dividing 824 maps across the country into nine grids for each map at a scale of 1:25,000. At each grid, freshwater fish were collected using casting net and kick net. The collection at each sampling site was carried out in a section of approximately 100 m of the stream, and habitats were included as variously as possible. From the database of EcoBank, we selected 73 islands based on the availability of data. Among these data, we selected 38 islands with appearance of two or more fish species (Fig. 1), among inhabited islands with areas between 1 and 70 km2 (mean area 27.5 km2), in order to analyze fish communities around the islands. Most sampling sites of the 38 islands are small streams composed of the second or lower stream order. Details of the sampling protocol for fish are described in the National Natural Environment Survey guideline (Ministry of Environment, 2006).
Nineteen environmental variables with three categories (i.e., physical variable, substrate composition, and land use types) were measured to reflect the different habitat conditions at each sampling site (Table 1). The minimum and maximum values of physical variables of streams, such as water depth, stream width, and water width, were investigated at the entire sampling sites, and accordingly, the average value was derived. As for the benthic composition of streams (e.g., boulder, cobble, pebble gravel, and sand), the relative ratio was calculated with the naked eye, by applying the classification method of Cummins (1962). As for land cover types (e.g., urban area, agricultural area, forest area, grassland, and bare land) updated in 2013 by the Ministry of Environment ( https://egis.me.go.kr), areas with a radius of 100 m from sampling sites were extracted from a digital map (Kwon et al., 2012), by using ArcGIS 10.7.1 ( www.esri.com). The raw data of environmental variables on 38 island has been added as Appendix.
To analyze the fish community composition in line with different island environments, the fish were divided into four trophic guilds (i.e., omnivores, piscivores, insectivores, and herbivores) and three tolerance guilds (i.e., tolerant species, intermediate species, and sensitive species). These guilds were classified according to “National Surveys for Stream Ecosystem Health” in Korea (National Institute of Environmental Research, 2019).
Data analysis
A Self-Organizing Map (SOM) was utilized to analyze the fish community patterns found in domestic island areas. SOM is an unsupervised learning algorithm based on artificial neural networks that approximates the probability density function of the input data (Kohonen, 2001). SOM consists of two layers, input and output layers, and each layer is connected by connection weights. The input layer is composed of computation neurons to receive input data, whereas the output layer is expressed as a two-dimensional hexagonal lattice consisting of N number of output neurons. The output layer of the SOM in the present study consists of 24 neurons arranged into a 6×4 hexagonal lattice, which was determined by the heuristic equation (Vesanto & Alhoniemi, 2000). Two methods were employed to evaluate the quality of the map: the quantization error for resolution and the topographic error for topology preservation (Park et al., 2003). After the learning process, SOM units were grouped through hierarchical cluster analysis using Ward’s linkage method with the Euclidean distance measure.
For the training SOM, we used the functions in the SOM toolbox (Alhoniemi et al., 2000) in Matlab ver. 6.1 (MathWorks, Natick, MA, USA). The multi-response permutation procedure (MRPP) for testing the differences between clusters was conducted using PC-ORD ver. 5 (MjM Software, Gleneden Beach, OR, USA) to evaluate the significance of the clusters defined in the SOM (Mielke et al., 1976).
Prior to the analysis of the SOM, we selected 29 species observed at more than two sampling sites (≥3%) to remove the noise by rare species in the data analyses (Park et al., 2006b). After then, to reduce variation, fish abundance was natural log-transformed after adding one to all data to avoid the problem of zero being undefined for logarithms.
Indicator species analysis (IndVal; Dufrêne & Legendre, 1997) was applied to evaluate significant indicator species in each cluster, which was divided by SOM. The indicator value for each species in each group consists of a combination of relative abundance and relative frequency, with the range from 0 (no indication) to 100 (perfect indication). Monte Carlo simulation was applied to determine the significance of an indicator value of species. Analysis was performed with PC-ORD version 5 (McCune & Mefford, 1999).
Random forest (Breiman, 2001) was applied to predict the effects of environmental variables on fish community characteristics. The random forest is a non-parametric method for predicting and assessing the relationship between a group of potential predictor variables and response variables (Breiman, 2001). Compared to conventional statistical methods, this model is a highly powerful tool for the analysis of complex ecological data, as it has high accuracy, efficiency, and robustness (Cutler et al., 2007; He et al., 2010). Due to such features, this model has been usefully applied in diverse ecological fields (Barker et al., 2006; Kwon et al., 2015; Moisen & Frescino, 2002; Pal, 2005; Peters et al., 2007). To measure the importance of environmental variables, we used the Minimum Description Length (MDL), which measures the quality of attributes as their ability to compress the data (Robnik-Sikonja, 2004). To compare the relative importance of each environmental variable, values of MDL were rescaled to range from 0 to 100. Random Forest analysis was repeated 10 times, and the extracted MDL values were averaged for the smallest generalized error. The random forest model was run with the ‘randomForest’ package in the R ( http://cran.r-project.org).
Spearman rank correlation was used to evaluate the relationship between environmental variables. The Kruskal–Wallis test (K–W test) was utilized to compare differences in environmental variables and community indices between groups defined by the SOM results. Nonparametric Dunn's multiple comparisons test was used as a post-hoc test. All statistical analyzes were performed with STATISTICA ver. 7 (Tulsa, OK, USA).
Results and Discussion
Analysis of fish communities and environmental variables
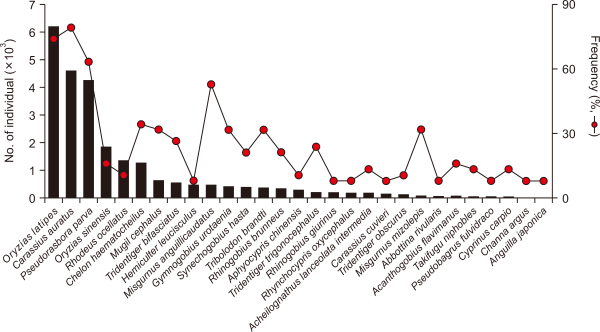
In South Korea, it is reported that there are 4 classes, 45 orders, 223 families, 724 genera, and 1,291 fish species (National Institute of Biological Resources, 2019); among them, a total of 216 species belonging to 39 families in freshwater fish, including brackish species, are known. A total of 26,698 individuals of freshwater fish belonging to 58 species under 20 families investigated at 38 islands targeted in this study; six endemic species (Iksookimia hugowolfeldi, Squalidus japonicus coreanus, Liobagrus somjinensis, L. mediadiposalis, Kichulchoia brevifasciata, Periophthalmus magnuspinnatus), two alien species (Carassius cuvieri, Micropterus salmoides), and one endangered species (K. brevifasciata) were found. Among all species, Oryzias latipes was the most abundant accounting for 23.1% of all the individuals collected, followed by Carassius auratus (17.1%) and Pseudorasbora parva (15.8%) with strong drought resistance (Son & Song, 1998) (Fig. 2). Around the target islands, Zacco platypus and Zacco koreanus, the main dominant species in Korea (Kwon et al., 2012), were not collected during this study, but they were found around relatively larger islands such as Namhae and Geoje Islands, which were not included in this study, with an area of over 40 km2 (Han et al., 2016; Son & Song, 1998).
To evaluate relationships between environmental variables, we applied Spearman rank correlation. Average water depth showed positively correlated with physical variables with the exception of minimum stream width, minimum water width, and minimum water depth (P>0.05), whereas it was negatively correlated with substrate composition such as boulder (r=–0.40, P<0.05) and cobble (r=–0.35, P<0.05) (Fig. 3). The proportion of sand and agriculture were negatively correlated with substrate composition (r>–0.70, P<0.05) and land use types (r>–0.33, P<0.05), respectively.
According to the theory of island biogeography, it is known that the biodiversity in an island is proportional to an area of the island, and is in inverse proportion to the distance from the mainland (Gorman, 1979; MacArthur & Wilson, 1967). However, this study indicated that only the species number of fish communities showed a positive correlation with the island area (Spearman rank correlation, r=0.56, P<0.05) (Fig. 4). The reason is that compared to the MacArthur and Wilson’s theory (1967) of island biogeography, which targeted volcanic islands in the ocean, the islands in this study are isolated by being separated from the land, after the Holocene Sea level rise without sudden topographical changes (Kim et al., 2016); there are mostly offshore islands with a distance of less than 30 km from the land.
Patterning fish communities
To analyze the characteristics of fish communities in 38 islands, a SOM analysis was conducted on 29 species appeared at two or more sites. The 38 sites were patterned into three different clusters (I-III) based on the similarities of fish communities in the SOM (final quantization error: 0.950 and final topographic error: 0.000) (Fig. 5). An MRPP indicated a significant difference between fish communities among the three clusters (A=0.11, P<0.01). Out of the total 38 sites, 19 sites belonged to cluster III, 14 sites to cluster II, and five sites to cluster I. The distribution of sites in each cluster was highly related to the sites’ geographic locations (Fig. 5B). Most sites in cluster III were located in the lower part of the West Sea, and the sites in cluster I were situated in an upper part of the West Sea. Sites in cluster II were widely distributed in the West Sea and South Sea.
Some physical variables including average and maximum values in water width and water depth showed significant differences among clusters (K-W test, P<0.05) (Table 2), but others including stream width, minimum water width and minimum water depth did not. As for water width and water depth, cluster I showed significantly higher average and maximum values, whereas cluster II indicated the lowest value (Dunn's test, P<0.05). Meanwhile, there was no significant difference between the groups in terms of the rate of substrate composition (K–W test, P>0.05) (Table 2). However, all clusters had sand with a high proportion of 50% or more, and in particular, clusters I and III showed very high ratios of 81% and 76%, respectively (Table 2). This is because most of the sampling sites were brackish water zones closer to seawater with a high ratio of benthic sedimentation (Han et al., 2016). Land use types around the study areas showed similar characteristics. The three groups had high ratios of urban and agricultural land areas with 55% or more, and in particular, clusters I and II showed very high rates of 85.8% and 70.5%, respectively (Table 2).
Species composition, frequencies, and conditions of fish communities are affected by water and habitat quality modified by ambient land uses (Deacon & Mize, 1997). In particular, it has been reported that an increase in urban and agricultural land areas decreases biodiversity in streams (Genito et al., 2002; Harding et al., 1998; Wang et al., 1997). However, in this study, cluster I, with the highest ratio of urban and agricultural areas, had the highest community index, whereas cluster III, with the highest ratio of forests, indicated the lowest value (Dunn’s test, P<0.05) (Fig. 6). It is assumed that the ratios of tolerant species and omnivores were high because the research areas consisted of sites with high human disturbance such as urban and agricultural lands. Morgan and Cushman (2005) reported that disturbance-tolerant species dominated urbanized areas. In effect, the relative abundance of tolerant species was higher than 70% in all three clusters (cluster I: 80.2%, cluster II: 70.4%, cluster III: 90.0%), whereas the relative frequency of sensitive species recorded the lowest of less than 5% (cluster I: 1.1%, cluster II: 2.1%, cluster III: 0.0%) (Fig. 7A). As for the trophic guild, all three clusters showed high ratios for Omnivores (cluster I: 51.5%, cluster II: 50.5%, cluster III: 68.2%), and insectivores (cluster I: 35.1%, cluster II: 42.6%, cluster III: 18.2%) (Fig. 7B).
Based on IndVal of the SOM clusters, 16 species were selected as indicator species (P<0.05) (Fig. 8). Cluster I had 15 out of a total of 16 indicator species, with a high abundance of all fish species. The indicator species analysis is determined by the complex application of populations and frequencies (Roberts, 2016), and the observation of a large number of indicator species in one group may mean its different cluster structures from other clusters. Cluster III showed relatively higher abundance in three species such as O. latipes, Mugil cephalus, and Channa argus, compared to other clusters, and particularly, O. latipes was found as an indicator species (Fig. 8). Meanwhile, there were no indicator species in cluster II, but relatively high abundance in Misgurnus anguillicaudatus, Tridentiger brevispinis, Gymnogobius urotaenia, Acanthogobius flavimanus, and Takifugu niphobles (Fig. 8). Meanwhile, Family Cyprinidae had the most dominant species with 32.8% (19 species) out of a total of 58 species, and in particular, seven (43.8%) out of 16 indicator species was found to be Family Cyprinidae. Previous studies (Chae et al., 2015; Han & An, 2013; Han et al., 2016) reported similar results; the dominance of Family Cyprinidae was commonly found in the Korean streams flowing into the West and South Seas.
Prediction of fish diversity
This study predicted species richness and Shannon diversity in line with differences in environmental variables, by using a random forest model, and evaluated the relative importance of environmental factors (Fig. 9). Predictive powers of species richness and Shannon diversity, through the model, were 0.98 and 0.95 coefficients of determination (R2), respectively.
Fish communities are generally affected by changes in various environmental factors such as physical habitats and land use types (Hughes et al., 2006; Roth et al., 1996). In particular, changes in the physical habitats of streams caused by fluctuations in stream flows, affect the composition and stability of fish communities (Grossman et al., 1998; Jackson et al., 2001). In fact, according to the results of this study, which predicted species richness using various environmental variables, it was found that physical variables of streams, such as maximum water depth (100) and minimum stream width (98.9), showed relatively high importance (Fig. 8A). In terms of Shannon diversity predictions, the relative importance was high in the order of forest area (100), maximum water depth (77.1), and gravel (69.4) (Fig. 8B). The physical environment of streams (e.g., anthropogenic influence, land cover) has been reported in many previous studies as having a major influence on the composition of fish communities (Han et al., 2016; Rowe et al., 2009; Wang et al., 2003). For instance, Cheng et al. (2012), which predicted fish abundance in the Yangtze River, also pointed out the physical variables of streams as important factors. Furthermore, He et al. (2010) indicated that land use types and stream characteristic variables were major factors affecting the distribution pattern of fish communities.
In conclusion, this study analyzed the relationship between fish communities inhabiting major islands in South Korea and environmental variables of the habitat. As a result, the physical variables (i.e., water width and water depth) of streams on the islands brought differences between SOM groups reflecting the characteristics of the fish community. These factors served as crucial factors in predicting fish species richness. Although there was no statistical significance between the SOM groups, the forest area, stream width, and gravel ratio were found to be important factors in predicting Shannon diversity. Therefore, this study suggests that its outcomes can be used as basic data for establishing a stream ecosystem management strategy in terms of conservation and protection of biological resources in streams of islands isolated from the outside. In addition, in future studies, it is necessary to analyze the relationship with other organisms (e.g., macroinvertebrates, algae) in the island area along with additional investigation on water quality.
References
, , , (2000, Retrieved June 8, 2021) SOM toolbox from http://www.cis.hut.fi/projects/somtoolbox
(2016) R Package Version 1.8-0 Labdsv: Ordination and Multivariate Analysis for Ecology, http://ecology.msu.montana.edu/labdsv/R
Figures and Tables
Fig. 1
Locations of the sampling sites around island in South Korea. The name of each island (IL) indicated in Appendix.
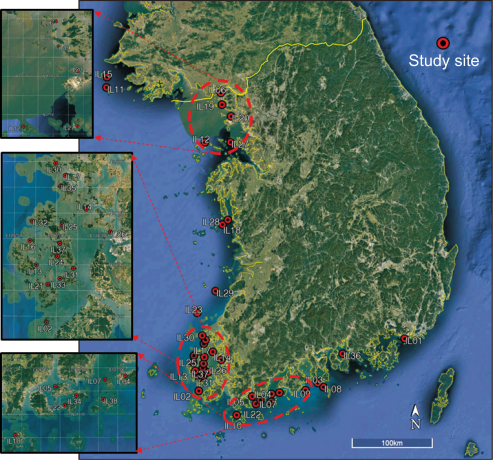
Fig. 3
Spearman rank correlation between environmental variables. The color gradient (from –1 to 1) indicated Spearman's correlation coefficients. The darker blue indicates a higher positive correlation (P<0.05), and darker red indicates a higher negative correlation (P<0.05). Min, minimum; Max, maximum; Ave, average; Str, stream; Wat, water; Wid, width; Dep, depth.
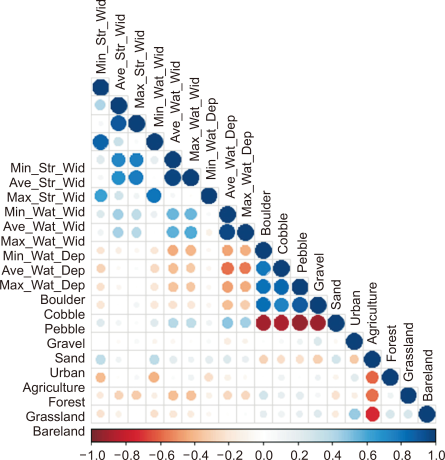
Fig. 4
Relationship between (A) the number of fish species and island area, (B) the number of fish individuals and island area, (C) the number of fish species and distance from the mainland, and (D) the number of fish individuals and distance from the mainland.
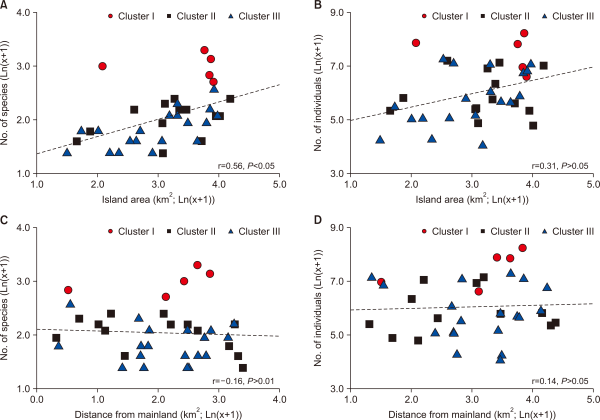
Fig. 5
(A) Patterns of fish communities in 38 islands (IL) using Self-Organizing Map (SOM), (B) the geographical distribution patterns of the sampling sites in three clusters, and (C) dendrogram of hierarchical cluster analysis with the Ward linkage method based on Euclidean distance for the SOM units.
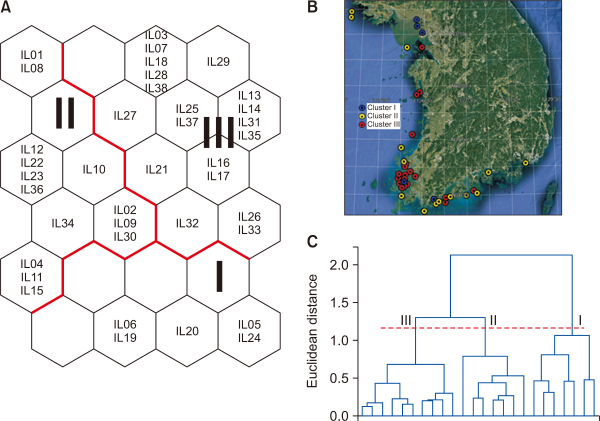
Fig. 6
Difference in community indices for 3 different clusters by the Self-Organizing Map. (A) Species richness, (B) Abundance, (C) Shannon diversity, and (D) Evenness. Different letters indicate significant differences between the clusters based on Dunn’s test after a Kruskal–Wallis test (P<0.05). NS show a non-significant difference among 3 different clusters.

Fig. 7
Difference in (A) tolerance and (B) trophic guilds for 3 different clusters by the Self-Organizing Map.
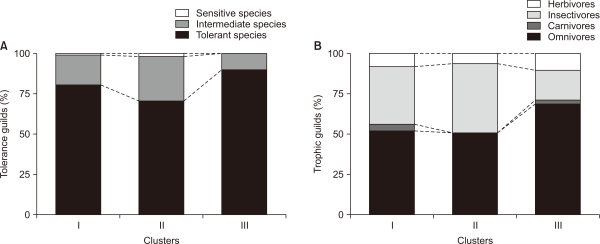
Fig. 8
Relative abundance of 29 species in a different cluster by the Self-Organizing Map (SOM). Values were obtained from weight vectors of the trained SOM (boxplot: - median, 25-75% percentiles, non-outlier range). The filled boxes show the indicative species in each cluster from IndVal method.
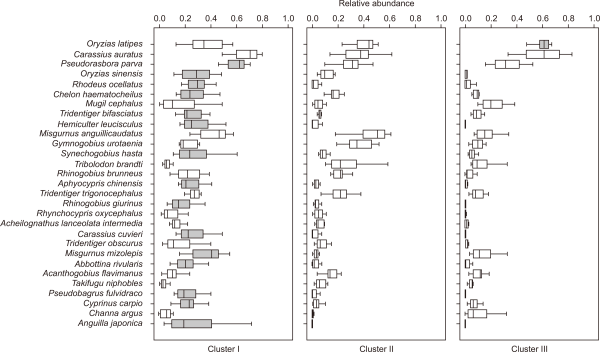
Fig. 9
Relative importance of environmental variables for predicting (A) species richness and (B) Shannon diversity using random forest model.
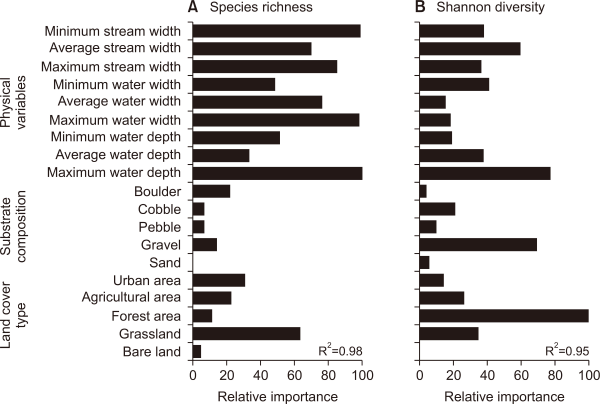
Table 1
Characteristics of 19 environmental variables at 38 island of Korea
| Category | Variable | Mean | Range (min-max) |
|---|---|---|---|
| Physical variable | Minimum stream width (m) | 4.6 | 0.0-17.0 |
| Average stream width (m) | 22.8 | 5.0-50.0 | |
| Maximum stream width (m) | 13.8 | 2.5-30.0 | |
| Minimum water width (m) | 1.9 | 0.0-14.0 | |
| Average water width (m) | 15.3 | 3.0-30.0 | |
| Maximum water width (m) | 8.6 | 1.5-22.0 | |
| Minimum water depth (m) | 0.2 | 0.0-0.8 | |
| Average water depth (m) | 1.4 | 0.3-2.5 | |
| Maximum water depth (m) | 0.8 | 0.15-1.65 | |
| Substrate composition | Boulder (%) | 5.4 | 0.0-33.3 |
| Cobble (%) | 6.7 | 0.0-34.4 | |
| Pebble (%) | 8.4 | 0.0-27.4 | |
| Gravel (%) | 11.4 | 0.0-30.1 | |
| Sand (%) | 68.0 | 2.2-100.0 | |
| Land use type | Urban area (%) | 14.5 | 0.0-42.1 |
| Agricultural area (%) | 52.5 | 7.2-97.6 | |
| Forest area (%) | 7.9 | 0.0-57.8 | |
| Grassland (%) | 18.7 | 0.0-69.3 | |
| Bare land (%) | 6.3 | 0.0-40.4 |
Table 2
Differences of environmental variables at 3 different clusters by the SOM
| Category | Variable | Cluster | ||
|---|---|---|---|---|
|
|
||||
| I | II | III | ||
| Physical variable | Minimum stream width (m) | 2.4 (1.5) | 3.3 (3.5) | 6.1 (5.9) |
| Average stream width (m) | 13.2 (2.5) | 10.5 (5.4) | 16.2 (7.3) | |
| Maximum stream width (m) | 23.3 (5.8) | 17.8 (9.6) | 26.3 (12.9) | |
| Minimum water width (m) | 1.2 (1.2) | 0.8 (0.8) | 2.8 (3.7) | |
| Average water width (m) | 11.0 (1.6)a | 5.7 (2.7)b | 10.4 (5.0)ab | |
| Maximum water width (m) | 21.0 (3.6)a | 10.6 (5.2)b | 17.9 (8.6)ab | |
| Minimum water depth (m) | 0.1 (0.0) | 0.2 (0.1) | 0.2 (0.2) | |
| Average water depth (m) | 1.0 (0.1)a | 0.6 (0.3)b | 0.8 (0.3)ab | |
| Maximum water depth (m) | 1.9 (0.2)a | 1.1 (0.6)b | 1.4 (0.6)ab | |
| Substrate composition | Boulder (%) | 1.8 (3.9) | 8.7 (10.5) | 4.2 (7.1) |
| Cobble (%) | 3.3 (4.6) | 12.5 (11.4) | 3.7 (7.1) | |
| Pebble (%) | 6.7 (9.1) | 12.0 (9.9) | 6.3 (7.3) | |
| Gravel (%) | 7.2 (9.7) | 15.4 (11.2) | 9.8 (9.4) | |
| Sand (%) | 81.0 (25.6) | 51.4 (37.1) | 76.0 (25.8) | |
| Land use type | Urban area (%) | 10.4 (10.9) | 17.8 (13.5) | 13.2 (7.8) |
| Agricultural area (%) | 75.4 (25.2) | 52.7 (21.4) | 46.4 (31.1) | |
| Forest area (%) | 0.0 (0.0) | 4.1 (7.6) | 12.8 (18.4) | |
| Grassland (%) | 4.8 (3.3) | 20.8 (21.7) | 20.9 (15.2) | |
| Bare land (%) | 9.4 (15.6) | 4.7 (5.8) | 6.7 (12.2) | |
