Introduction
Large carnivore populations are structured by different life history stages (i.e., age and sex classes), which contribute to population demography and are important for interpreting changes in abundance (Albon et al., 2000; Carter et al., 2020; Gaillard et al., 1998; Sibly & Smith, 1998). For the conservation and management of large carnivores, the major goal is often centered on population size and changes in size over time (Koons et al., 2006). The factors explaining the changes in population size and demography are of interest for population ecology, conservation biology, and wildlife management (Caughley, 1977). It is important to understand if the changes (spatial and temporal) in the distribution and population demography of carnivores are due to natural causes or anthropogenic interventions (Green et al., 2018). Therefore, long-term demography data are essential to underline the dynamics of a population to evaluate the potential population-level effects of threats (e.g., emergent diseases, poaching, and degradation of habitats; Grosbois et al., 2008; Morris & Doak, 2002). Information on demography data is useful for the development of population management programs to prioritize and implement conservation strategies (Morris & Doak, 2002). Reliable estimates and essential demographic parameters (i.e., life history stages) for many carnivores are lacking because of their elusive nature (Karanth & Chellam, 2009) and scarcity of long-term surveys (Magurran et al., 2010; Patterson et al., 2014). Long-term life history data are available for some carnivores (e.g., lions [Panthera leo; (Packer, 2019)], tigers (Majumder et al., 2017; Sunquist, 1981), cheetahs [Acinonyx jubatus; (Kelly et al., 1998)], leopards [Panthera pardus; (Swanepoel et al., 2015)], and pumas [Puma concolor; (Logan & Sweanor, 2001)]), but the knowledge of populations dynamics for different sexes and age stages is not available for many populations.
The tiger, a flagship species, is a symbol of conservation and can act as an umbrella species for the ecosystems that they inhabit (Seidensticker, 2010). The tiger’s role as a top predator is important in regulating and perpetuating the ecological processes of their ecosystems (Sunquist et al., 1999; Wikramanayake et al., 2011). The recent population estimate of tigers in India is approximately >3,000 tigers (~70% of the world’s tiger population; Jhala et al., 2019). Tigers have high turnover rates, including mortality and reproduction; thus, it is important to assess their population annually (Goodrich et al., 2008). Data on long-term ecological research of tiger populations have received little attention in the Indian subcontinent. The only long-term study for wild tigers is available from the neighboring Royal Chitwan National Park (RCNP), Nepal (Sunquist, 1981), which was conducted using radiotelemetry. However, using radiotelemetry to monitor large number of tigers or at population levels is difficult owing to the possibility to study a limited number of individuals. Further, the challenges in obtaining official permissions for capturing animals in India are complex, requiring a relatively long application period and posing a high cost. Alternatively, individual tigers can be recognized from distinctive natural marks based on long-term research (Karanth, 1995; Majumder et al., 2017), which may enable the evaluation of different life history stages.
The technology of remotely triggered motion-sensitive cameras based on individual identification and monitoring for long periods can enable the life history parameters of elusive animals to be determined (O’Connell et al., 2011; Sollmann et al., 2013). The photographic histories of individual animals over the years also allows the estimation of survival, recruitment, population growth rate, and movement, which influence changes in abundance (Williams et al., 2002). Motion-sensitive cameras are non-intrusive and applicable over large areas with relatively moderate effort (Silveira et al., 2003). Similarly, ongoing developments in analytical methods (e.g., multi-state closed robust design) extend the range of capture-recapture studies to gather information on key demographic parameters (e.g., population growth, recruitment rate, temporary emigration, and survival; Sharma et al., 2014; Troyer et al., 2014). These methods allow investigators to handle ecological and statistical complexities involved in sampling the populations of wide-ranging, rare, and elusive species (Thompson, 2013). Additionally, these estimates can be used to test model-based predictions (Cooch & White, 2011) for gaining a better understanding of population dynamics as a basis for management (Karanth & Stith, 1999). Recently, wild tigers were monitored for long durations (5-9 yrs) using motion-sensitive cameras under a capture-recapture framework in Southeast Asia (Bisht et al., 2019; Duangchantrasiri et al., 2016; Karanth et al., 2006; Majumder et al., 2017). These studies were based on multi-season efforts to measure the overall trends in wild tiger populations. Information on population estimates according to different life history stages (i.e., different age and sex classes) or different demographic groups have not been reported for any tiger population in India. Such information is only available for the demographic groups of Amur tigers (Smirnov & Miquelle, 1999) and tigers in Nepal (Barlow et al., 2009).
In the natural life cycle of tigers, cubs are born, they mature, disperse, establish home ranges, and breed. The short life span (~15 yrs) of tigers in the wild leads to a high turnover rate and human-induced factors (e.g., poaching) accelerate the changes in demography (Bisht et al., 2019; Duangchantrasiri et al., 2016; Karanth et al., 2006; Majumder et al., 2017). During the process of the acquisition of new territories by adult male tigers, the non-breeding (juveniles and sub-adults) male tigers in the demographic group are more vulnerable to infanticide, emigration or dispersal, and territorial fights, whereas non-breeding females remain nearer to natal areas (Barlow et al., 2009; Singh et al., 2014a; Smith, 1993; Sunquist, 1981). Hence, it is important to understand the demographic stage that is vulnerable and causes fluctuations in populations, which can help biologists develop strategies and monitoring protocols for the long-term viability of populations.
Our study was an extension of the ongoing monitoring of the tiger population in Ranthambhore Tiger Reserve (RTR), Rajasthan, India. The reserve is geographically isolated and comprises a small population of <50 individuals (Jhala et al., 2008). Poaching resulted in the population decline of tigers (Sharma & Wright, 2005) and only 19 individuals were present in 2005 (Chauhan et al., 2005). This offered an opportunity to evaluate the recovery or further decline of the tiger population and to understand the natural temporal dynamics. Here, we examined the observed recovery pattern of tigers after the sudden decline in 2004 (Sharma & Wright, 2005) and focused on understanding the sources of variation in the abundance of the different life history stages (breeding and non-breeding) of a tiger population. The information generated from this study can be helpful for wildlife managers to understand the causes of changes in a tiger population and can help identify key threats to conservation strategies for endangered species.
Materials|Methods
Study area
The western-most population of tigers survives in western India in RTR. The RTR (25°54′N–26°12′N and 76°22′E–76°39′E) is in the semi-arid part of Rajasthan, India (Fig. 1). RTR receives an average annual rainfall of 80 cm, and temperatures can be low as 2°C in January and as high as 47°C in May (Singh et al., 2014b). The RTR is characterized by a dry subtropical climate with four distinct seasons: summer (Mar–Jun), monsoon (Jul–Aug), post-monsoon (Sep–Oct), and winter (Nov–Feb). The undulating terrain has an elevation ranging from 200 to 500 m and 76% of the area is categorized as highly undulating (Singh, 2011). Land uses outside the RTR include agriculture, human settlements, orchards, and mining. The RTR is surrounded by 332 villages within 5 km of the reserve boundary, with approximately 200,000 people and 100,000 livestock (Sharma et al., 2004); people are mostly engaged in agriculture (i.e., cutting grass, lopping trees, and grazing livestock). Owing to intense habitat destruction across the landscape, tigers are present only in 344 km2 of the 1,394 km2 of the RTR (Jhala et al., 2008).
The main vegetation types are northern tropical dry deciduous forests and northern tropical thorn forests (Champion & Seth, 1968). Other large predators in the area include leopards, sloth bears (Melursus ursinus), and striped hyaenas (Hyaena hyaena). The potential wild prey include chital (Axis axis), sambar (Rusa unicolor), nilgai (Boselaphus tragocamelus), chinkara (Gazella bennettii), and wild pig (Sus scrofa). The RTR consists of two management units; a core area that includes Ranthambhore National Park (392 km2), and a buffer area including Sawai Mann Singh (330 km2) and Kailadevi (672 km2) wildlife sanctuaries (Fig. 1).
Field methods
This study was part of a long-term study conducted in RTR during November 2007–February 2011 using non-invasive methods with motion-sensitive cameras (Singh et al., 2021). We did not capture animals and did not disturb them during surveys. We followed the guidelines of the American Society of Mammalogists (Gannon & Sikes, 2007) for the ethical treatment of animals.
Tiger monitoring
Following the decline of the tiger population in 2004 (Sharma & Wright, 2005), the Wildlife Institute of India, Dehradun, India, initiated tiger monitoring program in RTR in 2005 (Chauhan et al., 2005). The presented research is an extension of the long-term monitoring of the tiger population in RTR. The tigers were identified by the stripe pattern on their left and right flanks according to Karanth (1995), and a unique number was assigned to each individual.
Characterizing the tiger population
Age classification
Males — In the initial period of the project (Apr–May 2005), four male tigers were photographed and identified and the age of two tigers was estimated (Chauhan et al., 2005). Tiger male (TM) – 02 was ≥5 years old because he had been photographed in 1998 and TM-20 was ≥3 years old and he had been photographed in 2000 with his mother as confirmed by previous photographs. Two tigers were never photographed during the entire sampling period and may have emigrated or were poached. We confirmed that all photographed males were ≥3 years old.
Females — We assumed that females with cubs were ≥3 years old because Smith et al. (1987) reported that females start breeding when they are 3 years in age or older. In 2005, three females were photographed with cubs, and five females were photographed with cubs in subsequent years, with two never being photographed with motion-sensitive cameras during the entire sampling period; they may have emigrated to nearby protected areas. We are certain that all identified tigers were ≥3 years old (Singh et al., 2014c).
We knew the approximate age of the male and female cubs born during our study period (2005-2011) (Singh et al., 2013). The sex of the cubs was confirmed after they were older than 1 year based on their body size and secondary sexual characteristics. We used the following age categories (Goodrich et al., 2010; Karanth, 2003): cubs (≤1 yr old, associated with and dependent on their mothers), juveniles (1-2 yrs old), sub-adults or post dispersal floaters or transients (>2-3 yrs old, no longer associating with their mothers but not reproducing), and breeding adults (≥3 yrs old). The proportion of females (≥3 yrs old) that reproduced was determined based on direct observations and photographic evidence from cameras.
Motion-sensitive photo-capture of tigers
Our study began with a preliminary reconnaissance to produce a distribution map of tigers based on the presence of secondary evidence of tigers (e.g., tracks, scat, and scrapes). We divided the entire study area into 1×1 km grids and selected 224 grids (based on confirmed presence of tigers). We placed remotely triggered single motion sensitive cameras in each grid. Cameras were placed 5-7 m on either side of the trail and the mean distance between two cameras was 0.67 (0.33-0.92) km. We placed cameras at the same sampling location in each grid throughout the sampling period. The motion-sensitive cameras were deployed close to animal trails and forest roads to maximize capture probability, covering an area of 233 km2 from November 2007 to February 2011 (Fig. 1) in the winter session (November to February) to follow standard protocols of camera trapping within a 45 day period to ensure temporal closure (Karanth & Nichols, 2002). Owing to technical problems (i.e., theft and breakage by local villagers), the number of sampling points varied from 165 to 224 during sampling periods, but the overall sampling area (233 km2) was always covered with ≥165 cameras. We sampled each grid for 20-25 nights for each camera session (Singh et al., 2014b). All trapping sites were checked twice a week in each study period so that we could download pictures and change batteries and film.
We used a combination of 100 remotely triggered cameras (20 active infrared systems [TrailMaster® TM1550; Goodson Associates, Lenexa, KS, USA], 80 digital passive infrared systems: 40 Wildview [Wildview, Grand Prairie, TX, USA], 20 Stealth Cam [Stealth Cam, Grand Prairie, TX, USA], and 20 Moultrie systems [Moultrie Game Feeders, Alabaster, AL, USA]). We connected each TrailMaster unit to two fully automatic 35 mm cameras (Canon A1 Mini DX; Canon, Tokyo, Japan) with auto flashes fitted with a multi-trigger device, which simultaneously fired the two cameras to take pictures of both flanks of an animal. We placed the digital passive infrared cameras on either side of the roads. As we used different types of passive cameras, there were differences in their sensor sensitivity (detection times); thus, we placed the cameras approximately 5-7 m from the center of the road. Because each camera had a unique detection zone that required an animal to move within a horizontal zone for the sensor to detect heat and movement, we placed cameras such that each camera had sufficient time to detect the animal and take a full frame picture. Each passive camera was programmed to take three pictures with a gap of three seconds. This system enabled us to photograph mating pairs and females with cubs.
Data analysis
Assessing changes in tiger population and demography
We identified individual tigers in photographs by examining the stripe patterns on the flanks, limbs, and forequarter (Karanth, 1995), and determined sex after evaluating the secondary sexual traits (i.e., genital portion) in photos. We developed the capture histories of individual tigers in a standard matrix format, with rows representing the capture histories of captured individuals and columns representing the sampling occasions (Otis et al., 1978). The annual abundance (N) for different age segment in the population was based on: (i) breeding adults (i.e., males and females >3 years old) and (ii) non-breeding individuals (<3 years old). We used the MARK 8.0 program (White, 2008) to estimate the population size of each segment. All analyses excluded cubs (<1 year) because of their low probability of being photographed (Karanth & Nichols, 1998). The population closure was tested using program CloseTest (Stanley & Burnham, 1999). We also calculated the yearly sex-ratio (number of males/female) of each age category. We calculated the population growth by estimating the Rreal (Skalski et al., 2010) with a fractional increase or decrease in abundance from one year to the next;
Estimation of annual densities
We used maximum likelihood implementation of spatially explicit capture recapture (SECR) models in the program DENSITY 5.2 (Efford, 2010; www.otago.ac.nz/density, accessed 12 Apr 2020) to estimate the tiger density of different age categories. The analysis evaluated two files collected with cameras, with each detector’s (camera’s) identification number in one file and geographic coordinates compiled in another file of photo histories, including animal identification, capture occasion (day), and detector. SECR models do not require the use of effective photo areas as used in traditional density estimation (Efford & Boulanger, 2019). SECR estimates the density based on the potential animal activity centers in a sampled area using camera locations. The spatial detection function was modeled by a detection probability (g0) at the activity center and a spatial scale detection (σ) reflecting the animal movement function (Borchers & Efford, 2008). The g0 of animals decreases with increasing distance from the activity center (Efford, 2004). The σ is related to the home range and the density is distance-dependent, as density decreases with an increase in σ or animal movement from its activity center (Efford et al., 2016). We used a half-normal spatial detection function for modeling, using a buffer of 10 km width around the camera stations. We selected this distance to ensure the coverage of the activity center of all animals that could have been exposed to the cameras, corresponding to 2-3 times the estimator for σ (Royle et al., 2014). We knew the sex and age of every individual and estimated density in each age category; therefore, we used a null model with no covariates to calculate g0 (.) and σ (.) for density estimates.
Results
Sampling effort
We obtained 577 photographs of 40 individual tigers from 16,110 trap nights in winter from November 2007 to February 2011, within an area of 233 km2 (Table 1). The number of unique individuals photographed varied from 23 to 32 during different sampling periods (Table 1). We identified 19 males and 21 females. The closure test confirmed that the population was closed during the sampling periods (Supplementary Table 1).
Change in tiger abundance and demography
The tiger abundance was estimated to be the highest (34.9±3.8 individuals) in 2007-2008, whereas lowest abundance (23.9±1.5 individuals) was determined in 2010-2011, with the observed annual growth ranging from 0.80 to 0.99 (χ̅ =0.88±0.06) during the sampling period (Table 2). The abundance of breeding (adult) and non-breeding males increased but varied highly, whereas that of breeding and non-breeding females remained stable and showed low variability (Table 2). The breeding tigers (adult >3 years) accounted for 68.8% of the total population (range=47.1-95.8%, coefficient of variation [CV]=0.31); 27% were males (range=14.7-41.7%, CV=0.50) and 41.8% were females (range=32.4-54.1%, CV=0.21) (Fig. 2). Non-breeding tigers accounted for 31.2% of the population (range=4.2-52.9%, CV=0.67): 25.7% were males (range=16.1-35.3%, CV=0.37) and 11.9% were females (range=4.2-17.6%, CV=0.52) (Fig. 2).
Sex ratio
There was a significant difference in the yearly sex compositions during the sampling period. Adult sex ratio varied yearly from 0.18 males/female in 2007 to 0.77 males/female in 2011 (Table 2). The overall sex ratio was female-biased (0.58±0.13 males/female) for breeding adults, but male-biased for non-breeding tigers (sub-adult=1.8±0.17 males/female, juvenile=1.52±0.17 males/female).
Annual change in population density
After the year 2005, the level of protection in RTR was increased and the tiger density gradually increased from 2.3±0.9 tigers per 100 km2 in 2005 (Singh et al., 2021) to 7.33±1.37 tigers per 100 km2 in 2007 (Fig. 3). The density of tigers (per 100 km2) was estimated to be the highest (7.85±1.45) in 2008 and lowest (4.72±1.01) in 2011 (Fig. 3). The densities of breeding and non-breeding male tiger fluctuated, whereas those of breeding and non-breeding female remained stable during 2007-2011 (Fig. 3).
Discussion
Recovery pattern of tigers
Demographic parameters are the best monitoring measures for assessing the recovery of endangered species (Trimble et al., 2009). Following the decline of the tiger population in RTR in 2004 (Sharma & Wright, 2005), the Forest Department increased the level of protection via forest patrols and the resulting control on poaching enabled the rapid recovery of the tiger population in RTR. The tiger density increased threefold during the recovery period since 2005 in RTR and remained stable after 2007. The fluctuations in density between 2007 and 2011 possibly occurred at the carrying capacity, and recruitment replaced mortality and emigration (Singh et al., 2015a; 2015b; 2021). The cubs born during 2010-2011, would have contributed to the population as adults, resulting in increased density (5.68-7.22 tigers/100 km2) being reported after this study from 2012 to 2014 (Sadhu et al., 2017; Supplementary Fig. 1). RTR supports a high density of wild prey biomass (6,429.8 kg/km2; Bagchi et al., 2003), enabling a high tiger density. The reserve comprises a productive grassland habitat that supports abundant prey and predator populations (Karanth et al., 2004).
Variation in tiger abundance
The tiger population in RTR included 68.8% breeding and 31.2% non-breeding tigers. These findings are similar to those from RCNP, Nepal, where the population is composed of 45% breeding individuals and 55% non-breeding individuals (Barlow et al., 2009). In RTR, fluctuations in the young non-breeding tiger population arise from infanticide, dispersal, natural causes, and anthropogenic mortality, which have been documented by other researchers among other large carnivore populations (i.e., tigers and lions; Banerjee & Jhala, 2012; Packer & Pusey, 1983; Smith et al., 1987). The infanticide and anthropogenic-related mortality in RTR during the first year of the life of tigers is low (15%; Singh et al., 2014c), compared with the reported mortality rate of 34% for tigers in RCNP (Smith & McDougal, 1991), and 53% reported for Amur tigers (Kerley et al., 2003). Overall, fires, floods, anthropogenic-related mortalities, poaching of mothers, and infanticides, have been shown to cause the mortality of tigers in their first year (Smith & McDougal, 1991).
The mortality rate of juvenile tigers was much lower (6%) in RTR (Singh et al., 2014c) than that for tigers in RCNP (Smith & McDougal, 1991). Dispersal, territorial fights, retaliatory killings, and translocations were the underlying causes of the loss of sub-adult tigers in RTR (Singh et al., 2015a). Mortality due to natural causes accounted for 16% of mortalities of Amur tigers (Goodrich et al., 2008). Karanth & Stith (1999) reported that the natural mortality (through aggression, hunting injuries, and starvation) of tigers contributed to 10-25% of overall mortality. The probability of sub-adult males attaining the age of breeding was 39% in RTR, similar to that (40%) for tigers in Nepal (Smith, 1993), and for Amur tigers (32%, Goodrich et al., 2008).
The variation in abundance corresponded to variations in population demography and growth rate, providing insights into the dynamics of a recovering tiger population. The estimated growth rates for tigers in RTR showed a declining trend and mean annual change of overall abundance of −12% for the population. The declining trend in population was influenced by the loss of non-breeding tigers, whereas the adult tiger population was comparatively more stable. Our results are similar to those of reports on tigers in RCNP (Barlow et al., 2009) and lions in Kenya (Ogutu & Dublin, 2002). The adult female abundance was stable across the sampling duration and we observed an increasing population growth rate. The annual change in the abundance of male tigers varied as compared with that of females; loss of female tigers was 35.3% and loss of males was 64.7% in RTR. Similar observations have been recorded in Nepal (Barlow et al., 2009). The female tenure over time is a useful interim indicator of population stability. This indicator can also provide insights into the effectiveness of recovery efforts (Harihar et al., 2020). The estimated growth rate observed for the tiger population was much lower than expected based on the values from Corbett, Nagarhole, and Pench tiger reserves in India, the Terai arc landscape, Nepal, and the Russian Far East, with an annual increase of 3-21% (Bisht et al., 2019; Karanth et al., 2006; Majumder et al., 2017; Miquelle et al., 2015; Thapa et al., 2017).
The sex ratio was female-biased for breeding tigers, whereas it was male-biased for non-breeding tigers in RTR. Similar sex ratios of adult tigers have been reported in Corbett (Bisht et al., 2019) and Pench, India (Majumder et al., 2017), and RCNP, Nepal (Smith, 1993). During carnivore species dispersal, the natural and anthropogenic mortalities of young or sub-adult males are important causes of changes in sex ratio, as reported from the Pench Tiger Reserve (Majumder et al., 2017), RCNP (Sunquist, 1981), and for Amur tigers in the Russian Far East (Goodrich et al., 2008). The female-biased sex-ratio in RTR is consistent with the general hypothesis that female tigers are philopatric and tend to stay near their natal area (Smith, 1993), whereas males disperse.
With the increase in the tiger population from 2005 to 2007 in RTR, human–tiger conflicts increased (Singh et al., 2015a). Hence, mitigation and preventive measures need to be initiated to eliminate retaliatory killing. This population faces poaching, so protection activities (i.e., anti-poaching efforts and increased patrols) should continue. Enhancing the quality of neighboring habitats and development of dispersal corridors or restoration of potential connectivity between the landscapes should be promoted to create more space for dispersing individuals over the landscape.
Acknowledgments
We thank the Director and Dean of the Wildlife Institute of India for their continuous support. We thank the Rajasthan Forest Department, Park officials, and field staff at RTR for permissions that facilitated this work. We especially thank our field assistants, M. S. Gurjar and S. Sharma, for the continuous support during field work. The Training, Research and Academic Council (Ministry of Environment, Forests and Climate Change, Government of India) provided financial support for this work.
Author Contributions
Conceptualization: Randeep Singh, Surendra Prakash Goyal, Paul R. Krausman, Data curation: Randeep Singh, Puneet Pandey, Formal analysis: Randeep Singh, Surendra Prakash Goyal, Paul R. Krausman, Funding acquisition: Surendra Prakash Goyal, Qamar Qureshi, Kalyanasundaram Sankar, Methodology: Randeep Singh, Surendra Prakash Goyal, Qamar Qureshi, Paul R. Krausman, Resources: Surendra Prakash Goyal, Qamar Qureshi, Kalyanasundaram Sankar, Software: Surendra Prakash Goyal, Qamar Qureshi, Kalyanasundaram Sankar, Paul R. Krausman, Supervision: Surendra Prakash Goyal, Qamar Qureshi, Kalyanasundaram Sankar, Paul R. Krausman.
Figures and Tables
Fig. 1
Location map of study area including the intensive monitoring area of tigers in Ranthambhore Tiger Reserve, India, 2007-2011.
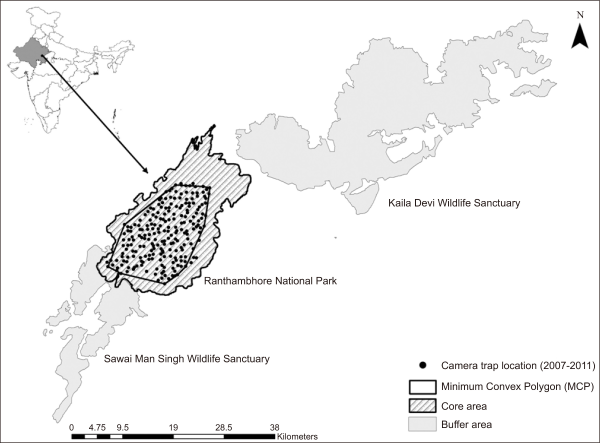
Fig. 2
Contribution of different age segments of tigers (i.e., breeding [adult >36 months] and non-breeding [12-36 months] males and females) to the population in Ranthambhore Tiger Reserve, western India during 2007-2011. Values in parentheses are the population sizes of individuals older than 12 months.
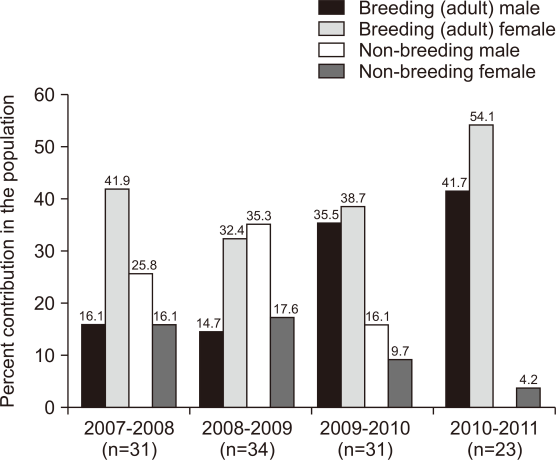
Fig. 3
Variation in tiger density (total population (>12 months old), breeding males and females (>36 months old), and non-breeding males and females <36 months (excluding cubs <12 months) from 2007 to 2011 in Ranthambhore Tiger Reserve.
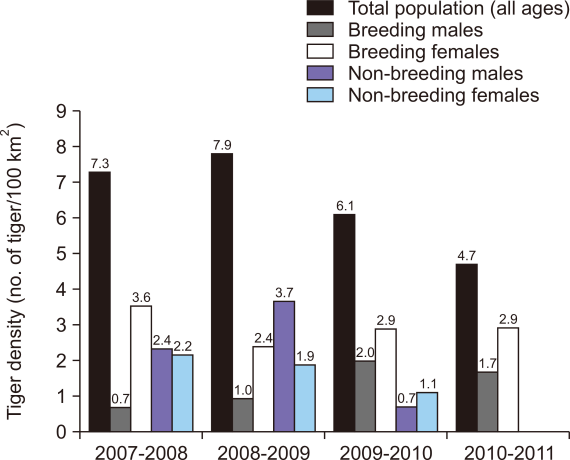
Table 1
Details of sampling effort during the study period from 2007 to 2011 in Ranthambhore Tiger Reserve, India
| Parameters | 2005* | 2006† | 2007-2008 | 2008-2009 | 2009-2010 | 2010-2011 |
|---|---|---|---|---|---|---|
| Sampling days | Apr to May 2005 | Nov 2007 to Feb 2008 | Dec 2008 to Mar 2009 | Jan 2010 to Mar 2010 | Dec 2010 to Feb 2011 | |
| Sampled area (km2) | 140 | 233 | 233 | 233 | 233 | |
| No. of trap nights | 358 | 4,480 | 3,880 | 3,300 | 4,450 | |
| No. of trapping stations | 30 | 224 | 194 | 165 | 178 | |
| Trapping occasion at a location | 15 | 20 | 20 | 20 | 25 | |
| Photo-captures used for analysis | 31 | 139 | 151 | 122 | 165 | |
| No. of individuals tigers captured (Mt+1) | 14 | 31 | 32 | 27 | 23 | |
| Breeding male | 4 | 5 | 5 | 10 | 10 | |
| Breeding female | 10 | 13 | 10 | 10 | 12 | |
| Non-breeding male | 8 | 11 | 4 | 0 | ||
| Non-breeding female | 5 | 6 | 3 | 1 | ||
| Total cubs reported | 5 | 13 | 12 | 4 | 0 | 12 |
| Tiger abundance | 14 (2.9) | 34.9 (3.8) | 34.7 (3.5) | 30.02 (3.7) | 23.9 (1.5) | |
| Tiger density | 2.3 (0.9) | 3.2 (1.0) | 7.33 (1.37) | 7.85 (1.45) | 6.10 (1.23) | 4.72 (1.01) |
Table 2
Estimates of abundance (N), observed population growth rate (λO), and sex ratio (males/female) for the tiger population in Ranthambhore Tiger Reserve, India, 2007-2011
| Sampling period |
Total population | Breeding adult | Non-breeding | ||||||||||||||
|---|---|---|---|---|---|---|---|---|---|---|---|---|---|---|---|---|---|
|
|
|
|
|||||||||||||||
| N (SE) | λO | Male | Female | Sex ratio (M/F) | Sub-adult | ||||||||||||
|
|
|||||||||||||||||
| Male | Female | Sex ratio (M/F) | |||||||||||||||
|
|
|
|
|
||||||||||||||
| N (SE) | λO | N (SE) | λO | N (SE) | λO | N (SE) | λO | ||||||||||
| 1 | 34.9 (3.8) | 2.0 (0.1) | 11.0 (0.1) | 0.18 | 3.0 (0.3) | 2.0 (0.1) | 1.50 | ||||||||||
| 2 | 34.7 (3.5) | 0.99 | 5.0 (0.1) | 2.50 | 10.9 (1.4) | 0.99 | 0.46 | 8.0 (0.4) | 2.67 | 4.0 (0.3) | 2.00 | 2.00 | |||||
| 3 | 30.02 (3.7) | 0.87 | 10.9 (1.4) | 2.18 | 11.9 (3.5) | 1.09 | 0.92 | 4.0 (1.3) | 0.50 | 2.0 (0.2) | 0.50 | 2.00 | |||||
| 4 | 23.9 (1.5) | 0.80 | 10.0 (0.1) | 0.92 | 13.0 (0.1) | 1.09 | 0.77 | 1.0 (0.1) | 0.50 | ||||||||
| 0.88 (0.06) | 1.87 (0.48) | 1.06 (0.03) | 0.58 (0.13) | 1.58 (1.08) | 1.0 (0.5) | 1.8 (0.17) | |||||||||||