Introduction
The rare Korean long-tailed goral (Naemorhedus caudatus) is included in the genus Naemorhedus of Rupicaprini under the subfamily Caprinae with the other two goral species, Naemorhedus goral (Himalayan goral) and Naemorhedus baileyi (red goral) (Min et al., 2004). This species has been considered as an endangered species (Ministry of Environment of Korea, 2004), natural monument (No. 217; Cultural Heritage Administration Korea, 1999) in South Korea, an endangered species (IUCN, 1996), and non-commercial trade species (CITES; Hutton & Dickson, 2000) globally. Historically, the Korean goral population size has declined for two reasons, namely overexploitation and habitat destruction (780-800 individuals, Ministry of Environment of Korea, 2002; Yang, 2002). Moreover, in recent years, the goral populations have been affected by habitat fragmentation.
Fragmentation decreases the connectivity between habitats and, therefore, prevents gorals from migrating between resource patches and mating with genetically heterogeneous individuals, such as those from other species (Coulon et al., 2004; Taylor et al., 1993). This change can negatively affect wild animals due to reduction of gene flow between populations leading to greater inbreeding and loss of genetic diversity within fragmented habitats (Coulon et al., 2004; Frankham et al., 2002). Finally, this fragmentation can lead to the extinction of species (Burkey, 1989; Coulon et al., 2004; Soule et al., 1992). In South Korea, such population studies have rarely been conducted on the fragmentation effect of the endangered Korean gorals using microsatellite markers.
Microsatellites have developed into one of the most common genetic markers during the past few decades. Microsatellite makers have up to 10–6 to 10–2 mutation rates per generation, which are significantly higher than base substitution rates (Schlotterer, 2000). Up to now, three microsatellite studies using invasive samples (e.g., tissue, blood) existed on the Korean goral in South Korea (An, 2006; An et al., 2005; Kim et al., 2004). For the first step of microsatellite study, 36 Bovidae microsatellite markers for cross-species amplification were tested on the Korean goral (Kim et al., 2004). An et al. (2005) then developed 15 sets of the Korean goral-specific microsatellite markers, which were utilized to estimate genetic diversity of the species. Later, more microsatellite markers including the 15 makers were applied to not only the Korean goral but also the Japanese serow, a closely related sister genus (An, 2006). These goral studies dealt with secret genetic diversity, but not with other characteristics of the species, such as individual identification, population structure, and so on. Recently, additional studies have rarely been conducted on the endangered Korean species. The major reason is difficulty of sampling in the wild due to the nature of the elusive Korean goral.
Acquisition of rare, endangered, or cryptic animal samples is logistically difficult to collect in the wild. Therefore, recent molecular genetics have applied non-invasive samples to overcome several sampling constraints (Kohn & Wayne, 1997). Among the non-invasive samples, fecal samples are greatly attractive as a source of DNA because of the ease of sampling and the potential for unprecedented sample size (Wehausen et al., 2004). However, non-invasive samples also have restrictions, such as copurifying contaminants, low amounts of DNA, and DNA degradation (which cause non-amplification), allele dropout, false allele, and sporadic contamination (Fernando et al., 2003). To overcome these problems, researchers attempted sample preservation, DNA extraction, DNA amplification, and the multiple-tube approach (Taberlet et al., 1999). To date, a variety of non-invasive studies have been conducted for endangered species globally (Waits & Paetkau, 2005). Microsatellite markers have been used to address research questions related to genetic diversity, gene flow, paternity, and social structure (Waits & Paetkau, 2005). Non-invasive genetic studies using microsatellite markers have rarely been conducted on such topics for the Korean goral, except a recent microsatellite genotyping study that assessed the genetic integrity and individual identification-based population size for the goral population from Seoraksan National Park representing one of the largest wild populations in South Korea (Jang et al., 2020). However, the study did not apply any multiple-tube approach that can decrease potential error rates derived from allele dropout, false allele, and so on. Therefore, it is essential to apply the multiple-tube approach to study the Korean goral. This study applied such an approach for their individual assignment, for the first time to the best of our knowledge.
The goals of this pilot study are 1) to identify each individual; 2) to indicate genetic variation; 3) and to evaluate population differentiation of the endangered Korean goral using fecal samples collected from the captive and wild population.
Materials and Methods
Samples and DNA extraction
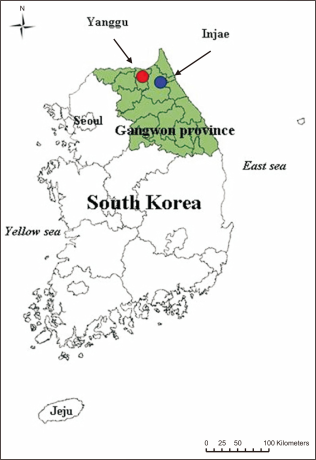
All goral fecal samples were collected from a goral farm, Yanggu (n=24 deposits) and from the wild, Soraksan National Park, Inje (n=40 deposits), Gangwon province in South Korea (Kim, 2021; Fig. 1). Following sampling, all feces were maintained at –70°C in the Conservation Genome Resource Bank for Korean Wildlife. Genomic DNA was extracted from all the samples using the method followed by Gerloff et al. (1995).
Polymerase chain reaction and genotyping
Of the total 64 fecal deposits, 24 captive and 28 wild fecal samples with correct species identity information were used for microsatellite polymerase chain reaction (PCR) and genotyping (Kim, 2021). Eight goral-specific markers (SY12A, SY50, SY58, SY129, SY17, SY48, SY141, and SY256) developed by An (2006) were applied for PCR and genotyping. Of the eight loci identified, the first six were successfully amplified and used for genotyping. The PCR was first carried out in a 10 µL reaction volume containing 1 µL of DNA template, 0.1 µL of M13 forward primer labelled with 800IR dye (Li-Cor Inc., Lincoln, NE, USA), 1×PCR buffer (iNtRON Inc., Seoul, Korea), 2 MgCl2, 0.2 of each dNTP, 0.1 µM of each primer, 2.5 µg of BSA (Promega Inc., Madison, WI, USA), 1 U of i-Star Taq polymerase (iNtRON Inc.). The PCR amplification reactions were performed in a PTC-100 Thermal Cycler (MJ Research Inc., Watertown, MA, USA) with the following conditions: initial denaturation for 3 minutes at 94°C, followed by 45 cycles (94°C for 60 seconds, 46°C for 45 seconds, and 72°C for 60 seconds) with a final extension for 3 minutes at 72°C. PCR products were resolved by electrophoresis on a 2% agarose gel, stained by ethidium bromide, and visualized under an UV illuminator. After confirming the PCR products of microsatellites, all genotypes were analyzed using a genotyping analyzer (Li-Cor Inc.). Totally, seven and eight genotypes were conducted for the captive and wild fecal samples, respectively, using the multi-tube approach (Taberlet et al., 1996). For reliable genotyping, samples as were labelled heterozygous or homozygous at each locus if both alleles appeared at least four times among the seven or eight replicates, otherwise as missing data.
Data analysis
The numbers of different alleles, expected (HE), and observed (HO) heterozygosity were calculated as indices of genetic diversity in each population using the program GENETIX version 4.05.2 (Belkhir et al., 1996-2004). Tests for genotypic disequilibrium and deviation from the HWE were performed for each locus, following the probability test approach (Guo & Thompson, 1992), using GENEPOP DOS version 3.4 (Raymond & Rousset, 1995). Heterozygosity excess and shift in allelic frequency distributions that would correlate with a recent genetic bottleneck using the program BOTTLENECK version 1.2.02 (Cornuet & Luikart, 1996) was tested. Only the Wilcoxon signed ranks test to obtain probability values for excess levels of heterozygosity due to lack of loci and small sample size was used. Stepwise mutation model (SMM) was used to test for excess heterozygosity. The Fisher’s exact test was used to evaluate the significance of the differences in allele distribution between the Yanggu and Inje population using 1,000 Monte Carlo permutations, and maximum likelihood estimates of Nm (effective number of migrants) according to Slatkin (1985) were calculated by GENEPOP DOS version 3.4 (Raymond & Rousset, 1995). Additionally, the extent of genetic differentiation between the two populations using the FST (Weir & Cockerham, 1984) was quantified using ARLEQUIN version 3.0 (Excoffier et al., 2005). A Bayesian clustering approach was used for multi-locus genotyped data to test alternative models for population subdivision within the Yanggu and the Inje population. The number of subpopulations (K) most probably present within the dataset of microsatellite genotypes was determined by calculating the posterior probability of K populations for K=1, 2 or 3 assuming a uniform prior probability. The fidelity of each of the genotypes to their population sample was then established (Yanggu or Inje) by completing the maximum likelihood assignments with the known population data and the number of populations set to two. These analyses were conducted using the STRUCTURE version 2.1 (Pritchard et al., 2000).
Results
Genotyping success rates of fecal samples from the captive Yanggu and the wild Inje goral population were 74% and 35%, respectively. Frequencies of allele dropout were 2.0% and 1.7%, and those of false allele were 1.2% and 0.2% for the captive and the wild population, respectively. These values are notably low and, therefore, could be accepted for genetic analyses. Table 1 indicates allele frequencies of the six loci used in this study. Excluding monomorphic loci (three for Yanggu; two for Inje; one for total population), each goral individual could be identified. Four and six different goral individuals from the captive Yanggu (n=24) and the wild Inje (n=28) fecal samples, respectively were detected (Table 2). Among the 10 individuals, KG01, KG03, KG04 and KG10 were detected at least three times, however the others, KG02, KG05, KG06, KG07, KG08 and KG09, were only detected once (Table 2).
Genetic diversity was measured in terms of the number of alleles, whereafter observed and expected heterozygosity was determined (Table 3). SY58 included five different alleles but SY48 was monomorphic for the total population (Table 1). The number of alleles was 1.66 and 3.67 alleles/locus for the Yanggu and Inje population, respectively, while the average number of alleles in the pooled samples of all animals was 3.16 alleles/locus. Of the total 19 alleles, seven (36.8%) alleles were shared by the two populations. Only three (15.8%) and nine (47.4%) unique alleles were detected from the Yanggu and the Inje population, respectively (Table 1). Except SY17, all loci showed no significant deviation against HWE (Table 3). On SY17, the observed heterozygosity was lower than the expected heterozygosity under HWE, and statistically significant departures reflected the deviation in the direction of heterozygote deficit (P<0.05). The presence of linkage disequilibrium between six microsatellite loci could not be examined (P>0.05).Fig. 2
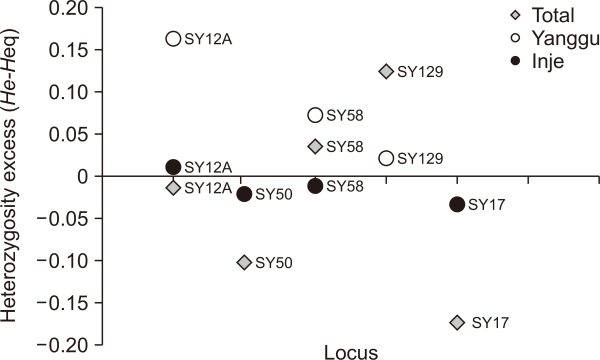
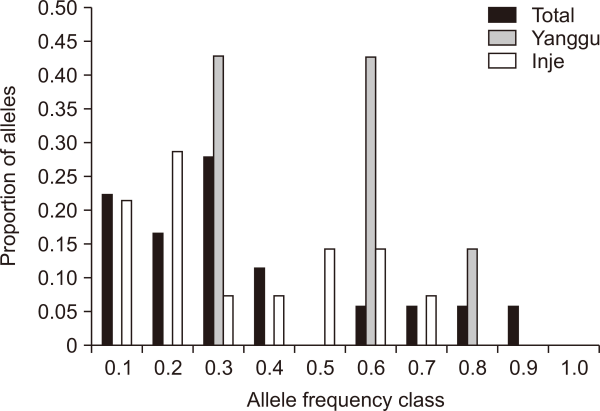
Heterozygosity excess test results under the SMM model provided no evidence for recent population bottlenecks in each population including the total population. No population deviated significantly from mutation-drift equilibrium levels of heterozygosity (Wilcoxon test, P>0.05 for all populations). However, bottleneck tendency of the Yanggu population is much clearer than that of the Inje population (Fig. 3). All the heterozygosity excess values were positive in the Yanggu (100.0%) but only one value was positive in the Inje (25.0%) population (Fig. 3). Heterozygosity excess was from 0.020 to 0.162 for the Yanggu, and from –0.035 to 0.009 for the Inje population (Fig. 3). In addition, the allele frequency distribution in the Yanggu population showed a mode shift to the right, indicating that a putative bottleneck may have occurred in the Yanggu population (Fig. 4). The other population produced a normal L-shaped distribution (Fig. 4).
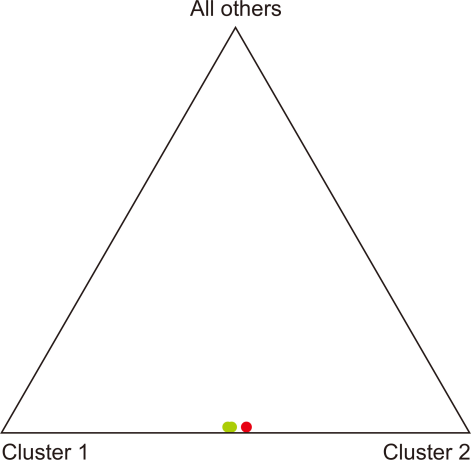
The null hypothesis “the allele distribution is identical across populations” was rejected for the two populations in South Korea (Fisher’s exact test: P<0.01; Data not shown). A notably low migration rate between the two populations (No. of migrants after correction for size=0.294) was observed. Additionally,, the result of the FST value showed a significant differentiation between the Yanggu and the Inje population (FST=0.327, P<0.01). However, the posterior probabilities calculated from data of the two populations indicated that the samples are from a single panmictic population (P=0.959) but not from two populations (P<0.001) (Fig. 4). In addition, assignment test results designated almost all individuals to both the Yanggu and the Inje population with nearly equal likelihoods.
Discussion
As a pilot study, genotyping data was successfully analyzed from non-invasive fecal samples from a captive population of gorals. Using the background data, fecal samples from a wild population was sequentially analyzed. The total success rate of genotyping was lower than 50% but successfully identified 10 goral individuals. Four and six individuals were detected in Yanggu and Inje, respectively. Thus, we could observe only four individuals (one adult female, one adult male, and two juveniles) in the captive population of Yanggu before fecal sampling. Therefore, it is clear that the present experimental approach would be very correct. No significant difference between the captive and the wild population was detected for allele dropout and false allele. These values were notably low and, therefore, could be accepted for all genetic analyses. This study is the first to conduct individual assignment of the Korean goral via the multiple-tube approach using non-invasive fecal sampling based on nuclear microsatellite genotyping. Jang et al. (2020) also reported a result of individual identification based on a non-invasive genetic sampling; however, they did not apply multiple PCR replicates to avoid possible genotyping errors during data collection (Miquel et al., 2006; Navidi et al., 1992).
The Korean goral samples assessed in this study were found to have levels of allele diversity and heterozygosity that are among the lowest reported in other ungulate species with a history of isolation or bottlenecks, such as Asian water buffalo population, Bubalus bubalis (Barker et al., 1997), a founded moose population, Alces alces (Broders et al., 1999), Spanish Celtic horse population, Caballus cabalus (Canon et al., 2000), and Swaynes’s hartebeest population, Alcelaphus buselaphus swaynei (Flagstad et al., 2000). According to previous studies (An et al., 2005; Kim et al., 2004), the Korean goral population revealed similar levels of allele diversity and heterozygosity to such studies (An et al., 2005; Kim et al., 2004). Kim et al. (2004) showed that the mean number of alleles per locus was 2.6 and the average observed heterozygosity was 0.36 from 29 captive and wild goral populations. Also, An et al. (2005) reported very low allele diversity (4.6) and observed heterozygosity (0.44) from 20 goral samples. The present results (mean number of alleles=3.16, mean heterozygosity=0.38) are very close to genetic diversity patterns of the previous studies.
Low genetic diversity (allele richness and heterozygosity) could be evidence of genetic bottlenecks in populations that have experienced severe population declines (Norton & Ashley, 2004). The spooled total population did not indicate the heterozygosity excess expected and the allele frequency mode shift observed in the population that has experienced recent bottlenecks (Figs. 3, 4). However, the heterozygosity excess and the allele frequency mode shift were found in the Yanggu but not in the Inje population (Figs. 3, 4). This suggests that any putative bottleneck would have occurred within 50 years (25 generations) ago. The only known bottleneck events occurred under winter heavy snowfalls in Gangwon province, South Korea. Thousands of gorals were illegally hunted by local people near human settlements, along with habitat destruction and fragmentation. The occurrence of bottleneck events in the past would significantly decrease the number of alleles in the species. Following such an event, several generations of increased inbreeding created by the rapid decline in effective population size would reduce heterozygosity until reaching a drift-mutation equilibrium state consistent with the number of alleles that remain in the population.
Previous population genetic studies reported that populations that are not able to recover their population size quickly following a bottleneck will experience a greater loss of genetic variation and take longer to recover heterozygosity (Norton & Ashley, 2004). For examples, elk (Williams et al., 2002), wallaby (LePage et al., 2000), and African elephants (Whitehouse & Harley, 2001) have experienced severe bottleneck events, restricted population growth, and gene flow due to loss of habitat and continued pressure from hunting. Their populations clearly indicated the extremely low levels of genetic diversity. For the Korean goral, illegal hunting, habitat loss, and fragmentation have continuously occurred due to the developmental policy of the local and the South Korean government.
As evidence of a high level of fragmentation following bottleneck events in the Korean goral, Yanggu and Inje populations showed clear differentiation in their population structure. Both Fisher’s exact test and F statistics revealed a significant value for the population structure. Moreover, a notably low migration rate was found between the two populations. Each population has been isolated by various types of anthropogenic barriers, such as agricultural areas, settlements, and local highways or roads. The Inje population, in particular, surrounded by several local highways was strictly isolated from other populations, similar to an island. Although the two populations are adjacently located, fragmentation effects after bottlenecks may result in such population differentiation.
However, the two populations are more likely to have originated from a single panmictic population. Based on the results from the program STRUCTURE, no clear population differentiation was detected between the two populations. Also, all individuals were assigned to both populations with very similar likelihoods. According to previous studies (Maudet et al., 2002; Norton & Ashley, 2004), the program STRUCTURE has provided reduced effectiveness in correctly assigning individuals to populations because of non-considerable population differentiation. Historical population bottlenecks events by hunting, habitat destruction, and fragmentation could be putative reasons for low genetic diversity in the total population and for population differentiation between the populations of the Korean goral. This non-invasive study showed a preliminary genetic pattern of the endangered goral populations. A more extensive set of loci and fecal sampling from various goral populations could be helpful to establish clear conclusions.
Acknowledgments
This work was supported in part by Korea Environment Industry & Technology Institute through Development of modeling for forecasting expansion and risk assessment of alien species, funded by Korea Ministry of Environment (MOE) (No. 20180022700013), and by the National Institute of Ecology, funded by Korea MOE (No. NIE-B-2022-12). This work was also partially supported by the Research Institute for Veterinary Science and the Brain Korea 21 Program for Veterinary Science, Seoul National University. We thank professor H. Lee and professor Y. J. Won for helping in conducting this experiment. We also thank many field surveyors in collecting fecal samples of Korean gorals.
Figures and Tables
Fig. 2
Pattern of heterozygosity excess observed at each of polymorphic microsatellite loci in total, Yanggu and Inje populations using the stepwise mutation model. The horizontal line represents the boundary between heterozygote excess (above the line) and heterozygote deficiency (below the line).

Fig. 3
Allele frequency distributions of spooled total, Yanggu, and Inje population for all loci genotyped.

Fig. 4
Summary of the clustering results for the Korean goral data assuming two populations. Each point shows the mean estimated ancestry for an individual in the sample.

Table 1
Allele frequencies of the six loci used in this study
| Locus | Allele | Yanggu | Inje | Total |
|---|---|---|---|---|
| SY12A | 175 | 0.333 | 0.200 | |
| 189 | 0.083 | 0.050 | ||
| 197 | 0.500 | 0.583 | 0.550 | |
| 203 | 0.500 | 0.200 | ||
| SY50 | 184 | 1.000 | 0.250 | 0.625 |
| 186 | 0.125 | 0.062 | ||
| 188 | 0.125 | 0.062 | ||
| 190 | 0.500 | 0.250 | ||
| SY58 | 187 | 0.083 | 0.050 | |
| 189 | 0.417 | 0.250 | ||
| 195 | 0.500 | 0.083 | 0.250 | |
| 197 | 0.250 | 0.417 | 0.350 | |
| 201 | 0.250 | 0.100 | ||
| SY129 | 138 | 0.750 | 0.300 | |
| 140 | 0.250 | 1.000 | 0.700 | |
| SY17 | 124 | 0.167 | 0.100 | |
| 128 | 0.167 | 0.100 | ||
| 154 | 1.000 | 0.667 | 0.800 | |
| SY48 | 147 | 1.000 | 1.000 | 1.000 |
Table 2
Genotypes for 10 identified individuals from 64 Korean gorals in six loci
| Individual | SY12A | SY50 | SY58 | SY129 | SY17 | SY48 | No. samples | ||||||
|---|---|---|---|---|---|---|---|---|---|---|---|---|---|
| Yanggu (YG) | |||||||||||||
| KG01 | 197 | 197 | 184 | 184 | 195 | 195 | 138 | 140 | 154 | 154 | 147 | 147 | 10 |
| KG02 | 197 | 203 | 184 | 184 | 195 | 201 | 138 | 138 | 154 | 154 | 147 | 147 | 1 |
| KG03 | 203 | 203 | 184 | 184 | 197 | 201 | 138 | 138 | 154 | 154 | 147 | 147 | 3 |
| KG04 | 197 | 203 | 184 | 184 | 195 | 197 | 138 | 140 | 154 | 154 | 147 | 147 | 3 |
| Sub-total | 17 | ||||||||||||
| Inje (IJ) | |||||||||||||
| KG05 | 175 | 197 | 190 | 190 | 189 | 197 | 140 | 140 | 154 | 154 | 147 | 147 | 1 |
| KG06 | 175 | 197 | 184 | 188 | 187 | 195 | 140 | 140 | 154 | 154 | 147 | 147 | 1 |
| KG07 | 175 | 197 | 186 | 190 | 189 | 197 | 140 | 140 | 154 | 154 | 147 | 147 | 1 |
| KG08 | 175 | 197 | - | - | 189 | 197 | 140 | 140 | 124 | 128 | 147 | 147 | 1 |
| KG09 | 197 | 197 | - | - | 189 | 197 | 140 | 140 | 124 | 128 | 147 | 147 | 1 |
| KG10 | 189 | 197 | 184 | 190 | 189 | 197 | 140 | 140 | 154 | 154 | 147 | 147 | 3 |
| Sub-total | 8 | ||||||||||||
| Total | 25 | ||||||||||||
Table 3
Descriptive statistics for 64 fecal samples of the Korean goral populations, including locus
| Locus | Yanggu | Inje | Total | ||||||||||||||
|---|---|---|---|---|---|---|---|---|---|---|---|---|---|---|---|---|---|
|
|
|
|
|||||||||||||||
| N | A | HE | HO | P-value | N | A | HE | HO | P-value | N | A | HE | HO | P-value | |||
| SY12A | 4 | 2 | 0.500 | 0.500 | 1.000 | 6 | 3 | 0.569 | 1.000 | 0.637 | 10 | 4 | 0.250 | 0.800 | 0.549 | ||
| SY50 | 4 | 1 | - | - | - | 4 | 4 | 0.656 | 0.750 | 1.000 | 8 | 4 | 0.539 | 0.375 | 0.246 | ||
| SY58 | 4 | 3 | 0.625 | 0.750 | 1.000 | 6 | 4 | 0.6389 | 1.000 | 0.010* | 10 | 5 | 0.740 | 0.900 | 0.077 | ||
| SY129 | 4 | 2 | 0.375 | 0.500 | 1.000 | 6 | 1 | - | - | - | 10 | 2 | 0.420 | 0.200 | 0.133 | ||
| SY17 | 4 | 1 | - | - | - | 6 | 3 | 0.500 | 0.333 | 0.031* | 10 | 3 | 0.340 | 0.200 | 0.012* | ||
| SY48 | 4 | 1 | - | - | - | 6 | 1 | - | - | - | 10 | 1 | - | - | - | ||
