Introduction
Water birds prefer Korea as a stopover and wintering location because of the country’s favorable geographic conditions. It is reported that over 1,340,000 domestic water birds overwintered as of 2020 (National Institute of Biological Resources [NIBR], 2020). The spot-billed duck is the third most abundant species of ducks in Korea (NIBR, 2020). However, the spot-billed ducks peaked in 2000 and currently has 100,000 (NIBR, 2020). The spot-billed ducks prefer eating on farmland, despite their primary habitats being rivers, lakes, and reservoirs (Stafford et al., 2010). The average daily distance traveled by the spot-billed duck is 1.0±0.89 km, with a maximum of 23 km (Shin et al., 2016c). Factors such as food resources, the quantity of food, and human interference influence the migration routes of the spot-billed ducks (Davis & Afton, 2010; Kang et al., 2014; Shin et al., 2016a). Typically, the spot-billed duck spends the day resting in lakes and rivers and the night foraging in fields (Baldassarre & Bolen, 1994). The spot-billed duck has a sustainable breeding population in Korea. However, most research on the spot-billed ducks has been conducted during winter. Therefore, this study aimed to elucidate the home range and habitat use of spot-billed ducks in spring to protect and manage this species.
Materials and Methods
Study areas
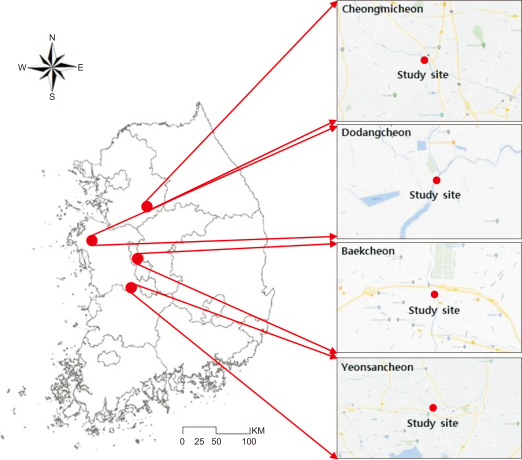
The GPS-mobile phone-based telemetry (WT-300: 22 g) was attached to four locations for this study: Cheongmi stream in Anseong-si Gyeonggi-do, Dodang stream in Seosan-si Chungcheongnam-do, Yeonsan stream in Nonsan-si, and Baek stream in Sejong-si (Fig. 1). WT-300 was attached to six spot-billed ducks (three in Cheongmi streams and one each in Baek stream, Dodang stream, and Yeonsan stream). GPS acquired location information 12 times per day at 2 hours intervals. Data were analyzed from March 1 to May 31, 2022. Five (SB1, SB2, SB3, SB5, and SB6) of the six spot-billed ducks were tracked for 92 days, while one (SB4) was tracked for 58 days (Table 1).
Home range analysis
The analysis methods employed were the minimum convex polygon (MCP) and kernel density estimation (KDE). The home range determination strategy used a KDE method with three steps (90%, 70%, and 50%), where the MCP was set at 100%. By following the standard research method, we divided the calculated home range by 50% to determine the core habitat (Kauhala & Autttila, 2010).
Habitat use
The habitat classification was based on the land cover map (2020) issued by the Ministry of the Environment. The ecology of the spot-billed duck and the findings of previous studies were utilized to reclassify the study area into wetlands, rice fields, and other fields. The habitat utilization rate was categorized by time into all (24 hours), daytime (06:00-18:00 hours), and night time (20:00-04:00 hours). The average springtime sunrise and sunset were used to determine the day and night standards (Table 2).
Results
Home range analysis
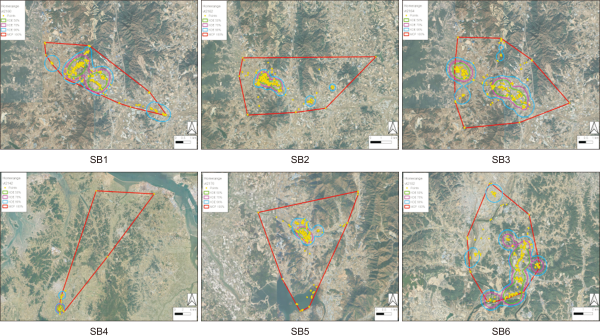
The MCP analysis of six spot-billed ducks revealed an average home range of 70.28 km² (standard deviation [SD]=84.50, n=6). KDE showed that 90% of 9.96 km² (SD=9.25, n=6) and 70% of 4.91 km² (SD=5.10, n=6) were used, whereas core habitats (50%) was 2.66 km² (SD=2.60, n=6) (Fig. 2, Table 3).
Habitat utilization rate
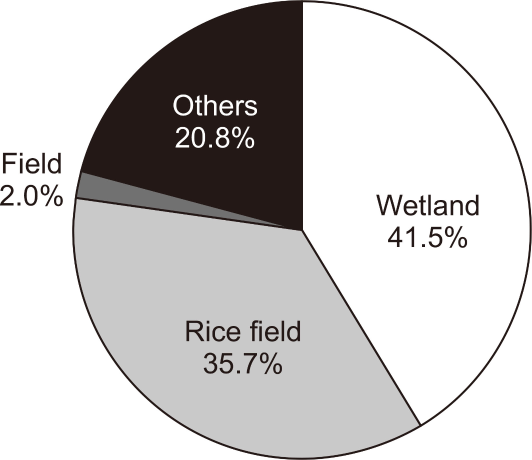
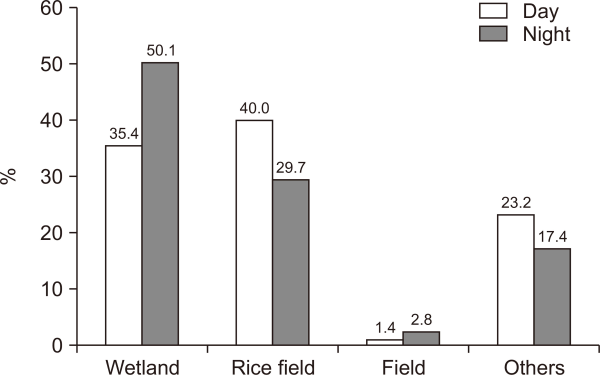
Fig. 3Analysis of the habitat utilization rate of the spot-billed ducks demonstrated that wetlands (41.5%) had the highest utilization rate, followed by rice fields (35.7%) and others (20.8%). During the day, rice fields (40.0%) were used the most followed by wetlands (35.4%) and others (23.2%). However, wetlands (50.1%) were used the most at night, followed by rice fields (29.7%) and others (17.4%). Therefore, rice fields were used more during the day, whereas the wetlands were most utilized at night (Fig. 4).
Discussion
The winter home range (KDE 50%) of spot-billed ducks includes more urban than rural areas (Hwang et al., 2016). From these findings, we conclude that the spring home range (KDE 50%) of the spot-billed duck was similar to that of the rural areas and smaller than in urban areas (Hwang et al., 2016). Spot-billed ducks, like other duck species, show differences in mobility and home range depending on environmental and anthropogenic factors (Davis & Afton, 2010; Kang et al., 2014; Yoo et al., 2008). A limited home range in the spring allows for the provision of food and a hiding spot according to the grass Therefore, they used a small home range and avoided extensive travel during the spring.
Wetlands (41.5%) and rice fields (35.7%) were found to be highly utilized by spot-billed ducks. The utilization rate of rice fields was high during the day, whereas that of wetlands was high at night. This was comparable to the wintertime habitat usage rate in rural areas (Hwang et al., 2016). The spot-billed ducks typically inhabit wetlands and rice fields during spring and winter. Thus, wetlands and rice fields are important habitats for spot-billed ducks. Recently, spot-billed ducks were the third largest population of wintering ducks in Korea, but their numbers haves been declining continuously over the past decade (NIBR, 2020). This decrease in population is attributable to habitat changes (Shin et al., 2016b). Wetland conservation efforts are critical to ensure the survival of native species and maintain a steady domestic breeding population. Although this study analyzed the habitat and home range of spot-billed ducks in spring, further research is necessary. The findings of this study can serve as fundamental data to protect spot-billed ducks by managing two of their crucial springtime habitats, rice fields and wetlands.
Figures and Tables
Fig. 2
Spot-billed duck (Anas poecilorhyncha) Home range (dotted line is minimum convex polygon and contours represent 90, 70, 50% from outside line, respectively).

Table 1
Summary information of 6 spot-billed ducks (Anas poecilorhyncha)
| Study areas | No | Weight (g) | Tracking period | No. of GPS fixed |
GPS fixed time/day |
Battery lifespan |
|---|---|---|---|---|---|---|
| Cheongmicheon | SB1 | 1,310 | 2022.03.01-2022.05.31 | 1,104 | 12 | 92 |
| Cheongmicheon | SB2 | 1,280 | 2022.03.01-2022.05.31 | 1,104 | 12 | 92 |
| Cheongmicheon | SB3 | 1,205 | 2022.03.01-2022.05.31 | 1,104 | 12 | 92 |
| Dodangcheon | SB4 | 1,070 | 2022.03.01-2022.04.27 | 693 | 12 | 58 |
| Yeonsancheon | SB5 | 1,340 | 2022.03.01-2022.05.31 | 1,104 | 12 | 92 |
| Baekcheon | SB6 | 1,045 | 2022.03.01-2022.05.31 | 1,102 | 12 | 92 |
Table 2
Land coverage map (middle classification) reclassification system
| Reclassification | Code | Middle classification |
|---|---|---|
| Wetland | 510 | Inland wetlands |
| 520 | Coastal wetlands | |
| 710 | Inland waters | |
| 720 | Sea water | |
| Rice field | 210 | Rice field |
| Field | 220 | Field |
| Others | 110 | Residential area |
| 120 | Industrial area | |
| 130 | Commercial area | |
| 140 | Culture·Athletic Recreation area |
|
| 150 | Traffic area | |
| 160 | Public facilities area | |
| 230 | Facility cultivation area | |
| 240 | Orchard | |
| 250 | Other cultivated land | |
| 310 | Hardwood forest | |
| 320 | Coniferous forest | |
| 330 | Mixed forest | |
| 410 | Natural grassland | |
| 420 | Artificial grassland | |
| 610 | Nature bare land | |
| 620 | Artificiality bare land |
Table 3
Home range estimations of spot-billed ducks (Anas poecilorhyncha) by MCP and KDE
| Study areas | No | MCP (km2) | KDE (km2) | ||
|---|---|---|---|---|---|
|
|
|||||
| 90% | 70% | 50% | |||
| Cheongmicheon | SB1 | 15.04 | 7.90 | 3.75 | 2.07 |
| Cheongmicheon | SB2 | 48.60 | 4.98 | 2.17 | 1.29 |
| Cheongmicheon | SB3 | 34.03 | 10.21 | 4.67 | 2.74 |
| Dodangcheon | SB4 | 239.58 | 6.66 | 3.26 | 1.82 |
| Yeonsancheon | SB5 | 24.51 | 2.03 | 0.70 | 0.35 |
| Baekcheon | SB6 | 59.94 | 27.99 | 14.94 | 7.72 |
| Average | 70.28 | 9.96 | 4.91 | 2.66 | |
| Standard deviation | 84.50 | 9.25 | 5.10 | 2.60 | |


