Introduction
Wetlands are land areas that are saturated or stagnant with water, either permanently or temporarily (Keddy, 2004; Ramsar Convention Secretariat, 2010), and undertake the characteristics of a distinct ecosystem: biological diversity and high primary productivity. It is an important ecological, economic, environmental, and geographical area with functions such as purifying pollutants, climate modification, and flood and drought control (Verhoeven et al., 2006; Wetzel, 2001). In addition, wetlands have a distinctive character, as they have organisms living in a unique ecosystem (Bae et al., 2004).
Aquatic insects living in wetland ecosystems have the highest diversity and population size among macroinvertebrates (Arscott et al., 2005; Bae et al., 2004; Rabeni et al., 2002). As aquatic insects are consumers of a lower order (the 1st and 2nd consumers) in food chains, their population characteristics, which depend on changes in the water environment, are shown in classification and systemization studies (Bae et al., 2003; Park et al., 2006; 2010; Ro & Chun, 2004; Shin et al., 2006; Won et al., 2005) on functional feeding groups (FFGs) depending on the acquisition of various food resources.
In these macroinvertebrates, their response to changes in the water environment is based on community dimensions (Ro et al., 2006) and environmental factors such as water temperature, electrical conductivity, dissolved oxygen, pH, and current velocity, which constitute the spatial characteristics of the habitat, are important factors in determining the biological community structure and species diversity (Park et al., 2011; Tiemann et al., 2004). Moreover, the increased number of macroinvertebrate species results in the area expansion of habitats and introduced vegetation, including water plants on various watersides. Therefore, a qualitative increase in habitat space is important (Curry et al., 2012). The initially introduced species in a newly created habitat result from the physicochemical characteristics of the habitat, whereas the introduced species later result from the process by which the food chain becomes stabilized according to trophic relations (Kil et al., 2010). This study aimed to identify the initial immigration of macroinvertebrate species in two types of newly created mountain wetlands. To compare the relationships between the experimental and control sites, we classified FFGs based on the origins of the food items and mechanisms of food acquisition (Merritt & Cummins, 1996).
Materials and Methods
Study sites description
Ganseong stream (37° 0’ N, 127° 0’ E) basin, the target area of this research, covers from Bongmyeong-ri, Dongsan-myeon, Chuncheon-si, and Gangwon-do to Seongdong-ri, Bukbang-myeon, and Hongcheon-gun. The Gangsung Stream is located approximately 7 km away from a mountainous stream. Gujeol Mountain (750 m) to the west and Yeonyeop Mountain (850 m) to the north flow to the south through the Daeryong Reservoir and the Hongcheon River to the North Han River. Regarding land use, forests occupied more than 80% of the stream basins, and those of paddy fields and other farmlands were 8.5% and 0.5%, respectively (Ministry of Environment, 2011).
The study site was selected as a newly created area of mountain wetlands within the Ganseong Stream Basin, which is less affected by artificial disturbances. As survey sites, E1, where influent water was supplied from a retarding basin, and E2, where influent water was supplied from flat water, were selected as the experimental sites. In contrast, C1, the site of upper influent water, and C2, the site of flat water in the neighborhood, were selected as control sites (Fig. 1).
Sample collection and preparation
This study was conducted three times in spring, summer, and fall from April to October 2012, immediately after the creation of mountain wetlands, but not in winter due to freezing. Benthic macroinvertebrates were collected quantitatively from each site with a Surber sampler (30×30 cm, mesh size 250 µm with bucket) and a modified D-frame deep net (30×30 cm, mesh size 250 µm with bucket). All biota were separated from other materials and sorted in the laboratory. Identification was mostly performed using a dissecting microscope (SZX-16; OLYMPUS, Tokyo, Japan) and an optical microscope (Eclipse 80i; Nikon, Tokyo, Japan) at 10-400× magnification. FFGs were analyzed by Merritt and Cummins (2008) and Ro and Chun (2004).
Physicochemical parameter analyses
Current velocity was measured at each site using a current meter (3000 C-140; Swoffer, Sumner, WA, US). The water temperature (WT), electrical conductivity (EC), dissolved oxygen (DO), and pH were measured using a multiparameter instrument (YSI-MPS 556; YSI, Yellow Springs, OH, USA).
Statistical analysis
One-way analysis of variance (ANOVA) was used to test the physical habitats of benthic macroinvertebrates and the significance of the physicochemical environmental factors. PASW Statistics version 18.0 (SPSS, Chicago, IL, USA), SYSTAT version 10.0, and SigmaPlot version 11.0 (SPSS) were used for correlation analysis. Furthermore, water environment factors were analyzed using PC-ORD version 6.0, and Canonical Correspondence Analysis (CCA) was conducted using the matrix of the biotic community.
Results and Discussion
Physicochemical environment factors
The general physicochemical parameters recorded at the sampling stations are listed in Table 1. WT is an important tool in water resource and aquatic habitat management and strongly influences the composition of aquatic communities. WT was higher by 1.5-2.2°C at experimental sites (E1, 10.5-21.6°C; E2, 14.2-26.0°C) than at control sites (C1, 10.4-21.2°C; C2, 12.3-24.8°C). These results were probably influenced by the upper reach (C1 and C2) and relatively high current velocity, as well as the canopy cover, which may be associated with the proportion of forest occupied by more than 80%. EC measures the flow of electrons (cations and anions) through the water. EC was higher by 0.7-4.7 μScm–1 at experimental sites (E1, 36.0-49.0 μScm–1; E2, 36.0-56.0 μScm–1) than at control sites (C1, 36.0-48.0 μScm–1; C2, 31.0-52.0 μScm–1). DO is an important index for evaluating water quality; its concentration in water is an important indicator of water quality and an important factor for water purification. DO concentrations at C2 (4.6-10.1 mgL–1) were relatively lower than those at the other stations (8.0-11.3 mgL–1). pH concentrations (6.0 to 7.4) did not differ significantly among stations. However, pH rarely has devastating effects on organisms in general rivers (Park et al., 2011). The investigation results showed that pH ranged from neutral to slightly acidic, suggesting that pH does not act as a limiting factor for the inhabitation of benthic macroinvertebrates.
The current velocity was slower by 6.63 cms–1 in the E1 than in the C1. This probably is attributable to the fact that E1 shows a lower riverbed gradient than the C1 and a lower flow quantity. However, the E2 showed a higher flow rate of 5.00 cms–1 than the C2. This is because water flow occurs at the E2 when the influent water flowing into the E2 is supplied at a distance. Current velocity determines the distribution characteristics of macroinvertebrates (Tiemann et al., 2004). Our results suggest that current velocity may be the biggest factor determining the characteristics of experimental sites E1 and E2 compared to other water environment factors.
Species appearance characteristics
The number of species and individuals increased throughout the survey at the experimental sites. In the primary survey, four species and 41 individuals were identified. In the secondary survey, six species and 70 individuals were observed. In the third survey, 18 species and 233 individuals were recorded at E1, indicating a gradual increase in aquatic insects after the restoration. In E2, three species and 22 individuals were identified in the primary survey, five species and 93 individuals in the secondary survey, and 12 species and 96 individuals in the third survey, suggesting a gradual increase after restoration, similar to E1 (Fig. 2).
However, several species and individuals were identified in the C1 and C2: 22 species and 556 individuals in the primary survey, 18 species and 681 individuals in the secondary survey, and 29 species and 1,778 individuals in the third survey at C1. In C2, five species and 385 individuals were identified in the primary survey, seven species and 707 individuals in the secondary survey, and 14 species and 556 individuals in the third survey (Fig. 3). The emergence characteristics of the species and population differed between the E1 and E2 and C1 and C2. This is understood to be a phenomenon resulting from the expanded habitat space available for benthic macroinvertebrates and increased food sources with the introduction of water plants and various vegetation types at the waterside after the creation of mountain wetlands, which is consistent with the results of Kim and Cho (1999). Therefore, it is considered that the species inhabited at control sites will be further introduced from the surrounding basins after habitat stabilization over time. We suggest that the establishment of suitable habitats can promote the recovery and growth of benthic macroinvertebrate populations.
In connection with the accumulated number of species and population at the investigated sites over the entire period of investigation, the E1 and E2 showed a lower number of species and population than the C1 and C2 (Fig. 4). Regarding the number of species, the experimental sites showed a lower number of species by 14 species on average than the control sites. In terms of the number of individuals, the experimental sites showed a lower number of species by 2,054 individuals on average than the control sites. In particular, the number of species was twice as high, and the number of individuals was eight times higher at the E1 than at the C1, which suggested that the difference in appearance between the E1 and the C1 was relatively higher than the difference in the appearance of the community between the E2 and the C2 (Fig. 4).
This is consistent with a study showing that the species diversity of benthic macroinvertebrates is low because of the use of oxygen in flat waters and the limited physical environment of the habitat (Lee et al., 2012). Similarly, the number of species and individuals was higher in wetland E1, the newly created origin of the retarding basin, than in wetland E2, the origin of flat water. However, the number of species and individuals appeared relatively smaller in the E1 and E2 than in the C1 and C2, possibly resulting from the lack of food sources in the initial stage of habitat restoration and the unstable habitat environment.
Kim and Cho (1999) monitored the changes in biota after the creation of artificial wetlands and reported that many organisms inhabited the site where lakeside plants were well developed. This study also identified many species after summer rainfall when vegetation developed significantly, which was consistent with the existing studies.
When we examined the introduced species in nature after the creation of the mountain wetland, the species first introduced to the two experimental sites were Ephemera strigata, Ephemera orientalis, Chironomidae sp., and Aquaris palladium, which were all similar species and were found to have inhabited the entire period of investigation. No species were found to appear only in the initial stage of habitat creation (1st and 2nd investigation), except for the species that appeared throughout the investigation.
In particular, E. strigata and E. orientalis were identified as continuously inhabiting the river because the river’s representative burrower was the initial stage of mountain wetland creation. At the E1 and E2, the riverbed was sandy, which suggests that it was created very similarly to the original one in its natural state.
However, the two experimental sites showed an increase in many species during the fall season, with an increase in the number of predator species, such as Davidius lunatus, Sieboldius albardae, Oyamia nigribasis, and Sialis longidens (Fig. 5). These results appeared during the time of investigation after the development of waterside vegetation, which was similar to the results of existing studies that monitored the species after the wetland creation by Kim and Cho (1999). Therefore, if waterside vegetation develops within a wetland, more species will appear because of additional species immigration.
Shin (2011) revealed the trophic relationship between macroinvertebrates using stable isotopes (carbon and nitrogen) and found that D. lunatus feeds on E. strigata. This study also showed that some predators were introduced depending on the selection of food sources because D. lunatus appeared in the E1, and E. strigata as a food source for D. lunatus continued to appear in E1. These results suggest that predators appeared from the time when the supply of food sources became possible after the habitat was stabilized. The major predators, D. lunatus and S. albardae, appeared at the E1 based on the origin of the retarding basin, and S. longidens appeared at the E2, originating from flat water. Therefore, the two wetlands created according to the habitat characteristics of these species are considered to reflect distinct physical habitats.
Species appearance characteristics by FFGs
From the results of the FFGs analysis across all time periods, shredders (SH) showed a 6.7% appearance ratio, but filtering collectors (FC) did not appear at the experimental site E1. FC showed an appearance ratio of 11.1%, but SH did not appear at E2 (Fig. 6). This is consistent with existing studies (Park et al., 2010; Ro & Chun 2004; Ro et al., 2006) showing that the number of SH and the population appeared higher in upstream areas, whereas FC appeared relatively high in the mid- and lower-level regions. This is also consistent with existing studies (Lee et al., 2012) showing that the appearance ratio of FC and gathering collectors (GC) is high in flat water.
The distribution of functional feeding groups in macroinvertebrates living in riparian ecosystems reflects the environmental factors of the habitat (Kil et al., 2010; Ro & Chun, 2004; Ro et al., 2006). Similar to D. lunatus that immigrated after E. strigata inhabitation identified earlier in this study, the lack of food sources in the initial stage of restoration was considered to be the major limiting factor for species immigration and inhabitation at E1 compared to the C1, where coarse particulate organic matter (CPOM) was infected from the surrounding vegetation.
This study is expected to be generally applicable because our findings from the mountain wetland within the water system of the Ganseong Stream were almost identical to those of previous studies (Allan & Castillo, 2007; Park et al., 2010; Ro et al., 2006) in terms of the habitat characteristics of organisms in the retarding basin and flat water, as observed from the river continuum concept.
Species appearance characteristics depending on water environment factors
Current velocity significantly differed in comparing physicochemical water environment factors and sites (one-way ANOVA, P<0.01). In addition, physicochemical water environments factors such as WT, DO, and EC were not significantly different between the sites (one-way ANOVA test, P>0.05) (Table 2).
From the CCA analysis results using physicochemical factors (WT, EC, DO, pH, and current velocity) and benthic macroinvertebrates between the experimental and control sites (Fig. 7), C1 was arranged at the upper right side, E1 at the bottom, C2 at the upper left side, and E2 at the bottom based on axes 1 and 2. The eigenvalue of axis 1 was 0.611; the index of species dispersion of benthic macroinvertebrates, which can be explained by the five environmental factors, was 17.9%; and the accumulated index of dispersion was 17.9%. The correlation between the taxonomic group of benthic macroinvertebrates and the physicochemical factors was 0.932, suggesting a very high correlation. The eigenvalue of axis 2 was 0.406, the index of benthic macroinvertebrate species dispersion that could be explained by environmental factors was 11.9%, and the accumulated index of dispersion was 29.9%. The correlation between the taxonomic group of benthic macroinvertebrates and environmental factors was 0.946, which showed a very strong correlation, similar to axis 1. Five environmental factors showed a positive correlation, showing that WT (0.864) was the highest on axis 1, and pH (–0.458) showed a very strong negative correlation. Furthermore, DO was an influential environmental factor in the dispersion of benthic macroinvertebrates. On axis 2, the WT (–0.533) influenced the species dispersion of benthic macroinvertebrates, showing a very strong negative correlation (Table 3).
In conclusion, the habitat characteristics of the E1 and E2 were divided by WT, DO, and current velocity, similar to the relationship between the C1 and C2. Therefore, the intention of wetland creation by dividing into two types: retarding basins and flat water, was significantly reflected.
To analyze the impact of extracted environmental factors on each group at the species level, WT, DO, and current velocity made an even impact in the E1, and the functional feeding groups of the species appeared to vary among shredders, gathering-collectors, filtering-collectors, and predators. The WT was the major environmental factor that affected the E2, and the functional feeding groups were mostly scrapers and predators. The major environmental factors affecting the C1 were current velocity and DO, and the functional feeding groups varied among shredders, gathering collectors, filtering collectors, scarpers, and predators. The major environmental factor that impacted the C2 was current velocity, but it showed a negative correlation, and the functional feeding groups of the appeared species varied: shredders, gathering collectors, and filtering collectors.
Discussion
E1 and E2, which are mountain wetlands created within the Ganseong Stream basin, showed very few species and individuals in the initial stages of creation, similar to existing studies (Allan, 1995; Shao et al., 2006). This study indicated that a simple riverbed structure and lack of microhabitats reduced the species diversity of benthic macroinvertebrates. However, we suggest that the number of species and individuals increases over time with the development of waterside vegetation and habitat stabilization. In addition, physicochemical factors that differentiate the two habitats, such as current velocity, which determines the distribution characteristics of benthic macroinvertebrates in relation to their preferred current velocity, and the water temperature, which affects the growth of organisms, showed a relatively stronger influence.
Figures and Tables
Fig. 1
Study sites in the Ganseong Stream basin. E1, experimental site 1 where influent water was supplied from a retarding basin; E2, experimental site 2 where influent water was supplied from flat water; C1, control site 1 the site of upper influent water; C2, control site 2 the site of flat water in the neighborhood.
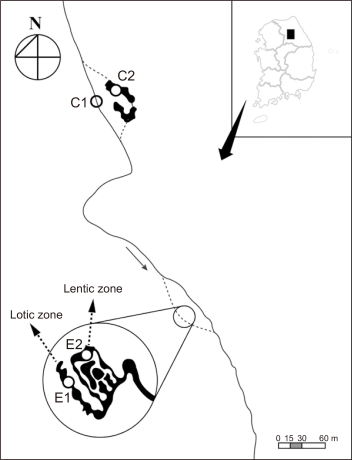
Fig. 2
Number of (A) appeared species and (B) individuals in C1 and C2. C1, control site 1 the site of upper influent water; C2, control site 2 the site of flat water in the neighborhood.
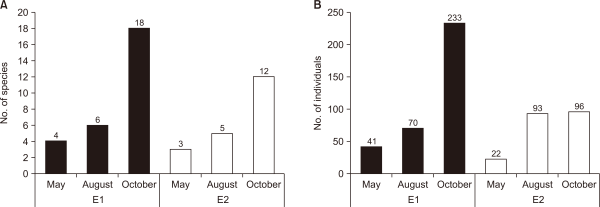
Fig. 3
Number of (A) appeared species and (B) individuals in E1 and E2. E1, experimental site 1 where influent water was supplied from a retarding basin; E2, experimental site 2 where influent water was supplied from flat water.
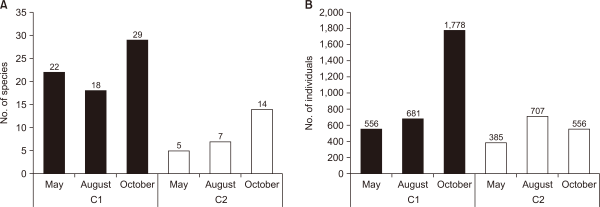
Fig. 4
Number of (A) accumulated species and (B) individuals appeared in E1 and E2 and C1 and C2. E1, experimental site 1 where influent water was supplied from a retarding basin; E2, experimental site 2 where influent water was supplied from flat water; C1, control site 1 the site of upper influent water; C2, control site 2 the site of flat water in the neighborhood.
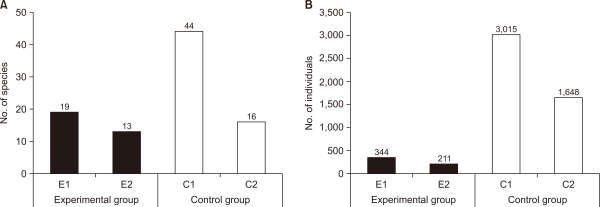
Fig. 5
Number of species by Insecta in (A) E1 and (B) E2. E1, experimental site 1 where influent water was supplied from a retarding basin; E2, experimental site 2 where influent water was supplied from flat water; Eph., Ephemeroptera; Odo., Odonata; Ple., Plecopterta; Hem., Hemiptera; Meg., Megaloptera; Dip., Diptera; Tri., Trichoptera.
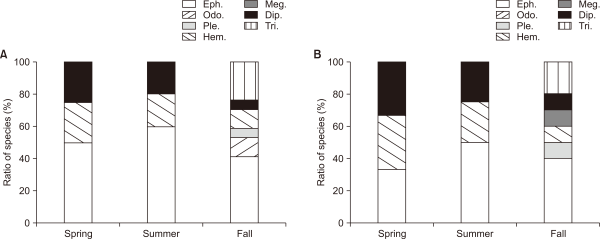
Fig. 6
Proportion of species in E1, E2 and C1, C2 by functional feeding groups. E1, experimental site 1 where influent water was supplied from a retarding basin; E2, experimental site 2 where influent water was supplied from flat water; C1, control site 1 the site of upper influent water; C2, control site 2 the site of flat water in the neighborhood; SH, shrreders; GC, gathering collectors; FC, filtering collectors; SC, scrapers; PR, pradators; PP, plant piercers.
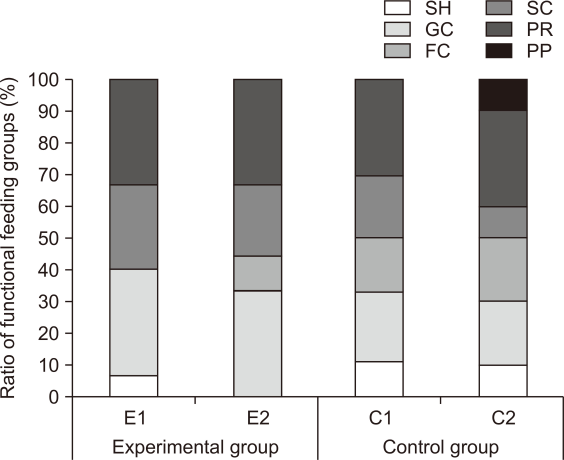
Fig. 7
Canonical Correspondence Analysis ordination analysis of investigated sites and environmental factors. E1, experimental site 1 where influent water was supplied from a retarding basin; E2, experimental site 2 where influent water was supplied from flat water; C1, control site 1 the site of upper influent water; C2, control site 2 the site of flat water in the neighborhood; WT, water temperature; EC, electrical conductivity; DO, dissolved oxygen.
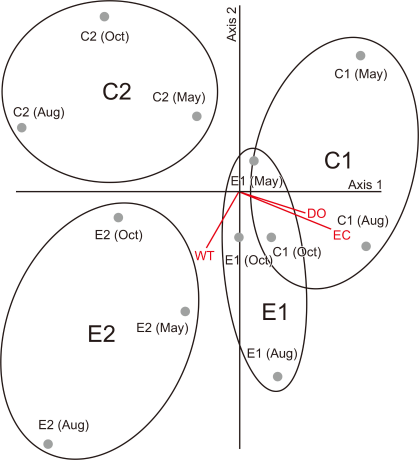
Table 1
Physicochemical water environment of E1, E2 and C1, C2
| Site | Mo | WT (°C) |
EC (μScm–1) |
DO (mgL–1) |
pH | CV (cms–1) |
|---|---|---|---|---|---|---|
| E1 | May | 10.5 | 49.0 | 8.2 | 7.3 | 27.5±2.4 |
| August | 21.6 | 47.0 | 8.0 | 7.2 | 58.6±3.8 | |
| October | 15.6 | 36.0 | 8.5 | 7.4 | 38.9±2.9 | |
| E2 | May | 14.2 | 56.0 | 11.3 | 7.0 | 5.2±0.8 |
| August | 26.6 | 51.0 | 8.7 | 7.3 | 8.3±1.2 | |
| October | 16.0 | 36.0 | 9.2 | 7.3 | 6.2±1.1 | |
| C1 | May | 10.4 | 48.0 | 9.6 | 6.2 | 38.3±2.5 |
| August | 21.2 | 46.0 | 9.3 | 6.0 | 63.5±6.1 | |
| October | 11.6 | 36.0 | 8.6 | 7.8 | 43.1±3.3 | |
| C2 | May | 12.3 | 52.0 | 10.1 | 6.5 | 1.1±0.3 |
| August | 24.8 | 46.0 | 4.6 | 6.9 | 2.1±0.2 | |
| October | 13.0 | 31.0 | 6.9 | 7.3 | 1.5±0.2 |
Table 2
Test of significance between physicochemical water environment factors
| Sum of squares | df | Mean square | F | P-value | ||
|---|---|---|---|---|---|---|
| WT | Between groups | 31.913 | 3 | 10.638 | 0.265 | 0.849 |
| Within groups | 321.114 | 8 | 40.139 | |||
| Total | 353.027 | 11 | ||||
| EC | Between groups | 41.667 | 3 | 13.889 | 0.176 | 0.910 |
| Within groups | 631.333 | 8 | 78.917 | |||
| Total | 673.000 | 11 | ||||
| DO | Between groups | 11.097 | 3 | 3.699 | 1.494 | 0.288 |
| Within groups | 19.808 | 8 | 2.476 | |||
| Total | 30.905 | 11 | ||||
| pH | Between groups | 0.804 | 3 | 0.268 | 0.976 | 0.451 |
| Within groups | 2.198 | 8 | 0.275 | |||
| Total | 3.002 | 11 | ||||
| CV | Between groups | 0.513 | 3 | 0.171 | 15.919 | 0.001 |
| Within groups | 0.086 | 8 | 0.011 | |||
| Total | 0.598 | 11 | ||||