Introduction
Monitoring ecosystems is a key procedure involving systematic data collection on our biosphere. This acts as a foundational element for evaluating the condition and shifts within ecosystems. This process is central to biodiversity conservation and sustainable management of natural resources. Ecological monitoring data are inherently complex, variable, and multidimensional, providing a robust representation of ecosystems over time and space. These datasets encapsulate a myriad of metrics, ranging from species abundance, species diversity, and biotic interactions to environmental parameters such as temperature, precipitation, and nutrient concentrations.
The inherent complexity and variability of ecological monitoring data necessitate a comprehensive verification process to assure data integrity and accuracy, both critical for deriving reliable conclusions and informing evidence-based decision-making. However, the diversity of data collection techniques in ecological monitoring, including remote sensing, automated data loggers, and manual field observations, can introduce potential variances, biases, and errors (Beck & Schwanghart, 2010). These discrepancies can potentially skew data interpretation and consequentially influence ecological decisions and strategies (Chao & Jost, 2012).
The task of data verification is further exacerbated in large-scale or long-term ecological monitoring and citizen science initiatives due to the involvement of numerous data sources and stakeholders. Particularly in citizen science monitoring where data collection is mainly performed by untrained volunteers, additional biases and inaccuracies may be introduced (Burgess et al., 2017). If these inaccuracies remain unchecked, they can propagate and accumulate over time across different regions, potentially distorting long-term studies and impeding the identification of true ecological patterns and changes.
To address these challenges, we proposed the application of Benford’s Law, a principle originally observed in diverse fields such as finance, engineering, and health sciences. This principle, also known as the First-Digit Law, posits a logarithmic distribution of leading digits in many naturally occurring numerical collections, where smaller digits often occur more frequently as leading digits. This pattern extends to various data types, including physical and mathematical constants and social and economic data such as electricity bills, street addresses, stock prices, population numbers, death rates, and river lengths (Kvam et al., 2007). In a Benford distribution, the leading significant digit is 1 approximately 30% of the time and 9 less than 5% of the time. This contrasts with the uniform distribution expected if digits are distributed randomly (Bhole et al., 2015).
Given inherent patterns of naturally occurring ecological phenomena, it is plausible that authentic ecological monitoring data free from systematic errors would align with Benford’s Law (Campos et al., 2016; Costas et al., 2008; Özkundakci & Pingram, 2019). Therefore, Benford’s Law could serve as an efficient tool for data validation in large-scale and long-term ecological monitoring, capable of identifying anomalies and assuring data integrity (Docampo et al., 2009; Szabo et al., 2023).
In addition, we used traditional methods often employed in summarizing ecological monitoring data outcomes to understand basic characteristics of the data, including measures of species specificity, abundance, and diversity. Analytical results combined with the application of Benford’s Law could provide a comprehensive and multifaceted approach in evaluating data consistency and integrity.
The objective of this study was to assess the potential of using Benford’s Law to evaluate the integrity of ecological monitoring data, specifically those related to species abundance. We hypothesize that if ecological monitoring data are genuine and free from manipulation or systematic errors, the leading digit distribution will closely follow the expected distribution according to Benford’s Law (Pröger et al., 2021). On the other hand, significant deviations from this expected distribution might suggest potential data integrity issues, necessitating further investigation (Nigrini, 2012). If our hypothesis is confirmed, this could introduce a novel approach to data verification in ecological monitoring, possibly leading to significant improvements in the field’s methodology.
Material and Methods
Data collection
In this study, we utilized data collected from the 2020 annual winter migratory bird survey conducted as part of South Korea’s continuous ecological monitoring efforts (NIBR, 2021). We explicitly chose data of this specific year to ensure contemporary relevance and accuracy in our analysis of migratory bird patterns. The dataset encompassed observations of 553 unique bird species from 200 different monitoring locations across South Korea, offering a comprehensive view of avian biodiversity during the winter period. Data from two distinct but concurrent winter surveys were compiled for this analysis. It is important to note that data used in this study were not subjected to any form of processing or manipulation. Raw data were analyzed as-is to maintain the integrity and authenticity of original observations.
Data analysis
Primary data source for this study was the 2020 annual winter migratory bird survey, encompassing observations from 200 distinct sites across South Korea. Our analysis primarily focused on two key metrics: species richness (total number of unique bird species observed at each site) and abundance (total count of individual birds across all species at each location). We utilized two ecological diversity indices to gauge species diversity across these sites: Shannon and Simpson indices. Distributions of these indices were visualized through histograms with bins arranged at 0.05 intervals using the vegan package in R software version 4.2.0 (Dixon, 2003).
A significant component of our analysis involved applying Benford’s Law to examine the distribution of leading digits in our dataset. For this purpose, we used the benford.analysis package in R software (Cinelli, 2022). Benford’s Law could predict a logarithmic distribution of leading digits in naturally occurring datasets. It was applied to the first and initial two digits of the count data from the bird monitoring dataset. This law suggests that lower digits should appear more frequently as leading digits in authentic, unmanipulated datasets.
To provide a comprehensive analysis, we included additional statistical measures in our Benford’s Law analysis. We computed Mantissa statistics (mean, variance, skewness, and kurtosis) for leading and secondary digits in our data. These statistics helped us understand distribution characteristics of our data in relation to Benford’s Law. For instance, the Mantissa mean and variance gave insights into the central tendency and dispersion of secondary digits, while skewness and kurtosis offered details on the data’s symmetry and tail heaviness. Furthermore, we conducted statistical tests such as Pearson’s Chi-squared test and the Mantissa Arc Test to quantitatively assess the conformity of our data with Benford’s Law. The Pearson’s Chi-squared test evaluated the significance of deviation between observed and expected digit distributions, while the Mantissa Arc Test examined the uniformity of secondary digits’ distribution. We also calculated the Mean Absolute Deviation (MAD) according to Nigrini (2012) to gauge the average deviation of our data from the expected Benford distribution. The MAD value along with the MAD Conformity assessment provided an additional layer of validation for our findings. It is important to note that deviations from Benford’s Law do not automatically imply data manipulation or errors. As highlighted by Shikano & Mack (2016), such deviations can occur due to various natural factors inherent in ecological datasets. Thus, any discrepancies observed in our analysis were carefully evaluated within the context of ecological data characteristics and the specific nature of our dataset.
Results
Species richness and abundance
On average, each location was found to host approximately 48.12 species, with a standard deviation of 15.43. This indicated a modest variability in species richness across locations. The median species richness stood at 47 species, meaning that half of locations had a species richness greater than this figure, while the other half had less. The species richness ranged from a minimum of 18 species to a maximum of 99 species, revealing a considerable spread in the data.
The mean abundance across all locations was approximately 15,395.49 individuals, with a substantial standard deviation of 33,619.34, showing a high variability in species abundance among locations. However, the median abundance was considerably lower at 6,459 individuals. The lowest recorded abundance was 546 individuals, while the maximum stood at an impressive 336,048 individuals (Fig. 1).
Diversity indices
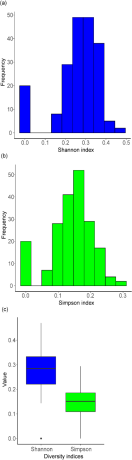
The Shannon index, taking into account both species abundance and evenness, registered a mean value of 0.262 with a standard deviation of 0.107, indicating moderate average diversity with some variations across locations. The median value was slightly higher at 0.284, which suggested a skewed distribution, with some locations showing lower diversity. The index varied from a minimum of 0 to a maximum of approximately 0.470. Analysis of the histogram revealed a distinct mode within a bin range of 0.25 to 0.30, suggesting that many locations had moderate species diversity and evenness. There were also notable counts within bin ranges of 0.15 to 0.20 and 0.30 to 0.35. However, the index indicated 20 locations with a minimal diversity reflected by a Shannon index value of zero.
On the contrary, the Simpson index known to lean more heavily on species abundance showcased a different diversity pattern. It exhibited a lower average value of 0.142 with a standard deviation of 0.064, indicating the index’s sensitivity to species abundance. The index ranged from 0 suggesting minimal diversity to approximately 0.294 depicting locations with substantial diversity.
The histogram reflected a significant number of observations within bin ranges of 0.05 to 0.10 and 0.10 to 0.15, with the highest frequency in the bin range of 0.15 to 0.20, reflecting locations with moderate to high species diversity. Yet, similar to the Shannon index, 20 instances displayed a Simpson index value of zero (Fig. 2).
Results for Benford’s Law analysis
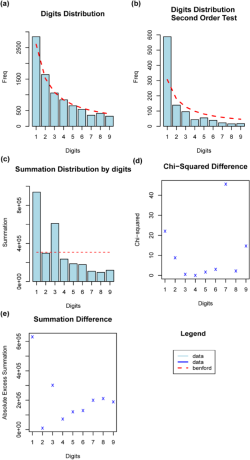
In the first-order analysis, focusing on the leading digit, the Mantissa statistics indicated a mean of 0.434 and a variance of 0.092 for secondary digits in the dataset. The ex-kurtosis was -1.185, suggesting a slightly platykurtic distribution, with lighter tails and a scarcity of outliers. Additionally, the skewness was 0.092, indicating a slight right skew in the distribution of secondary digits. Five largest deviations were noted, with absolute differences ranging from 239.78 for ‘1’ to 41.83 for ‘6’. Although these discrepancies hinted deviations from Benford’s Law’s expectations, the Mean Absolute Deviation (MAD) value of 0.00919358 showed relatively small average differences between the leading digit’s distribution in our dataset and Benford’s Law. Interestingly, the MAD Conformity indicated “acceptable conformity” according to Nigrini (2012), despite certain deviations.
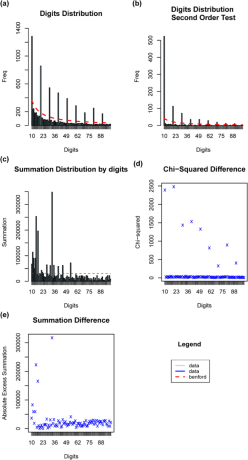
The second-order analysis further probed the data’s integrity by examining the first two digits of bird population counts (Diekmann, 2007). The Mantissa statistics remained consistent with the first-order analysis. However, the five largest deviations showed larger discrepancies. Most notably, digit ‘10’ had an absolute difference of 925.50, much higher than the largest deviation observed in the first-order analysis. These substantial divergences suggested a significant departure from expected frequencies of Benford’s Law for the first two leading digits.
Statistical tests reinforced these observations. The Pearson’s Chi-squared test provided an X-squared value of 13257 with a p-value significantly smaller than the conventional threshold of 0.05, highlighting a significant deviation from Benford’s Law’s predictions. The Mantissa Arc Test also yielded a p-value of 4.454e-12, emphasizing significant non-conformity. In contrast to the first order, the MAD for the second order was slightly lower at 0.008729959, suggesting ‘non-conformity’ according to Nigrini (2012) (Fig. 3).
Discussion
This study provided a comprehensive examination of the integrity of ecological monitoring data, specifically focusing on winter migratory bird surveys in South Korea. Utilizing the statistical principle of Benford’s Law, it evaluated the degree of conformance of leading digits in bird population counts to the expected logarithmic distribution.
A considerable variability in species richness and abundance across survey locations underscored the inherent complexity of ecological data. This variation, ranging from 18 to 99 species in richness and 546 to 336,048 individuals in abundance, attested to the multitude of influences on ecological communities and consequently, the potential for wide-ranging results in ecological monitoring data. Such variability necessitates robust data collection protocols to ensure accurate representation of ecological communities.
Large standard deviations observed for both species richness and abundance further emphasize this point. Discrepancies between mean and median values, particularly for species abundance, may hint a skewness in the data, potentially implying biases in data collection or recording. A careful review of data collection methodologies and rigorous data verification are crucial to identifying and rectifying such potential issues.
Diversity indices also need some important considerations. The Shannon index, representing both species richness and evenness, yielded moderate diversity on average. However, instances of zero values in the index could potentially signify locations with severely diminished diversity. Similarly, the Simpson index, focusing more on species abundance, also indicated instances of minimal diversity (Magurran, 1988). These observations might reflect natural ecological patterns or hint at biases or errors in data collection and recording (Yoccoz et al., 2001).
Our analysis using Benford’s Law revealed mixed results. While our first-order analysis showed a relatively strong conformance, the second-order analysis indicated more pronounced deviations (Fig. 4).
These mixed findings suggest both the utility and limitations of Benford’s Law in ecological data analysis. Particularly, the inherent complexity and diversity of ecological data pose challenges to the universal applicability of Benford’s Law. The observed deviations highlight the importance of considering various factors, including environmental conditions, species behaviors, and data collection methodologies, which can significantly influence ecological data sets. Moreover, ecological data’s heterogeneity that is subject to myriad influences and variations plays a significant role (Turner et al., 2013). Factors such as environmental conditions, food availability, and predator-prey dynamics can drive notable differences in species abundance across locales, potentially leading to anomalies when analyzed within the Benford’s Law framework (Shikano & Mack, 2016). Data collection methods also vary significantly depending on species, location, and research objectives, which can introduce biases and errors (Biber, 2013). For instance, varying experience levels of researchers, from seasoned scientists to early-career contributors, can create irregularities in data collection and recording (Burgess et al., 2017). These complexities and variations in ecological monitoring data highlight the need for cautious interpretation when applying Benford’s Law. While Benford’s Law can serve as a useful tool for detecting anomalies in large datasets, it is essential to contextualize its application within the specific nature of ecological data. Future research directions should explore complementary methods for data verification in ecological studies and develop more nuanced approaches that account for unique characteristics of ecological data.
Conclusions
The application of Benford’s Law in this study represents a novel approach to enhancing the credibility of ecological monitoring data. Its ability to detect potential inconsistencies offers significant value, especially in the context of large-scale or long-term ecological monitoring initiatives. The efficacy and efficiency of Benford’s Law make it a potentially valuable complement to traditional data verification methods in ecological research. While our findings indicated that the bird population counts from the winter migratory surveys did not perfectly align with the expected logarithmic distribution of Benford’s Law, this does not necessarily undermine the validity of the ecological monitoring data. Instead, observed discrepancies highlight the need for a nuanced understanding of the data and factors influencing it. These deviations could be attributed to a variety of factors, ranging from methodological errors in data collection (Biber, 2013) to intrinsic ecological characteristics of bird populations (Turner et al., 2013). Such complexities inherent in ecological data underscore the importance of context and careful interpretation when employing statistical tools such as Benford’s Law. This study suggests that reliance solely on Benford’s Law may not be sufficient for validating ecological monitoring data. Rather, it should be viewed as part of a broader toolkit for data verification. Integrating Benford’s Law with other analytical methods could provide a more robust framework for assessing data integrity. Additionally, these findings underscore the importance of continually refining data collection and processing methodologies to ensure their robustness and reliability. Moving forward, ongoing analysis and monitoring are essential to further evaluate the representativeness and authenticity of ecological data over time. Future research should focus on developing and integrating complementary data verification techniques, tailored to unique challenges and characteristics of ecological data. By doing so, researchers can enhance the overall quality and reliability of ecological monitoring efforts, contributing to more informed and effective strategies in biodiversity conservation and natural resource management.
Figures and Tables
Fig. 1
Spatial distribution of (a) species richness and (b) abundance associated with winter migratory birds across 200 designated monitoring sites
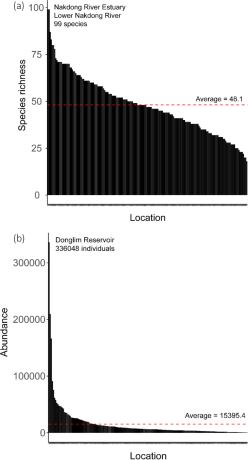
Fig. 2
Distributions of diversity indices for wintering migratory birds across 200 monitoring sites: (a) Histogram of Shannon diversity index values, (b) Histogram of Simpson diversity index values, and (c) Boxplot representation for both Shannon and Simpson indices.