1. INTRODUCTION
E-services are defined as “delivery of all interactive services on the internet using advanced telecommunications, information, and multimedia technologies” (Boyer et al., 2002, p. 175). One such e-service has been identified as library e-resources, where the interaction of users happens via Internet to satiate their informational needs. Saye (2001, p. 76) has described these e-resources as “the resources that are generated through some electronic medium and made available to a wide range of viewers both on and off site via some electronic transferring machine or internet.” According to the Colorado Alliance of Research Libraries (2003), “Electronic serials may be defined very broadly as any journal, magazine, e-zine, webzine, newsletter or type of electronic serial publication which is available over the Internet” (cf. Bar-Ilan et al., 2003).
It has been observed that students prefer to use e-resources available in digital libraries rather than visiting library spaces (Ameen, 2019). Previous studies have also stated that e-resources are better than print resources for academic purposes (Borrego et al., 2007; Lee et al., 2012). Moreover, the COVID-19 pandemic has restricted users to using e-resources in place of print resources (Hendal, 2020). Besides this, there are various other factors which are responsible for frequent use of e-resources. A few of the most important reasons for preferring e-resources are identified as the easy accessibility of relevant information at any point in time (Thong et al., 2002; Wu & Wang, 2005). Additionally, users also perceive e-resources as valuable because of the convenience of access and speed of retrieval (Garg et al., 2017; Madhusudhan, 2010). Similarly, various factors have been explored in literature, playing a pivotal role in building perceived value of e-resources for the user.
Many researchers have mentioned the importance of perceived values in comprehending the views of customers, especially in the service industry (Ha & Jang, 2010; Jensen, 1996; Ostrom & Iacobucci, 1995). It has been observed that studies have examined perceived value from the perspective of benefits received after paying ascertained costs. According to Setterstrom et al. (2013), “perceived value increases as either the benefits from product consumption increase or the costs associated with consumption decrease.” These studies have clearly mentioned that the perceived value benefits are viewed as a function of cost in case of e-resources. However, it is evident from the previous studies that a complete perceived value framework has not been applied in the context of e-resources to evaluate user satisfaction and intention to use. Thus, it will be interesting to examine how the perceived values influence satisfaction and intention to use e-resource among users. For this purpose, five values have been identified and examined: These are utilitarian, hedonic, uniqueness, epistemic, and economic. Further, the viewpoints of students have been collected and considered in determining the role of these values in influencing satisfaction and intention to use.
As far as the organization of this paper is concerned, the paper begins with an extensive review of literature in the areas of value matrices and e-resources, which also helped in drafting the research hypotheses. Subsequently, its methodology is explained, followed by analysis and results. The paper concludes with a discussion, conclusion, and scope for future research.
2. LITERATURE REVIEW
Various studies have explored the usage of e-resources on the basis of age, gender, discipline, profession, etc. across geographies (Zhang et al., 2011). Besides demographic patterns, the usage behavior of e-resources has also been determined by individual characteristics of its users such as enthusiasm, awareness, and openness to change (Madhusudhan, 2010; Sharma et al., 2011). Interestingly, while some of the past studies have considered one or more perceived value factors in their investigation, others have not. Examples for this are studies by Habiba and Ahmed (2021), Azonobi et al. (2020), and Abdul Rahman and Mohezar (2020). Habiba and Ahmed (2021) evaluated satisfaction and intention to use of e-resources from the lens of problems and constraints, whereas Azonobi et al. (2020) considered psychological and social factors along with other factors that drive students to use e-resources on a continuous basis. Abdul Rahman and Mohezar (2020) carried out a qualitative investigation and identified five factors that may have a significant relationship with continued intention to use digital libraries. However, none of these studies have included perceived values that may also have an impact on continued intention to use.
On the contrary, several studies have considered one or more perceived value factors in their investigation. For instance, a review of the literature shows that e-resources provide users with sorted and up-to-date information that helps in academic progress (Joo & Lee, 2011; Tahir et al., 2010). Students also admire certain aspects of e-resources like user-friendliness, effectiveness, efficiency, satisfaction, and learnability (Zhang et al., 2020). These reasons indicate the widespread popularity of digital resources by providing utilitarian, experiential, and hedonic benefits to users (Dominici & Palumbo, 2013; Garg et al., 2017; Sharma et al., 2011).
It is found from past literature that several factors have been explored and identified, impacting intention to use e-resources. However, the complete perceived value framework has not been applied to evaluate the intention to use in the context of e-resources. Thus, it can be safely said that while many studies have investigated the impact of dimensions of perceived values on usage of e-resources, they have not inspected the usage of e-resources considering all the dimensions of perceived values comprehensively in a single study. According to the past literature, the dimensions of perceived values not only affect the overall satisfaction of users towards e-resources but also arouse their intentions to use e-resources regularly. The concept of perceived value satisfaction has been borrowed from the well-established Expectation-Confirmation model (ECM). ECM is extensively employed to study user behavior in post-adoption of services including e-resources (Joo & Choi, 2016). Empirical applications of ECM reveal in information science literature that user satisfaction is a major factor of intention to use e-resources (Thong et al., 2006). Thus, the present study attempts to analyze the impact of the perceived values on satisfaction and intention to use e-resources.
Following the reviewed literature, the present study intends to find answers to the below mentioned research questions:
-
Which perceived values are the predictors of student satisfaction and that of their intention to use e-resources?
-
To what extent do these perceived values impact satisfaction and intention to use e-resources?
To answer the above research questions, six hypotheses were framed and appended with their respective theoretical concept.
2.1. Utilitarian Value
Utilitarian value is perceived when a user experiences benefits such as up-to-date information, time saving, and improved academic achievements after the use of e-resources (Ali, 2005; Cheng, 2014; Joo & Lee, 2011; Madhusudan, 2010; Ollé & Borrego, 2010; Tahir et al., 2010). Kim and Han (2009) have defined this value as “the extent of effectiveness and efficiency that is perceived by consumers when using information systems.” This means that utilitarian value deals with the “ease and speed of accomplishing a task effectively and conveniently” (Pura, 2005). The majority of studies have strongly agreed that utilitarian value prompts users to adopt and use e-resources due to its direct functional advantages (Al-Debei & Al-Lozi, 2014) and also significantly influences their satisfaction levels (Carlsson et al., 2006). Hence, we hypothesize:
2.2. Hedonic Value
Hedonic value is defined as “the level of pleasure and joy users experience when using a certain technology” (Garg et al., 2017). In the context of e-resources, hedonic value is achieved when e-resources successfully provide users with the experience of speedy, user-friendly, and organized output of desired information. Preciously, this value benefits users with easy access, quick search, and sorted data (Cheng, 2014; Dominici & Palumbo, 2013; Garg et al., 2017; Joo & Lee, 2011; Sampath Kumar & Kumar, 2010). Kim et al. (2005) have also found that intrinsic motivations positively impact the behavior of users. For example, amusing mobile fun elements and services satiate the emotional needs of users more than do performance-based needs (Hong et al., 2008). Such services provide users with convenient access to high quality e-resources and engage them to spend more time. In two studies, Kim and Han (2009) and Yang and Jolly (2009) empirically validated that hedonic value significantly impacts the satisfaction and intention to adopt mobile services. The findings of the above-mentioned literature influence the following hypothesis:
2.3. Uniqueness Value
Uniqueness value plays an important role in forming a distinct self-image (Hong et al., 2006). This value is defined as “the sense of differentiation or distinctiveness from others” (Tian & McKenzie, 2001). People tend to seek ways and means to acquire a unique product or service, the possession and usage of which may help them acquire a sense of superiority in their societal setups. For example, researchers have also proved that mobile data services play an important role in enhancing the social image of users (López-Nicolás et al., 2008). It has also been found that individuals show off their smartphones in public (Lu et al., 2005). However, it is also noted that uniqueness is lost once the usage of a product or service becomes common among the public, and its utility dimensions are well understood and adopted across one’s sphere of influence. Hence, we hypothesize:
2.4. Epistemic Value
Epistemic value is defined as “the knowledge gained upon trying new things” (Pihlström & Brush, 2008). Researchers have outlined it as “the curiosity to learn new things and gain new knowledge” (Pihlström & Brush, 2008; Rouibah & Hamdy, 2009). It is found that innovators try new e-services first and then identify and evaluate the positives and negatives of that service(s) (Lu et al., 2005; López-Nicolás et al., 2008). However, findings of a study conducted by Pagani (2004) concluded that innovation increases the intent to adopt an e-service. To explore more about the role of epistemic value in arousing intention to use e-resources, we hypothesize:
2.5. Economic Value
A very few researchers have tried to explore the importance of economic value on satisfaction and intention to use e-resources. Agarwal et al. (2007) found price as one of the major hurdles to adopt e-services. Wu and Wang (2005) found that perceived cost of m-commerce services is negatively associated with adoption intention. Further, Chong et al. (2012a, 2012b) also reached a similar conclusion in cross-country studies with Malaysian and Chinese customers. It is evident that if the value received is not commensurate with the cost borne, users feel guilty for spending money irrationally or may accuse others of having spent excess money in providing resources of doubtful or limited usefulness. On an individual basis, undue mismatch between the cost and benefit realized from an e-resource will adversely affect usage and continued future adoption. Thus, the overall economic value offered by a product or service, or the lack of it, is generally one of the major factors in driving its adoption, or discouraging it (Carlsson et al., 2006). Such findings describe the pivotal role of economic value in influencing the willingness of users to adopt e-resources. Thus, we hypothesize:
2.6. Satisfaction and Intention to Use
User satisfaction has been found to be very important in affecting the attitude of users toward online information services (Colepicolo, 2015; Shee & Wang, 2008). The term ‘satisfaction’ has been described as “positive attitudes toward using the system” (Joo & Lee, 2011, p. 525). Researchers have identified a positive relationship between user satisfaction and intention to use e-resources (Cheng, 2014; Joo & Choi, 2016). Therefore, we understand that user satisfaction positively and significantly affects the adoption intention of e-resources. This satisfaction, which is a result of fulfilment of perceived values, acts as a surrogate to continued usage intention. Hence, it is hypothesized:
3. METHODOLOGY
The present study followed a descriptive research design and employed simple random sampling for data collection (Madhusudhan, 2010). The data was collected from respondents belonging to the top 50 business schools in the National Capital Region (India) as per the National Ranking Framework (Ministry of Education). Purposive sampling is employed in choosing business schools, assuming that the top business schools provide students with the facility of e-resources (Kumar et al., 2016). Around 2,000 Google forms (Appendix) were sent to the students of different B-schools, out of which a valid response was received from only 242 students enrolled in these business schools. The main cause was the devastating pandemic situation and, in such a situation, it was very much difficult to collect more email-ids of the students. All the students (63 percent male students and 37 percent female students) belonged to two age groups, less than 25 years (78 percent of students) and more than 25 years (22 percent of students). After filling out the demographic information in the survey, a screening question was asked, i.e., “how frequently do you use e-resources” and the options given were: “not very frequently,” “frequently,” or “very frequently.” It was found that all the students were using the e-resources either frequently or very frequently for their information needs.
For the instrument development (i.e., questionnaire development), the scales are adopted from previous studies. The value dimensions derived for using e-resources – utilitarian value and hedonic value scales – were adopted from Sirdeshmukh et al. (2002), and Sweeney and Soutar (2001) respectively. Uniqueness value and epistemic value scale items were borrowed from Tian and McKenzie (2001) and Lu et al. (2008), respectively. Economic value scale items were adopted from Dodds et al. (1991). The scale of satisfaction has been adopted from Thong et al. (2006) and Lee et al. (2009). Finally, items for measuring intention to use e-resources were adopted from Hu et al. (2009). The final questionnaire consisted of 26 items and was measured on a five-point Likert scale.
The adopted scale items were firstly tested by conducting a pilot study through an online survey. The collected data was analyzed to test the reliability of the scale. Internal consistency measures the consistency among a group of items that are combined to form a scale. It is “an indicator of how well the different items measure the same things” (Black, 1999). Coefficient alpha can be used to measure the reliability (Cronbach, 1951). The Cronbach alpha value of each scale is found to be more than 0.7, which ensured the reliability of each scale. Further, the exploratory factor analysis was applied to test the construct validity.
Construct validity is “the degree to which a measure is related to other measures in a way consistent with the concepts based on theory” (Carmines & Zeller, 1979). Factor analysis is commonly known as data reduction and summarization technique and is applied to measure whether the model adopted in the study is fit or not. Factor analysis has been identified as an indispensable measure for construct validity (Kerlinger, 1986). All 26 items were entered in principal component analysis and their initial communalities were found to be more than 0.5. Furthermore, all factors were found to have eigenvalues greater than one. The Kaiser-Meyer-Olkin measure of sampling adequacy for all the measures was found to be greater than 0.60. Bartlett’s test of sphericity was also found significant (p=0.000 < 0.01), which proves adequate inter-correlations between variables. Factor loadings were also found to be greater than 0.4 (Hair et al., 2010). Thus, no item was dropped from the study.
4. ANALYSIS AND FINDINGS
The research model was tested through a two-step method as suggested by Anderson and Gerbing (1988) using AMOS 18.0 software. First, a confirmatory factor analysis (CFA) approach has been used to test the measurement model in order to verify the reliability and validity of the instrument. Second, through a structural equation modelling (SEM) approach, the assessment of the structural model has been performed and the developed hypotheses were tested. For critical testing of the model, the sample size should not be less than five times and should not be greater than ten times the number of parameters (Bentler & Chou, 1987). Also, a minimum sample of 200 is necessarily required to perform such a type of study (Hoetler, 1983). In this study, both the conditions of selecting appropriate sample size are satisfied as we have collected the data from 242 respondents.
4.1. Measurement Model
In the SEM method, the measurement model is evaluated to assess the reliability and validity of the instrument followed by analyzing the structural model to test hypotheses (Anderson & Gerbing, 1988). A seven factor 26-item model was set up in order to check the reliability and validity of the instrument used in this study. The CFA approach was used in order to test the measurement model and the results of the measurement model are shown in Table 1.

Results of confirmatory factor analysis, validity analysis, and reliability test
To analyze the measurement model, it is necessary to focus on three different types of analyses. First, it is required to check the reliability of the model, so we have computed the average variance extracted (AVE) and composite reliability (CR) for each construct and squared multiple correlation of each item of the instrument. The result shown in Table 1 reveals that the values of AVE and CR exceed the minimum cut off, i.e., 0.5 and 0.7 respectively (Hair et al., 2010; Nunnally, 1978). All these values indicate good reliability levels which subsequently highlights highly consistent results. This indicates that CFA demonstrates an acceptable range of reliability results for all constructs. The reliability of all the constructs already checked through Cronbach α coefficient whose minimum cut-off value is 0.7 (Hair et al., 1998; Nunnally, 1978). The results of the reliability coefficient are also depicted in Table 1.
In the next step, the validity of all the constructs is checked through assessing logical dimensions (i.e., face and construct validity) and statistical dimensions (discriminant and convergent validity) of validity. Since all the scales were adopted from past literature they have strongly exhibited the content and face validity of all the items and constructs. As for the assessment of convergent validity, the criterion specified by Anderson and Gerbing (1988) has been adopted. According to them, for every item the standard loadings should be significant for t>1.96 (p<0.001), and the results of CFA shown in Table 1 verify the uni-dimensionality and good convergent validity of all the items and demonstrates that all of them are representing their constructs. Following this, to check the discriminant validity, the procedure suggested by Fornell and Larcker (1981) has been adopted in this study. As per Fornell and Larcker (1981), the square root of AVE should be greater than the correlation coefficient, which indicates that every construct is distinct from the other. The results, shown in Table 2, exhibit an accepted level of discriminant validity.
Discriminant validity
In the third analysis, we have checked the overall model fit indices. As per Bagozzi and Yi (1988) and Hair et al. (2010), the minimum acceptable values for model fit indices are good of fitness index (GFI)>0.9, adjusted goodness of fit index (AGFI)>0.8, incremental fit index (IFI)>0.9, Tucker-Lewis index (TLI)>0.9, comparative fit index (CFI)>0.9, root mean square error of approximation (RMSEA)<0.08, and χ2/df<3. The results of the fit indices of the model are χ2=348.221, p=0.002, χ2/df= 1.257, GFI=0.907, AGFI=0.883, IFI=0.974, TLI=0.969, CFI=0.974, and RMSEA=0.033. All these values exceed the minimum cut-off criteria, hence they are accepted for the measurement model.
4.2. Structural Model
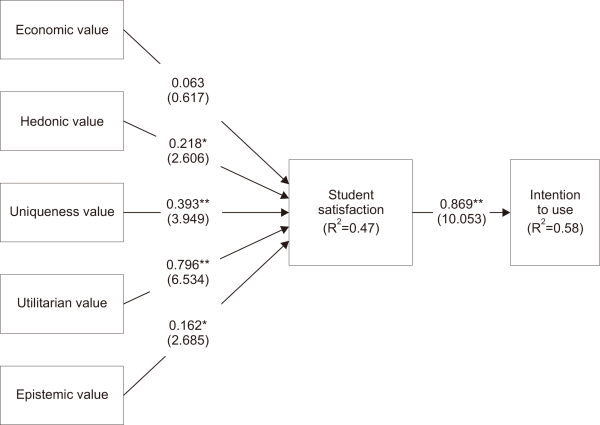
After substantiating the validity of the measurement model, the next step is to verify the structural model as well as to test the suggested hypotheses. For this purpose, SEM method is chosen in order to assess the validity of the complete research model depicted in Fig. 1. The results of the overall fit indices of the structural model are χ2=351.517, p=0.003, χ2/df=1.247, GFI=0.906, AGFI=0.884, IFI=0.975, TLI=0.971, CFI=0.975, and RMSEA=0.032. All these values exceed the minimum cut-off values prescribed by Bagozzi and Yi (1988), Hair et al. (2010), and Adams et al. (1992). Hence, these values are accepted for the structural model.

Results of structural model. Standardized path coefficients are shown (t values are mentioned in parentheses), Absolute t-value >1.96, **p<0.005, *p<0.05.
4.3. Hypothesis Testing
The results of hypothesis testing are shown in Table 3. This table shows the properties of causal paths which include standardized coefficients (β), standard error, and t-value. This table has also documented the verified results of all six hypotheses proposed in the current study. According to this table, if the p-value is less than 0.05, then the independent variable significantly impacts the dependent variable (Hair et al., 2010). Only a single hypothesis does not suggest any relationship between the economic value and satisfaction level of the students. It was not supported because of the t value, which is 0.617 (p>0.05), and it is statistically insignificant. Hypotheses 2 to 5 highlighted the individual relationship of hedonic value, uniqueness value, utilitarian value, and epistemic value with student satisfaction. These all were also supported because the t values of all these hypotheses were (H2: t=2.606, p<0.05; H3: t=3.949, p<0.005; H4: t=6.534, p<0.005; H5: t=2.685, p<0.05) and all were found statistically significant. Hypothesis 6 also highlights a positive (+) relationship between student satisfaction and intention to use. This hypothesis was also supported because of the t value, which is 10.053 (p<0.005), and was also found statistically significant. The coefficient of determination (R2) explains the percentage of variance in the dependent variable accounted for by independent variables (Hair et al., 2010). The explanatory power of R2 for student satisfaction and intention to use were 0.47 and 0.58 respectively.
Results of hypothesis testing
5. DISCUSSION
The present study empirically tested the dimensions of value metrics to drive satisfaction and intention to use e-resource among its users. For this purpose, five values were identified and empirically tested, including utilitarian, hedonic, uniqueness, epistemic, and economic values. The individual model reveals that utilitarian values, hedonic values, uniqueness values, and epistemic values significantly impact the satisfaction of users and continued usage intention of e-resources. However, economic value was not found to be affecting the intention to use e-resources significantly. It has also been found that business students perceive utilitarian value as the most influential value, arousing continuous intention as compared to hedonic values, epistemic values, and uniqueness values. In other words, business students prefer a quick and convenient way of accessing information out of e-resources to develop academic excellence. These results are in line with existing literature. The utility of the online resources has been prominently identified in its adoption as well as continued intention.
Other important values, apart from utilitarian value, are recognized as uniqueness, hedonic, and epistemic values. The uniqueness value is found to be the second most preferred user value, which means that students’ satisfaction and usage intention also hinges on their personal image in today’s competitive class environment. Besides this, e-resources also help students in acquiring knowledge and achieving an extra edge over their peers. Furthermore, the hedonic and epistemic values also significantly impact satisfaction and intention to use e-resources. It is possibly because of this reason that students not only strive to acquire new information but also feel relaxed and accomplished in using e-resources. These values satisfy the personal and emotional interests of the user and follow the utility value closely.
The economic value, although expected to be the most important factor affecting usage of e-resources, is found to be insignificant in the present study. This result is primarily due to the fact that the students do not have any idea about the price for getting access to e-resources. The business schools do not charge for e-resources separately and student fees are inclusive of charges for e-resource access and use. The subscription costs are paid by the institutes on a recurring basis, which students are completely unaware of (Habiba & Ahmed, 2021). Thus, the students do not have any realization of the price/cost of e-resources. This also suggests an important implication for institutions/universities in that they should make students realize the economic value of these resources.
The present study is a unique piece of work as many studies conducted on e-resources were descriptive studies and very few have contributed empirical findings. Further, the findings of this study are in line with few previous research efforts, where utilitarian and hedonic values were found to influence the use of e-resources (Garg et al., 2017; Ha & Jang, 2010). However, in contrast to Agarwal et al. (2007) and Chong et al. (2012a, 2012b), this study reveals an insignificant impact of economic value on satisfaction and intention to adopt e-resources among its users.
6. CONCLUSION
The present study captures the impact of dimensions of perceived values on satisfaction and intention to use e-resources. The four dimensions of perceived value, i.e., utilitarian, hedonic, uniqueness, and epistemic values, are found to have significant impact on satisfaction and behavioural intention to use e-resources. The utilitarian value is found to be the most preferred for students’ satisfaction, which resonates with a study conducted by Zeglat et al. (2016). Moreover, all these perceived values need to be taken care of to keep a high level of satisfaction among students. Nonetheless, the economical perceived value was found to have an insignificant impact on satisfaction and behavioural intention to use e-resources. Thus, following the findings of the study, it is concluded that institutions need to make their students realize the importance of the economic value of the e-resources.
6.1. Implications, Limitations, and Scope for Future Research
The present study is a distinctive piece of work and a maiden attempt at investigating the most and least significant perceived value(s) associated with satisfaction and usage intentions of e-resources. This study can be helpful for institutions and e-resource providers so as to satisfy the values perceived to be important by users. Institutions may acquire e-resources keeping in mind these perceived values factors. Institutes may also share the valuable feedback of students with e-resource providers to make them able to provide a better experience to students. Moreover, students can also participate in the co-creation of these e-resources. Therefore, future studies may explore factors associated with co-creation of e-resources and study their impact on the satisfaction level of students.
However, this study is limited in scope in the sense of selection of target user group, which was business school students at institutes in the National Capital Region. The scope can be expanded to cover other demographic dimensions, both in terms of geography and other institutions of other academic fields. This study also leaves scope for collective study of factors affecting the highlighted values. There is further scope for studying user satisfaction as a function of fulfilment of identified values in relation with e-resources, and then establishing connects between satisfaction and continued intention of usage. Moreover, the present study is generic in nature and considered all the e-resources, but future studies may consider specific e-resources and conduct case-based research for more fruitful results.
REFERENCES
, (1981) Structural equation models with unobservable variables and measurement error: Algebra and statistics https://deepblue.lib.umich.edu/bitstream/handle/2027.42/35622/b1378752.0001.001.pdf
(1996) The interrelationship between customer and consumer value Asia Pacific Advances in Consumer Research, 2, 60-63 https://www.acrwebsite.org/volumes/11532/volumes/ap02/AP-02.
, , (2012) Information resource selection of undergraduate students in academic search tasks Information Research, 17(1), 511 http://informationr.net/ir/17-1/paper511.html.
, (2009) Factors affecting information communication technologies usage and satisfaction: Perspective from instant messaging in Kuwait Journal of Global Information Management, 17(2), 1-29 http://doi.org/10.4018/jgim.2009040101.
, , (2016) The impact of the e-service quality (E-SQ) of online databases on users' behavioural intentions: A perspective of postgraduate students International Review of Management and Marketing, 6(1), 1-10 https://www.econjournals.com/index.php/irmm/article/view/1431.