1. INTRODUCTION
Altmetrics or article-level metrics are alternative indicators that measure the social impact of scholarly outputs by gauging online discussion on research outputs from different platforms, chiefly social media, reference managers, news & policy documents, social bookmarking, and mainstream traditional media outlets (Ali, 2021; Daraio, 2021). Although altmetrics is a new concept, the investigation into altmetrics is escalating wildly compared to traditional citation metrics (Kwok, 2013). As a result, the debate on whether newly emerged social media metrics will replace traditional metrics for measuring impact is still going on. Many of the studies ratified that altmetrics can be used as a supplement for showing instantaneous societal impact along with scientific impact because of the positive association between these two metrics (Costas et al., 2015; Haustein et al., 2014b; Schlögl et al., 2014; Zhang et al., 2019; Zuccala et al., 2015). On the other hand, a handful of studies opposed this proposal, citing a negative and weak correlation (Chi et al., 2019; Gumpenberger et al., 2016; Haustein et al., 2014a; Thelwall et al., 2013). Since the magnitude of association between these metrics varies from weak to strong from domain to domain, it is unsure to conclude whether altmetrics can replace traditional metrics or can only be a complement due to positive correlation, or if it cannot replace or cannot complement due to negative correlation (Barnes, 2015; Thelwall, 2021). On account of all these issues, controversy still exists among the scientometric community across the globe and disciplines. The best solution is to pool the entirety of associations (both positive and negative) and vindicate the final pooled correlation coefficient (PCOR) by conducting a meta-analysis. Meta-analysis is usually employed to assess quantitative information from interconnected studies and generate results that encapsulate a whole body of research (Riley et al., 2011).
Studies assessing the pooled correlation between citation metrics and altmetrics have rarely been found in the scholarly world. Kolahi et al. (2021) reported a positive weak pooled correlation between citations and altmetric attention scores (AAS) (r=0.19; 95% confidence interval [CI], 0.12 to 0.25) when 27 health science-related studies were subjected to meta-analysis. In another comprehensive meta-synthesis, Bornmann (2015) reported the magnitude of the pooled correlation between citations and three social media indicators as negligible (microblogging, r=0.003), small (blog count, r=0.12), and medium to large (CiteULike, r=0.23 and Mendeley, r=0.51) after assessing a handful of studies that happened in prime disciplines. Other systematic reviews conducted by Patthi et al. (2017) and Araujo et al. (2021), by exploring outputs from various disciplines, primarily medical and health science, discovered a positive association between these two metrics.
As far as the library and information science (LIS) domain is concerned, a few studies were found narrating the association between traditional metrics and social media metrics under the article category of ‘review / systematic reviews’ (Borah & Madhusudhan, 2022; Sugimoto et al., 2017; Tahamtan & Bornmann, 2020). However, the longstanding debate of whether the new generation metrics replace or complement the old citation metrics has been extended to the LIS domain too, and no attempt with a meta-analysis approach has been undertaken hitherto to contribute to this debate. Thus, the present study bridges this gap by pooling the correlation reported in LIS outputs between citation metrics and social media indicators. The value of the pooled correlation decides whether they are positively or negatively correlated, and also at what magnitude for the outputs would contribute to the current dispute in general and LIS discipline in specific.
2. METHODS
2.1. Formatting the Review Question and Outcome
The review question is framed to determine the PCOR between classic metric and altmetric indicators of the LIS articles that satisfies the eligibility criteria.
2.2. Search Strategy
Mainly Google Scholar, Scopus, and ResearchGate databases were searched for articles collected during the last week of November 2021. The keywords included ‘Altmetrics of LIS articles,’ ‘Altmetrics of library and information science articles,’ and ‘Correlation between citations and altmetric indicators of LIS articles,’ which were carried out as free searches in Google Scholar and ResearchGate, and in ‘Search within’ fields as ‘article title, abstracts, keywords’ in the Scopus database.
2.3. Eligibility, Inclusion, and Exclusion Criteria
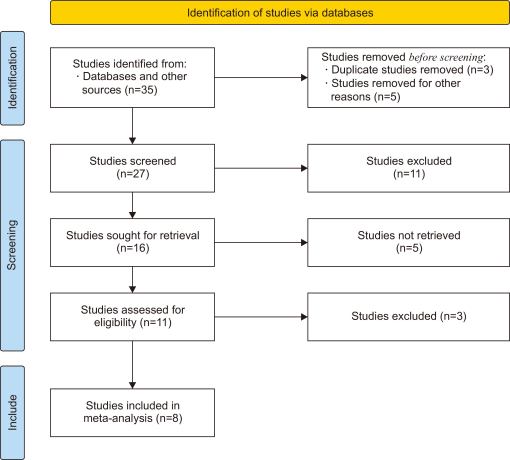
The LIS articles were selected following the systematic review guidelines (Sensuse et al., 2021). Later, documents were identified and screened through Preferred Reporting Items for Systematic Reviews and Meta-analyses (PRISMA) guidelines (Fig. 1). Only peer-reviewed articles published in the English language were considered. Other research outputs like review articles, letters, and articles in press and conference papers were excluded since these research outputs did not have enough altmetrics for the analysis. Also, studies did not take place at large in the LIS domain. Furthermore, those articles which inquire about the association between classic metric indicators and social media metric indicators were considered. For conducting the meta-analysis, articles that attempted to correlate traditional citation indicators, majorly ‘citations’ (journal impact factor [Art. no. 4] and impact points [Art. no. 3] in the absence of citations) with social media indicators, primarily ‘altmetric attention scores (AAS)’ (Mendeley metrics [Art. no. 1], Twitter mentions [Art. no. 2], ResearchGate score (RG score) [Art. no. 3], and social media indicators [Art. no. 5] in the absence of AAS) were considered. RG score has been treated as a significant source of altmetrics in this study after referring to previously published articles (Ahmad, 2019; Shrivastava & Mahajan, 2015). Studies with sub-studies (Art. nos. 7 & 8) and those not having identical/standalone traditional or social media indicators like ‘citations’ or ‘altmetric attention score’ (Art. no. 11) were excluded from the meta-analysis. Contrary to Article 11 (Art. no. 11), the first and second article (Art. nos. 1 & 2) have been taken for the meta-analysis after considering that the study tried to correlate Mendeley and Twitter metrics chiefly against classic indicators (See Table 1 for details). Articles having no keywords such as ‘Altmetrics of LIS’ or ‘Correlation between citations and altmetric indicators of LIS’ in the title were also included (Art. nos. 1, 2 & 4) after acknowledging that the article tried to correlate citation indicators with altmetric indicators (Mendeley or Twitter) predominantly.

PRISMA (Preferred Reporting Items for Systematic Reviews and Meta-analyses) flow diagram.

Characteristics/details of the articles selected for the study (including excluded studies)
2.4. Meta-Analysis
The meta-analysis was carried out by using two major software packages, viz. MedCalc 20.015 (trial version) and Meta-Mar, a free online meta-analysis service accessible at https://www.meta-mar.com. The minimum number of samples for carrying out a meta-analysis is two (Israel & Richter, 2011; Ryan, 2016), and in Meta-Mar it was four, and the correlation coefficient ranged from zero to one (Meta-Mar, 2021). The effect sizes were computed by using Fisher’s transformation of correlations. The formula to transform r to a z-score is z’=.5[ln(1+r)–ln(1-r)] (Statistics How To, 2022). Data were analyzed using the random effects model (REM) since the study involved considerable heterogeneity (I2>75%, p<0.05). The value of heterogeneity varies from 0 to 100% and can be treated as 25% low heterogeneity, 50% medium heterogeneity, and 75% high/considerable heterogeneity (Higgins et al., 2003).
2.5. Characteristics of the Included Studies
The result according to Table 1 shows that out of eleven studies, five studies (Cho, 2021; Ezema & Ugwu, 2019; Htoo & Na, 2017; Saberi & Ekhtiyari, 2019; Zhao & Wolfram, 2015) had sub-studies by correlating citations with other altmetric indicators. As opposed to these studies, Mohammadi and Thelwall (2014), Ali and Richardson (2017), Vysakh and Rajendra Babu (2021), and Rangaswamy and Rajendra Babu (2021) examined the correlation between two prime indicators, i.e., citations and AASs. Furthermore, the studies were based on citations from different databases, majorly Web of Science and Google Scholar, and the total sample size accounted for 22,468. The studies reported negative and positive associations once citation indicators correlated against different altmetric indicators. Two correlation methods, i.e., Spearman and Pearson, were recognized and the correlation value ranged from -.189 to 0.93.
3. RESULTS
Following the guidelines given by Erasmus Rotterdam Institute of Management for interpreting meta-analysis results (Hak et al., 2022), firstly we present a forest plot for all the articles with pooled correlation and heterogeneity; secondly, forest plots for subgroup analysis based on the source of citations, and finally, a funnel plot for exhibiting the publication bias among the articles selected for the analysis.
3.1. Meta-Analysis for All the Included Articles
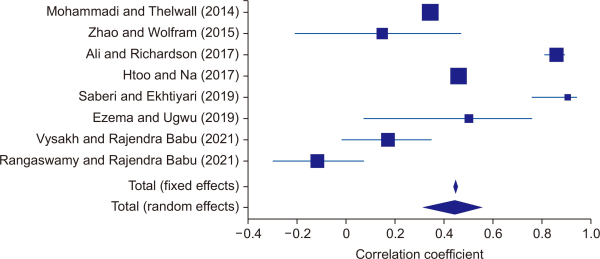
Meta-analysis was carried out between the classic metric indicators and social media metric indicators of the eight eligible LIS articles. Fig. 2 shows the forest plot for the meta-analysis. The X-axis shows the correlation coefficient values of each study. The Y-axis shows the corresponding study’s lead author and year of publication. The size of the boxes in blue colour shows the number of samples, and a larger size represents a higher sample size. The blue diamonds represent the investigated articles’ total fixed and random effects. In the meta-analysis, the fixed-effect model assumes the underlying effect is the same across all studies, and the REM assumes heterogeneous effects across studies (Mantel & Haenszel, 1959; DerSimonian & Laird, 1986). The aggregate samples from all eight studies were 22,468. Except for one article, i.e., Rangaswamy and Rajendra Babu (2021), all other remaining studies reported a positive correlation. The highest positive correlation was observed for the fifth and third studies, i.e., Saberi and Ekhtiyari (2019) (rho=0.95) and Ali and Richardson (2017) (rho=0.90) (Appendix 1).

Forest plot for the meta-analysis.
3.2. Pooled Correlation and Heterogeneity
As per Table 2, the PCOR was 0.47 (95% CI, 0.339 to 0.586) for the REM. The general heterogeneity was high for the articles (I2=96.2%), representing the variability in the selected studies. If the heterogeneity is very high, the REM is nearly equal regardless of the number of samples reporting a meta-analytic summary close to the more easily calculated arithmetic mean of each study’s results.
Pooled correlation and heterogeneity
3.3. Sub-Group Analysis Based on the Source of Citations
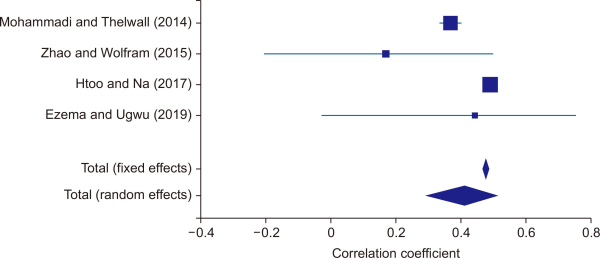
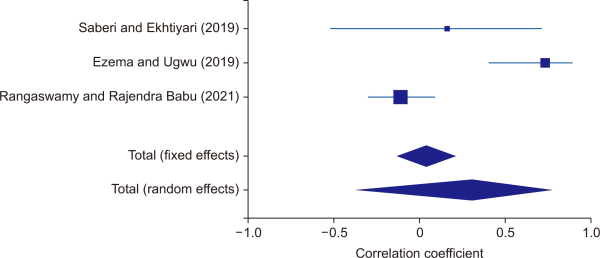
Since the overall meta-analysis result showed considerable heterogeneity, sub-group analysis was carried out to know the correlation variation based on the source of citations. For this purpose, four articles whose source of citations is from Web of Science (Fig. 3) and three articles whose source of citations is from Google Scholar (Fig. 4) were subjected to the analysis, including articles having sub-studies (Ezema & Ugwu, 2019). The remaining two studies, i.e., Ali and Richardson (2017) and Vysakh and Rajendra Babu (2021) were not considered owing to the lack of number of studies to carry out meta-analysis based on the source of citations. The result showed that the PCOR for Web of Science articles was 0.41 (95% CI, 0.292 to 0.515), and for Google Scholar, it was 0.30 (95% CI, -0.373 to 0.771).

Meta-analysis of articles from Web of Science.

Meta-analysis of articles from Google Scholar.
3.4. Publication Bias
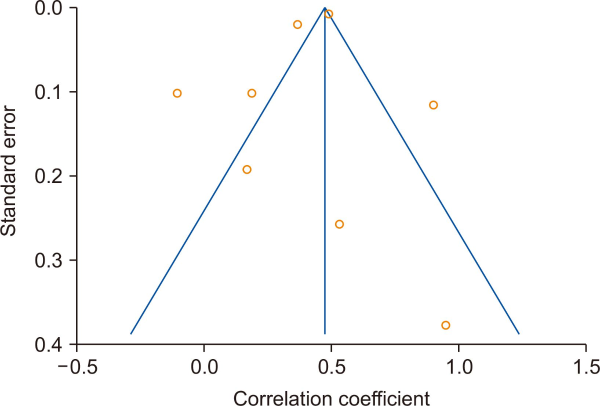
Fig. 5 and Appendix 2 demonstrate the funnel plot and the result of Egger’s test and Begg’s test applied to determine the publication bias in the articles selected for the study. The symmetry of the diagram shows that no publication bias existed, and Egger’s (p-value=0.82) and Begg’s test (p-value=0.25) confirmed the same since the p-value stood higher than 0.05 (p>0.05).

Funnel plot for publication bias.
4. FINDINGS AND DISCUSSION
To our best knowledge, this is the first meta-analysis to quantify the pooled correlation between classic metric indicators and altmetric indicators of LIS research articles. We estimated the pooled correlation between citation metric indicators from five prime databases: Web of Science, Google Scholar, Scopus, Dimensions, and ResearchGate (as a source of altmetrics also), with the altmetric indicators of selected eight articles published between 2014 and 2021. The articles qualified for meta-analysis exhibited positive and negative correlations between citation indicators with various altmetric indicators and had considerable heterogeneity (I2=96.2%). As a result, we followed the REM for the analysis. Israel and Richter (2011) opined that “there are no accepted guidelines for when a meta-analysis should not be completed due to statistical heterogeneity, and it is left to the author’s discretion to determine if a meta-analysis is appropriate.” The result of the REM exhibited a PCOR of 0.47 (95% CI, 0.339 to 0.586) between citation indicators with altmetric indicators, which are treated as a medium correlation (Cohen, 1988).
When we carried out the sub-group analysis based on the source of citations, we discovered that articles indexed on the Web of Science showed a higher PCOR (0.41) than articles indexed in Google Scholar (0.30). The possible reason for this could be that the articles indexed in the Web of Science subjected to analysis include higher samples than those indexed in Google Scholar. In addition, the negative correlation of one article (Art. no. 10) estimated at -.106 as per the Spearman correlation indexed on Google Scholar could also be a possible reason.
We also inspected the publication bias among the articles through funnel plot and Eggers and Begg’s test. The reason for conducting the Eggers test was that if the study involved considerable heterogeneity and the number of articles was less than ten, the visual inspection of the funnel plot would not be enough to interpret the publication bias. Therefore, the Eggers test will be preferred (Simmonds, 2015). The result of the tests discovered zero publication bias since Egger’s test for a regression intercept reported a p-value of 0.82, and Begg’s test for rank correlation demonstrated a p-value of 0.25.
5. CONCLUSION
Studies galore have investigated the association between traditional metrics and altmetrics to decide the novelty of the newly emerged social media metrics to use as a replacement or supplement to measure the immediate and broad impact of research. The association between these metrics varied from positive to negative (weak to strong) from domain to domain. As per our study findings, the PCOR shows a low (sub-group analysis) to a medium association (for all the articles, Fig. 2) for LIS articles. Thus it can be concluded that for LIS articles, the AAS and other significant indicators, i.e., Mendeley and Twitter, show similar characteristics to traditional citation metric indicators. Thus it can be used as a proxy for measuring the immediate invisible impact of LIS research articles.
The present study has some limitations. First, the study is limited to conducting meta-analysis between citation indicators with a few altmetric indicators, as explained in the ‘eligibility, inclusion and exclusion criteria’ section. Out of the eleven studies, three were omitted from subjecting to overall meta-analysis even though two studies tried to correlate citation with altmetric score but have had sub-studies (Verma & Madhusudhan, 2019a, 2019b). Contrary to this, studies having sub-studies were also considered for sub-group analysis based on the source of citations. Another possibility for sub-group analysis by considering sampling methods has not been explored. Future studies can observe how the correlation between citation and altmetric indicators varies over time.
Furthermore, a comprehensive meta-synthesis should be conducted between classic and social metric indicators to understand the existing friction better. Similar meta-analyses or syntheses can be conducted in other domains to understand whether altmetrics exhibits the same feature as classic metrics. If so, the potential of the newly emerged social media metrics in the quick social impact evaluation of research in that particular domain can be substantiated.
REFERENCES
(2019) Profiles of AMU and JNU researchers on Researchgate: An altmetric analysis Kelpro Bulletin, 23(1), 101-112 https://www.academia.edu/42459122/Profiles_of_AMU_and_JNU_Researchers_on_Researchgate_An_Altmetric_Analysis.
(2021) Understanding the altmetrics Seminars in Ophthalmology, 36(5-6), 351-353 https://doi.org/10.1080/08820538.2021.1930806.
, (2017) Pakistani LIS scholars' altmetrics in ResearchGate Program, 51(2), 152-169 https://doi.org/10.1108/PROG-07-2016-0052.
, , , , (2021) What are the variables associated with Altmetric scores? Systematic reviews, 10(1), 193 https://doi.org/10.1186/s13643-021-01735-0. Article Id (pmcid)
(2015) The use of altmetrics as a tool for measuring research impact Australian Academic & Research Libraries, 46(2), 121-134 https://doi.org/10.1080/00048623.2014.1003174.
(2015) Alternative metrics in scientometrics: A meta-analysis of research into three altmetrics Scientometrics, 103(3), 1123-1144 https://doi.org/10.1007/s11192-015-1565-y.
, , (2019) Comparing capture, usage and citation indicators: an altmetric analysis of journal papers in chemistry disciplines Scientometrics, 120(3), 1461-1473 https://doi.org/10.1007/s11192-019-03168-y.
(2021) Altmetrics analysis of highly cited academic papers in the field of library and information science Scientometrics, 126(9), 7623-7635 https://doi.org/10.1007/s11192-021-04084-w.
, , (2015) Do "altmetrics" correlate with citations? Extensive comparison of altmetric indicators with citations from a multidisciplinary perspective Journal of the Association for Information Science and Technology, 66(10), 2003-2019 https://doi.org/10.1002/asi.23309.
(2021) Altmetrics as an answer to the need for democratization of research and its evaluation Journal of Altmetrics, 4(1), 5 https://doi.org/10.29024/joa.43.
, (1986) Meta-analysis in clinical trials Controlled Clinical Trials, 7(3), 177-188 https://doi.org/10.1016/0197-2456(86)90046-2.
, (2019) Correlating research impact of library and information science journals using citation counts and altmetrics attention Information Discovery and Delivery, 47(3), 143-153 https://doi.org/10.1108/IDD-08-2018-0029.
, , (2016) The ecstasy and the agony of the altmetric score Scientometrics, 108(2), 977-982 https://doi.org/10.1007/s11192-016-1991-5.
, , (2022) How to interpret results of meta-analysis. (Version 1.0) https://www.erim.eur.nl/research-support/meta-essentials/interpret-results
, , , , (2014a) Astrophysicists on Twitter: An in-depth analysis of tweeting and scientific publication behavior Aslib Journal of Information Management, 66(3), 279-296 https://doi.org/10.1108/AJIM-09-2013-0081.
, , , , , (2014b) Coverage and adoption of altmetrics sources in the bibliometric community Scientometrics, 101(2), 1145-1163 https://doi.org/10.1007/s11192-013-1221-3.
, , , (2003) Measuring inconsistency in meta-analyses BMJ, 327(7414), 557-560 https://doi.org/10.1136/bmj.327.7414.557. Article Id (pmcid)
, (2017) Disciplinary differences in altmetrics for social sciences Online Information Review, 41(2), 235-251 https://doi.org/10.1108/OIR-12-2015-0386.
, (2011) A guide to understanding meta-analysis The Journal of orthopaedic and sports physical therapy, 41(7), 496-504 https://doi.org/10.2519/jospt.2011.3333.
, , , , , (2021) Meta-analysis of correlations between altmetric attention score and citations in health sciences BioMed Research International, 2021, 6680764 https://doi.org/10.1155/2021/6680764. Article Id (pmcid)
(2013) Research impact: Altmetrics make their mark Nature, 500(7463), 491-493 https://doi.org/10.1038/nj7463-491a.
, (1959) Statistical aspects of the analysis of data from retrospective studies of disease Journal of the National Cancer Institute, 22(4), 719-748 https://doi.org/10.1093/jnci/22.4.719.
Meta-Mar (2021) Meta-analysis: Correlation model https://meta-mar.shinyapps.io/meta-analysis-calculator/
, (2014) Mendeley readership altmetrics for the social sciences and humanities: Research evaluation and knowledge flows Journal of the Association for Information Science and Technology, 65(8), 1627-1638 https://doi.org/10.1002/asi.23071.
, , , , , , , (2017) Altmetrics - A collated adjunct beyond citations for scholarly impact: A systematic review Journal of Clinical and Diagnostic Research, 11(6), ZE16-ZE20 https://doi.org/10.7860/JCDR/2017/26153.10078. Article Id (pmcid)
, (2021) A correlation comparative analysis of top articles in library and information science using citation and altmetric attention scores SRELS Journal of Information Management, 58(3), 157-164 https://doi.org/10.17821/srels/2021/v58i3/158132.
, , (2011) Interpretation of random effects meta-analyses BMJ, 342, d549 https://doi.org/10.1136/bmj.d549.
(2016) Cochrane consumers and communication group reviews: Meta-analysis http://cccrg.cochrane.org/sites/cccrg.cochrane.org/files/public/uploads/meta-analysis_revised_december_1st_1_2016.pdf
, (2019) Usage, captures, mentions, social media and citations of LIS highly cited papers: An altmetrics study Performance Measurement and Metrics, 20(1), 37-47 https://doi.org/10.1108/PMM-10-2018-0025.
, , , , (2014) Comparison of downloads, citations and readership data for two information systems journals Scientometrics, 101(2), 1113-1128 https://doi.org/10.1007/s11192-014-1365-9.
, , (2021) Exploring factors influencing knowledge sharing mechanisms and technology to support the collaboration ecosystem: A review DESIDOC Journal of Library & Information Technology, 41(3), 226-234 https://doi.org/10.14429/djlit.41.03.16609.
, (2015) Relationship amongst ResearchGate altmetric indicators and Scopus bibliometric indicators: The case of Panjab University Chandigarh (India) New Library World, 116(9/10), 564-577 https://doi.org/10.1108/NLW-03-2015-0017.
(2015) Quantifying the risk of error when interpreting funnel plots Systematic Reviews, 4, 24 https://doi.org/10.1186/s13643-015-0004-8. Article Id (pmcid)
Statistics How To (2022) What is Fisher Z-Transformation? https://www.statisticshowto.com/fisher-z
, , , (2017) Scholarly use of social media and altmetrics: A review of the literature Journal of the Association for Information Science and Technology, 68(9), 2037-2062 https://doi.org/10.1002/asi.23833.
, (2020) Altmetrics and societal impact measurements: Match or mismatch? A literature review Profesional De La información, 29(1) https://doi.org/10.3145/epi.2020.ene.02.
(2021) Measuring societal impacts of research with altmetrics? Common problems and mistakes Journal of Economic Surveys, 35(5), 1302-1314 https://doi.org/10.1111/joes.12381.
, , , (2013) Do altmetrics work? Twitter and ten other social web services PLoS One, 8(5), e64841 https://doi.org/10.1371/journal.pone.0064841. Article Id (pmcid)
, (2019a) Altmetric analysis of highly cited publications on digital library in Brazil and India: A comparative study Library Philosophy and Practice, 2273 https://digitalcommons.unl.edu/libphilprac/2273.
, (2019b) An altmetric comparison of highly cited digital library publications of India and China Annals of Library and Information Studies, 66(2), 71-75 https://core.ac.uk/download/pdf/229208328.pdf.
, (2021) Altmetrics linked scholarly information from Dimensions.ai datasets for the top 100 LIS articles SRELS Journal of Information Management, 58(3), 197-208 https://doi.org/10.17821/srels/2021/v58i3/158563.
, , , , , (2019) An effectiveness analysis of altmetrics indices for different levels of artificial intelligence publications Scientometrics, 119(3), 1311-1344 https://doi.org/10.1007/s11192-019-03088-x.
, (2015) Assessing the popularity of the top-tier journals in the LIS field on Twitter Proceedings of the Association for Information Science and Technology, 52(1), 1-4 https://doi.org/10.1002/pra2.2015.145052010092.
, , , (2015) Altmetrics for the humanities: Comparing Goodreads reader ratings with citations to history books Aslib Journal of Information Management, 67(3), 320-336 https://doi.org/10.1108/AJIM-11-2014-0152.