1. INTRODUCTION
Recently, approaches to solving social problems based on data are in the spotlight as data processing technology develops and computational power increases. For example, Jha et al. (2017) reviewed and discussed the role of artificial intelligence (AI) approaches in the control, decision, simulation, and optimization of renewable energy systems. Cao et al. (2018) described various deep learning (DL)-based applications for biomedical informatics, such as medical image analysis, genomic sequencing and gene expression analysis, and protein structure prediction. Imran et al. (2014) presented a platform called Artificial Intelligence for Disaster Response (AIDR), which filters and classifies messages posted to social media during humanitarian crises in real time. Such data-driven approaches are increasingly being applied in the various fields of science and technology, and in the recent few years, attempts have been made to apply them to the prediction of weather phenomena in which various dynamical and thermodynamic factors interact complicatedly (e.g., Jeong et al., 2021; Ravuri et al., 2021; Shi et al., 2015, 2017; Sønderby et al., 2020).
Meanwhile in Korea, heavy rain is one of the representative factors of natural disasters that cause enormous economic damage and casualties every year. Accurate prediction of heavy rainfall over the Korean peninsula is very difficult due to its geographical features, located between the Eurasian continent and the Pacific Ocean at mid-latitude, and the influence of the summer monsoon (Hong, 2004; Song et al., 2019). In addition, spatio-temporal fluctuations in dynamic and thermodynamic conditions around the Korean peninsula, due to long term climate change, affect the characteristics of summer rainfall, which may act as another factor that prevents accurate precipitation forecast (Ho et al., 2003).
In order to deal with such problems, the Korea Meteorological Administration (KMA) operates not only traditional meteorological instruments such as radiosonde for upper level observation and automatic weather station (AWS) for ground observation, but also state-of-the-art remote observation equipment such as dual polarization radar (Kim et al., 2012) and geostationary satellites (Chung et al., 2020). Meteorological products of the Geo-KOMPSAT 2A (GK2A) satellite launched by Korea on December 5, 2018 provide high quality spatio-temporal observations with 0.5-2 km resolutions every two minutes around the Korean peninsula and ten minutes for the full disk area (Chung et al., 2020; J. H. Han et al., 2020). As well, the Korea Institute of Atmospheric Prediction Systems (KIAPS) has developed a new global atmospheric model system called the Korean Integrated Model (KIM) through a national project carried out from 2011 to 2019, and KIM has been used as an operational medium-range forecast model since 2020 (Hong et al., 2018; Shin et al., 2022).
The aforementioned observation networks and the numerical weather prediction (NWP) model play a pivotal role in weather forecasting. However, for precipitation nowcasting, which is very short-term rainfall prediction over a period from the present to about six hours ahead, the use of NWP raises several important issues. In order for the prediction results from the NWP to be utilized in time, the computational process of the NWP should be performed within at least several tens of minutes, thus requiring enormous computation resources. In addition, in order for the high-resolution NWP to predict the initiation of precipitation, it is generally necessary to perform model integration for about three hours, and this is called the spin-up time. This is inherent because the high-resolution NWP are initialized with coarser-resolution analysis fields that cannot properly represent the physical processes at the convective scale (Sun et al., 2014). Therefore, meteorological agencies in many countries around the world have been using extrapolation-based precipitation nowcasting systems such as Thunderstorm Identification, Tracking, Analysis and Nowcasting (TITAN) (Dixon & Wiener, 1993), The Corridor Integrated Weather System (CIWS) (Evans & Ducot, 2006; Wolfson & Clark, 2006), and the McGill algorithm for precipitation nowcasting by Lagrangian extrapolation (MAPLE) (Bellon et al., 2010; Germann & Zawadzki, 2002, 2004; Turner et al., 2004), rather than NWP for very short-term precipitation forecasting.
The extrapolation-based precipitation nowcasting systems are known to provide better prediction results than NWPs in the early stage of forecasting (Sun et al., 2014). But the predictability of extrapolation-based precipitation nowcasting decreases sharply as forecast lead time increases, and is highly vulnerable to rapidly developing heavy precipitation systems due to simple physical assumptions such as linear growth or stationary storm motion. In this regard, several techniques recently proposed in the field of AI, especially DL networks that learn and predict temporal changes in spatial distribution, seem to have potential to supplement or replace traditional precipitation nowcasting systems (e.g., L. Han et al., 2020; Ravuri et al., 2021; Shi et al., 2015, 2017).
Accordingly, the Korea Institute of Science and Technology Information (KISTI) constructed a specially refined dataset called KISTI Dataset for Rainfall Prediction (KDRAP) to promote the development of a DL-based precipitation nowcasting and related advanced DL technique. This dataset contains multiple observational and regional NWP model data, and the data have been preprocessed to match their spatio-temporal specifications for fusion applications in the near future.
Section 2 presents the collection process of observational data for the development of DL-based precipitation nowcasting, and Section 3 describes the spatio-temporal pre-processing for the collected data and the regional NWP data production process for advanced applications. A conclusion is provided in Section 4.
2. DATA COLLECTION
To construct a dataset for the development and training of a DL-based precipitation nowcasting model, we established two basic conditions that the data to be collected must have as follows. First, the spatial domain of data should cover a wide enough area to express the development and evolution of precipitation systems over the Korean peninsula. Second, data should be collected for a period long enough for the DL-based precipitation nowcasting model to learn the complex development and evolution of precipitation systems over the Korean peninsula.
In consideration of the above conditions, composite radar reflectivity was selected as the main training data and the data collection period is 8 years, from 2012 to 2019. The data were provided by the Weather Radar Center of KMA. In the case of composite radar reflectivity data, the characteristics of the output differ depending on the composite method applied, and this is mainly due to the rule applied when converting the reflectivity observed in 3-dimensional space into a 2-dimensional distribution map.
At the time of data collection, the Hybrid Surface Rainfall (HSR), which corresponds to a state-of-the-art quantitative precipitation estimation (QPE) technique, was in the process of replacing the existing QPE technique, called Constant Altitude Plan Position Indicator (CAPPI). Accordingly, the production of CAPPI was stopped from 2019, and the available period of HSR was after 2016. HSR is based on a two-dimensional hybrid surface consisting of the lowest radar bins that are not affected by ground clutter, beam blocking, and non-weather echoes, and it is known to show improved rainfall estimates in comparison with CAPPI (Kwon et al., 2015). Strictly speaking, there is a difference in quality between CAPPI and HSR, but it is necessary to regard them as the same type of data. If CAPPI and HSR are used separately due to serious consideration of the quality difference between the two outputs, it becomes difficult to stably train a DL-based model using long-term data. Therefore, the two types of composite radar reflectivity data were used together for the entire period, and CAPPI and HSR cover the period from 2012 to 2015 and from 2016 to 2019, respectively.
MAPLE quantitative precipitation forecast (QPF) data were collected to be used as verification data. The collected MAPLE data provides initial and hourly forecast fields up to 6 hours every 10 minutes for a 1,024 km × 1,024 km area, including the Korean peninsula. MAPLE is being used as a major component of operational precipitation nowcasting over Korea, and the collected data are expected to provide a reliable standard for diagnosing the performance of DL-based precipitation nowcasting models. The data were obtained for June, July, and August 2017 from the Weather Radar Center of KMA.
Since radar reflectivity is a measure of the attenuation of waves caused by water droplets or ice crystals in the atmosphere, there may be some differences from the precipitation observed by ground-based measurements such as AWS and Automated Synoptic Observing System (ASOS). Accordingly, ground-based observation data from 708 stations installed on the Korean peninsula were also collected in consideration of data-driven precipitation correction in the near future. The collected ground-based observation data consists of AWS and ASOS, and the preprocessed variables are temperature, relative humidity, surface pressure, sea-level pressure, and precipitation. The data period is from 2012 to 2019, which is identical to that of composite radar reflectivity, and the data were collected via the Open MET Data Portal ( https://data.kma.go.kr).
In addition, in consideration of the possibility that AI technology will be applied in the future for correction of short-term forecast (not nowcasting) produced by NWP, numerical weather prediction data were also obtained by performing Weather Research and Forecasting (WRF) model 3.9.1.1 (Skamarock et al., 2008). The period of performing numerical prediction using WRF is June, July, and August from 2016 to 2018, and the detailed process will be introduced in Section 3.3.
3. DATA PREPROCESS
The data collected in this project include remote sensing data and point observation data. Each of these data represents the spatio-temporal characteristics of rainfall systems over the Korean peninsula, but they have different spatio-temporal specifications from each other (Table 1 and Fig. 1). On the other hand, for successful DL-based precipitation nowcasting, temporal changes of rainfall distribution must be properly learned by the DL-based model, and it is expected that the sequence-to-sequence model can effectively achieve that purpose. In order for the sequence-to-sequence model to properly learn the spatio-temporal characteristics appearing in different data, all data used for training need to be configured to have a uniform time step and the same spatial grid structure. Since such preprocessing generally needs to be performed on all collected data at once, the task is large and formidable to re-execute. Therefore, it is important to reduce the possibility of erroneous preprocessing execution by establishing a reasonable strategy based on the opinions of experts in the field.
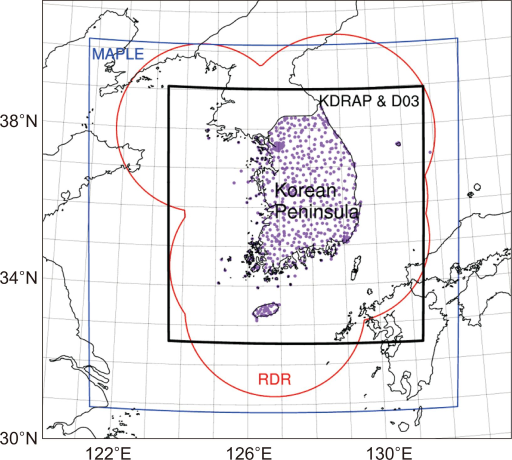
Fig. 1
Spatial domain for each raw data and preprocessed data. Red and blue solid lines indicate the domain of original composited radar reflectivity (RDR) and MAPLE data, respectively. Locations of AWS and ASOS are represented by small purple dots. The domain of preprocessed dataset coincident with D03 of WRF simulation is indicated by thick solid lines. MAPLE, McGill algorithm for precipitation nowcasting by Lagrangian extrapolation; AWS, automatic weather station; ASOS, Automated Synoptic Observing System; WRF, Weather Research and Forecasting.
3.1. Spatial Interpolation
The element of the spatial structure to be preprocessed in this dataset are grid size, number of grids in west-east and south-north directions, and map projection. The spatial grid structure of the dataset basically follows the spatial grid configuration of WRF, which will be described later. Its grid size is 1 km, and the number of grids in west-east and south-north directions is 708 × 708. As for map projection, Lambert conformal conic projection, in which reference latitude and longitude are 36°N and 126°E, respectively, and the standard parallels are 30°N and 60°N, was applied.
The number of grids in the west-east and south-north directions and grid sizes of CAPPI, HSR, and MAPLE were 1,153 × 1,441 (1 km), 2,305 × 2,881 (500 m), and 1,024 × 1,024 (1 km), respectively. Therefore, the spatial domain of the data is larger than that of WRF, and the resolutions are different from each other (Fig. 1). To deal with this spatial grid mismatch, the data outside the WRF simulation area was cropped, and in the case of HSR with twice the resolution of other data, values for the grid matching the WRF domain were selected without any special interpolation process.
In the case of the ground-based point observation (i.e., AWS and ASOS), it has a very unbalanced location distribution. Therefore, in order to utilize these data on the spatial grid structure of the other data, it is inevitable to perform spatial interpolation. Here, the natural neighbor interpolation method, which is similar to the inverse distance weighted average method, but known to be much more sophisticated, is used (Sibson, 1981).
Through the above process, all collected data have the same spatial grid structure, and most importantly, the spatial area of these data is large enough to learn the development and evolution of the precipitation system over the Korean peninsula.
3.2. Time Integration
The time step of the final dataset was set to one hour by comprehensively considering the time scale of the precipitation systems and the characteristics of DL models related to sequence prediction (Table 1). If the time step is too small, that is, if the number of frames for the specific prediction period is too large, there is a possibility that effective training by DL-based models may not be conducted in the later stage of sequence.
Table 1
Collection period and spatio-temporal specifications of original and preprocessed data
| Data type | Period | Horizontal grids | Spatial resolution | Temporal resolution | Size | |||||||
|---|---|---|---|---|---|---|---|---|---|---|---|---|
| Org. | Prep. | Org. | Prep. | Org. | Prep. | Prep. | ||||||
| Radar | CAPPI | 2012-2015 | 1,153 × 1,441 | 708 × 708 | 1 km | 1 km | 10 min | 1 hour | 300 GB | |||
| HSR | 2016-2019 | 2,305 × 2,881 | 500 m | 5 min | 308 GB | |||||||
| MAPLE | 2017 | 1,024 × 1,024 | 1 km | 10 min | 102 GB | |||||||
| AWS & ASOS | 2012-2019 | - | - | 1 min | 10 min | 1.4 TB | ||||||
| WRF | 2016-2018 | 708 × 708 | 1 km | 10 min | 10 min | 18 TB | ||||||
In this process, we need to consider the physical characteristics of the values observed through various observation equipment. In the case of composited radar reflectivity, the temporal resolutions of CAPPI and HSR are 10 and 5 minutes, respectively, and the unit of data is dBZ. This can be converted into rainrate by the empirical formula shown in Eq. (1).
Rainrate with a unit of mm h-1 represents the estimated rainfall for a given time period, so it has a different physical meaning from the accumulated precipitation obtained through ground observation or numerical simulation. In order to resolve such differences and use radar observations with high temporal resolutions of 10 or 5 minutes without omission, the composited radar rainrate was converted into hourly accumulated precipitation through time integration for every hour.
In numerical simulation data, precipitation in each original output file indicates precipitation continuously accumulated from the initial integration time, so the precipitation difference between the time and one hour before is considered as the accumulated precipitation of that time. In the case of the ground-based point observation and MAPLE, no additional processing is involved since 10-min or hourly accumulated precipitation is provided originally.
3.3. Construction of Auxiliary Dataset
NWP models reproduce and predict not only precipitation but also complex and diverse phenomena occurring in the atmosphere and ocean. NWP has been gradually improved in performance due to an increase in computational power and advances in the sciences. However, perfect prediction is impossible due to the atmospheric characteristics in which unpredictable error growth occurs even by very small perturbations and the impracticality of obtaining perfect initial atmospheric conditions (Lorenz, 1982). Given these two conflicting situations, some experts believe that the predictability of NWP is reaching the intrinsic predictability limit (see Hoffman et al., 2018). On the other hand, NWP data are generally available for a very long period of time since operational NWP began in the 1950s, and the data can be easily used because it is well structured in time and space. Therefore, it is worth trying to correct and improve the prediction results of NWP through data-driven approaches, and based on this, the data-driven method and numerical modeling can establish a complementary relationship. Recently, in consideration of this point, we have produced NWP data that can be used together with radar data, and the process and results will be introduced here.
Numerical simulation using WRF was performed in three domains with grid sizes of 9- (D01), 3- (D02), and 1-km (D03), respectively, on a 2-way nested grid system. The number of grids in the D01, D02, and D03 is 424 × 424, 601 × 601, and 709 × 709, respectively, and the vertical layers consist of 41 layers from the ground to 50 hPa with a terrain-following eta coordinate. In particular, the number of mass point for D03 is 708 × 708, which has the same map projection and grid structure as the previously introduced radar data. The main physics schemes applied to the simulation were WSM6 for microphysics (Hong & Lim, 2006), RRTMG for long- and short-wave radiation (Iacono et al., 2008), and YSU for planetary boundary layer (Hong et al., 2006). For cumulus parameterization, the Kain-Fritsch scheme was used (Kain, 2004), and it was applied only to D01.
The output of the numerical model contains many variables. These include not only physical variables, but also variables involved in various numerical processes. Simply using them all at once has the potential to cause a very large inefficiency in the training process of DL-based models. Therefore, in consideration of the efficiency of actual use and the purpose of improving rainfall prediction by the NWP, the principal variables related to the development of precipitation systems were selected, and they include pressure, sea-level pressure, wind, temperature, water vapor mixing ratio, and accumulated precipitation. In this process, 3-dimensional variables were interpolated to 1, 2, 3, 5, and 10 km altitudes (see Table 2).
Table 2
Variables provided by the constructed dataset
| Data type | Variables (unit) | Vertical levels | |
|---|---|---|---|
| Radar | 1-hour integrated rainrate (mm) | Ground | |
| MAPLE | Estimated rainrate (mm h-1) | Ground | |
| AWS & ASOS | 10-min accumulated rainfall (mm), sea-level pressure (hPa), surface pressure (hPa), temperature (°C), relative humidity (%) | Ground | |
| WRF | 2-D | 1-hour accumulated rainfall (mm), sea-level pressure (hPa), terrain height (m) | Ground |
| u-wind (m s-1), v-wind (m s-1) | 10 m | ||
| temperature (K), water vapor mixing ratio (kg kg-1) | 2 m | ||
| 3-D | pressure (hPa), u-wind (m s-1), v-wind (m s-1), w-wind (m s-1), temperature (K), water vapor mixing ratio (kg kg-1) | 1, 2, 3, 5, and 10 km | |
The simulation period is June, July, and August from 2016 to 2018, and a 3-day prediction was performed every day with 00 and 12 UTC as the initial time. Thus, a total of 554 simulations were performed on the KISTI supercomputer Nurion.
4. CONCLUSION
Through this project, the dataset required to develop, train, and verify a DL-based precipitation nowcasting model was established in a regularized form. The raw data used to construct this dataset were composited radar reflectivity (CAPPI and HSR), MAPLE QPF, AWS, and ASOS, which were collected via the Open MET Data Portal and the cooperation of the KMA. Numerical simulation data were produced by ourselves using the KISTI supercomputer Nurion.
The spatial domain of all collected data was set wide enough for DL-based models to learn the development of precipitation systems over the Korean peninsula, and the data preprocessing was performed to match the spatial structure between different data. The temporal resolution of the collected data was also configured to match each other based on comprehensive consideration of the life time of the precipitation systems and the characteristics of DL models related to sequence prediction. In the case of numerical simulation data, variables closely related to the development of the precipitation systems were selected, and 3-dimensional variables were vertically interpolated to five major altitudes. As a result, this dataset constructed using various raw data has an appropriate spatial range, grid size, and temporal resolution to develop DL-based precipitation nowcasting models, and all collected data have the same spatio-temporal specification.
Thus, by using this dataset, users can utilize various observational and numerical data for training and verification of DL-based models without any specific preprocessing required for each type of data. In addition, it is possible to efficiently try developing a new type of data-driven model that performs prediction or correction by using various variables together.
This dataset (i.e., KDRAP) is planned to be released in the near future through the KISTI AI Data Archive (AIDA, https://aida.kisti.re.kr), and we hope that it will contribute to the advancement of data-driven disaster response ability.
REFERENCES
, (2006) Corridor integrated weather system Lincoln Laboratory Journal, 16(1), 59-80 https://www.ll.mit.edu/r-d/publications/corridor-integrated-weather-system.
, (2006) The WRF single-moment 6-class microphysics scheme (WSM6) Journal of the Korean Meteorological Society, 42(2), 129-151 https://www.dbpia.co.kr/journal/articleDetail?nodeId=node00937254.
, , , , , (2015) Convolutional LSTM network: A machine learning approach for precipitation nowcasting Advances in Neural Information Processing Systems, 28, 802-810 https://proceedings.neurips.cc/paper/2015/hash/07563a3fe3bbe7e3ba84431ad9d055af-Abstract.html.
, , , , , , (2017) Deep learning for precipitation nowcasting: A benchmark and a new model Advances in Neural Information Processing Systems, 30, 5618-5628 https://proceedings.neurips.cc/paper/2017/hash/a6db4ed04f1621a119799fd3d7545d3d-Abstract.html.
, , , , , , , , (2020) MetNet: A neural weather model for precipitation forecasting ArXiv https://doi.org/10.48550/arXiv.2003.12140.
, (2006) Advanced aviation weather forecasts Lincoln Laboratory Journal, 16(1), 31-58 http://citeseerx.ist.psu.edu/viewdoc/download?doi=10.1.1.163.920&rep=rep1&type=pdf.