1. INTRODUCTION
The manufacturing industry accounts for 80% of exports and 30% of GDP in South Korea and has been the foundation for driving economic growth. Furthermore, manufacturing innovation has become an essential element in securing sustainable growth advantage and transitioning into a digital economy (Related Ministries Joint, 2020). In 2020, while the global economy recorded the worst growth rate (-3.3%) since the 2008 global financial crisis, South Korea succeeded in suppressing the slowdown in economic growth, with the manufacturing industry serving as a pillar of support (Hwang, 2021). The relatively faster stabilization of the economy can be attributed to the competitiveness of South Korea’s manufacturing industry, which is the third highest in the world (Correa & Todorov, 2021).
However, to promote digital transition—such as technologies related to the Fourth Industrial Revolution—as a source of core competitiveness, there is a need to address the lack of relevant responses and technological gaps faced by South Korea when compared to advanced countries. According to the United Nations Industrial Development Organization (UNIDO), the overall ranking of manufacturing competitiveness of South Korea is the third highest in the world; however, it ranks ninth based on the share of the medium-and high-tech companies in manufacturing exports (Correa & Todorov, 2021). Furthermore, according to a recent report, eight out of the top 15 global manufacturing companies based on core technologies of the Fourth Industrial Revolution are in Asia, and five of them are in China, but none are in South Korea (World Economic Forum, 2021).
Digital technology-based innovation strategies need to be upgraded to enable transition into an industrial structure that is advantageous in the innovation competition triggered by COVID-19, beyond a structure robust to crises. From the same perspective, major developed countries are expanding their efforts at the national level by establishing various strategies and policies and increasing related investments to lead and adapt to manufacturing innovation as a part of the Fourth Industrial Revolution. For example, Germany, a traditional manufacturing powerhouse, has a policy of deploying new production structures through “Industrie 4.0” projects to maintain the existing hegemony in the manufacturing sector (Lee & Ko, 2018). In Industrie 4.0, “manufacturing innovation” is seen as the most noticeable innovation of the Fourth Industrial Revolution (Kagermann et al., 2013). In the United Kingdom, the Next Manufacturing Revolution (NMR), which focuses on information and communication technology (ICT)-based manufacturing productivity, is underway (Lavery et al., 2013). Moreover, the OECD has launched a project for Next Production Revolution (NPR) for new environments, in which the advancements in convergence and fusion of cutting-edge technologies will fundamentally change conventional production methods (OECD, 2016).
For successful global efforts on promoting innovation in the manufacturing sector, it is first required to shorten the product development period and reduce costs through changes in production processes; the core element involves product design. Simulation refers to the activity of virtualizing the product design phase without physical product manufacturing and experiments. If supercomputing-based simulations are used, the time and costs required in new product development can be dramatically reduced. It is promising as the degree of linkage with the manufacturing industry and value-added inducement are high (Kim et al., 2016). The global simulation-related software market recorded output worth 9.9 trillion won in 2019 and is expected to grow at a relatively fast rate of 17.1% up to 2027 (Bizwit Research & Consulting, 2021).
This study analyzes the economic ripple effect of supercomputing-based simulations. We identify the domestic industrial sector dealing with the simulation industry, based on the input-output table provided by the Bank of Korea. Furthermore, we analyze the ripple effects of supercomputing-based simulations by dividing them into the production inducement effect, value-added inducement effect, employment inducement effect, and forward/backward linkage effect based on the input-output model of the Bank of Korea.
This study is organized as follows. Section 2 provides an overview of supercomputing-based simulations. Section 3 reviews the policies of South Korea and other countries related to simulation to support the manufacturing industry, and examines their utilization status. Section 4 explains the economic ripple effect analysis method, and describes the economic ripple effects of simulation based on it. Finally, in the conclusion we present discussion and implications of the study in accordance with the findings.
2. DEFINITION OF SIMULATION
Discussion on simulation technology began in all seriousness in the late 1980s as it was used to avoid risks and reduce costs and time in the national defense sector. The United States Department of Defense (DoD) defined simulation technology including modeling as “the activity of creating models that represent systems, objects, phenomena, or processes of interest through physical, mathematical, and logical methods and analyzing them statically and dynamically” (DoD Instruction, 2009). The Ministry of National Defense (MND) of the Republic of Korea defined simulation as a method of representing the result of model changes over time identically or similarly to the physical, mathematical, and logical representation process of a system, object, phenomenon, or procedure (Ministry of National Defense, 2014). As the industrial use and contribution of simulation technology has increased beyond the national defense sector, various studies have mentioned relevant concepts emphasizing its importance. In this context, the U.S. National Science Foundation (NSF) emphasized simulation from an engineering perspective for the efficiency of national research and development (R&D), and defined it as predicting a physical event or response using computational and scientific methods (National Science Foundation, 2006).
As the aforementioned definitions of modeling and simulation (M&S) show, M&S is closely related to the development of various computer science fields because it is a technology used primarily in digital environments and has the multidisciplinary characteristic of permeating diverse science disciplines, including “arithmetic” (Diallo et al., 2015; Kim et al., 2017; Zeigler et al., 2000). M&S encompasses not only engineering and science but also various other avenues of research, including social sciences, business, medicine, and education. It can be applied to any field in which dynamic models can be used for experiments (Kim et al., 2017; Sokolowski & Banks, 2008).
Engineering M&S technology combined with manufacturing can help make optimal decisions by creating prototypes in digital spaces—instead of physical models in the real world—and predicting their performances (Kim et al., 2017). In other words, simulation is a smart manufacturing technology that transforms the conventional method of developing products through trial and error by relying on experiences into a data-based scientific product development method. In short, it analyzes the product’s performance and characteristics by conducting experiments (simulations) in a virtual environment without physical experiments. Simulation-based product development is a technology that is fundamental to the revival of the national economy through not only the dramatic reduction of costs and time but also the creation of high-quality jobs (Kim et al., 2016).
3. SIMULATION-RELATED POLICIES AND UTILIZATION STATUS
3.1. Simulation-related Policies in South Korea and Other Countries
Major countries are implementing various policies to realize manufacturing innovation powerhouses and improve national competitiveness through the digital transformation of manufacturing. They also try to respond quickly to environmental changes such as the expansion of non-face-to-face markets triggered by COVID-19. The United States has presented five strategic goals, including supercomputing-based simulations, in the “National Strategic Computing Initiative Strategic Plan (2016)” and has been ceaselessly implementing policies for smart manufacturing since then. A noteworthy example is the inclusion of M&S in the five strategic objectives in the “Strategy for American Leadership in Advanced Manufacturing (2018.10).” In particular, since 2015 the Department of Energy, Advanced Manufacturing Office, and national research institutes have been cooperating on High Performance Computing for Manufacturing (HPC4Mfg), a project to support manufacturing simulations using supercomputing, and are strengthening efforts to promote the use of simulation technology, including injecting a financial resource of $3.75 million into ten projects in 2021. Germany has emphasized technical sectors such as supercomputing, and digital design and simulation, to realize the digital innovation of manufacturing through Industrie 4.0 and “Plattform Industrie 4.0” policies at the pan-ministerial level. Furthermore, they are actively supporting simulation-oriented R&D through “AUTONOMIK 4.0 (simulation-based systems for small and medium-sized enterprises)” in connection with “Mittelstand 4.0” to encourage digital innovation in small and medium-sized companies. As of 2020, 26 regional competence centers and four agencies have been established and are under operation as R&D support programs for the proliferation of simulation-based manufacturing systems. The UK is expanding investment in simulation technology through government policies such as “High Value Manufacturing” and “Industrial Strategy Challenge Fund” for the digital transformation of manufacturing. China has also selected smart design and simulation technology development as one of the ten major projects in “Made in China 2025.”
In South Korea, government policies and investments for the digital transformation of manufacturing have been continuously strengthened, from the “Manufacturing Innovation 3.0” strategy, which aimed at the proliferation of smart factories in 2014, to the recent “Manufacturing Renaissance Vision and Strategy (2019)” and “Comprehensive Plan for Korean New Deal (2020).” However, it was the “Digital New Deal” in the 2020 comprehensive plan for a new deal that made people begin to directly mention the importance of supercomputing and simulation, and development of relevant technologies. Thus, manufacturing innovation through digitalization is fast becoming an essential element in securing national competitiveness and the importance of analysis-based strategy establishment is reiterated.
3.2. Simulation-related Technology Development Status
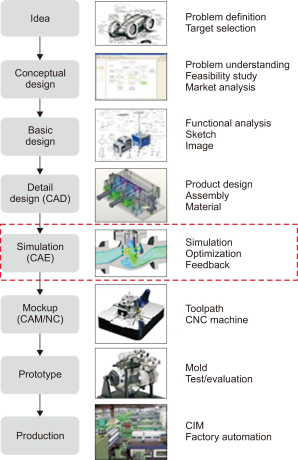
The demand for simulation-based manufacturing digitalization is on the rise because of the prolonged social distancing due to COVID-19 and the radical development of ICT, such as XR (eXtended Reality). Global companies recognize the use of simulation as a core technology that facilitates fast response to the market by dramatically reducing the time and costs required for new product development and improved productivity. The use of simulation is increasing not only in the design process but also across the whole product development process. Furthermore, its scale is expanding, and the field of complex simulation execution using supercomputing resources is gaining importance. In particular, as shown in Fig. 1, it corresponds mainly to the simulation (Computer Aided Engineering, CAE) part through product design (Computer Aided Design, CAD) in the product development processes of manufacturing companies. The key to simulation is the software that supports a series of processes such as preprocessing, analysis, and post-processing (Kim et al., 2016).
Fig. 1
Simulation positioning in production process. CAD, Computer Aided Design; CAE, Computer Aided Engineering; CAM, Computer Aided Manufacturing; NC, Numerical Control; CNC, Computer Numerical Control; CIM, Computer Integrated Manufacturing.
The application to the industry through simulation technology development enables the optimization of products and processes, which contributes greatly to the improvement of productivity, such as defect rate reduction, shortening of development period, and cost reduction. The Korea Institute of Science and Technology Information (KISTI) has supported 626 manufacturing companies since 2007 with simulation technology, and as of 2021, the product development time is reduced by 61.88% and cost by 73.94% (KISTI, 2021).
In recent years, the Reduced Order Model (ROM) has emerged. Based on advancements in supercomputing and simulation technologies, ROM enables increasingly stable and innovative designs by executing complex simulations in the design space and generating a large-scale optimization plan. ROM simplifies high-fidelity models and maintains essential behaviors by using a complex mathematical algorithm. More detailed models can be created, and sophisticated simulations can be performed if supercomputing resources and ROM are used together (Scientific Computing World, 2019). Siemens, a global company in the US, and Ansys in Germany are leading the simulation software market, including ROM. Although the ROM technology development activity in South Korean companies is insignificant, KISTI has recently developed a pilot program of ROM to assure quality. As the advantages of using simulation technology in the industry become visible and the sectors show expansion, efforts are made to develop relevant technologies.
4. ANALYSIS OF ECONOMIC RIPPLE EFFECT
4.1. Significance and Structure of Input-Output Analysis
In a national economy, each industry enters into a relationship with the other directly or indirectly through the process of purchasing and selling goods and services for production activities. Input-output tables are statistical tables that record these trading relationships among industries for a certain period (usually one year) in the form of a matrix, following a certain principle, as shown in Table 1. In Table 1, the total input is the sum of intermediate inputs and value-added, and the total output is the sum of intermediate demand and final demand, minus imports. The total input refers to the total output. The vertical direction explains the input structure, which consists of production costs incurred by each industrial sector. The horizontal direction refers to the allocation structure, which shows how much of each industrial sector’s products have been sold to fulfill intermediate or final demands.
Table 1
Basic structure of input-output tables
| Domestic | Intermediate demand | Final demand |
Imports | Total output |
||||||
|---|---|---|---|---|---|---|---|---|---|---|
| 1 | 2 | ․ | ․ | ․ | n | |||||
| I n p u t |
1 | x11 | x12 | ․ | ․ | ․ | x1n | Y1 | M1 | X1 |
| 2 | x21 | x22 | ․ | ․ | ․ | x2n | Y2 | M2 | X2 | |
| ․ | ․ | ․ | ․ | ․ | ․ | ․ | ․ | ․ | ․ | |
| ․ | ․ | ․ | ․ | ․ | ․ | ․ | ․ | |||
| ․ | ․ | ․ | ․ | ․ | ․ | ․ | ․ | ․ | ․ | |
| n | xn1 | xn2 | ․ | ․ | ․ | xnn | Yn | Mn | Xn | |
| Value added |
V1 | V2 | ․ | ․ | ․ | Vn | Imports | |||
| Output | X1 | X2 | ․ | ․ | ․ | Xn | ||||
Input-output analysis is a method of quantitatively analyzing the relationship among industries based on the input-output tables. Input-output analysis is used to establish economic policies and measure policy effects because various ripple effects such as the production, employment, and income induced by the final demand can be analyzed by classifying them for each industry. To estimate the ripple effects such as production, value-added, and employment inducement of supercomputing-based simulations, we use the 2019 input-output tables (extended tables) released by the Bank of Korea on June 21, 2021 and calculate various coefficients and decipher the inducement effects (Bank of Korea, 2021).
4.2. Calculation of Various Coefficients
The coefficient calculated by dividing the intermediate input—such as raw materials purchased by each industrial sector from others for use in the production of goods and services—by the total input is the input coefficient. A matrix that arranges input coefficients in the same manner as the endogenous sectors of the input-output table is described as an input coefficient table. As the production effects induced by imported goods or services must be excluded to calculate the economic ripple effect of supercomputing-based simulations, the domestic input coefficient excluding the import transaction amount is the same as Eq. (1).
Domestic input coefficient between industries i and j -- Eq. (1)
◦ Xij: intermediate input between industries i and j, Mi: imports, Xj: total input
The production inducement coefficient is calculated by using Eq. (2) after converting the sectors corresponding to the integrated sub-categories into exogenous variables by using Eq. (1).
Production inducement coefficient= -- Eq. (2)
◦ : Domestic input coefficient row vector of supercomputing-based M&S
◦ I: diagonal matrix composed of 1
◦ Ad: matrix of domestic input coefficients (aij)
The value-added coefficient shows the proportion of value-added in total output, and it is obtained by dividing the sum of value-added of each industry by total output in the input-output table, as shown in Eq. (3).
Value-added coefficient of industry i -- Eq. (3)
◦ Vi: sum of value-added, Xi: total input
The labor coefficient is calculated by dividing the amount of labor put into production activity for a certain period by total input, and it refers to the amount of labor required directly for the production of one unit. It is classified into the employment coefficient and hiring coefficient depending on whether self-employed owners and unpaid family workers are included in the amount of labor.
Employment coefficient , hiring coefficient ---- Eq. (4)
◦ Lw: number of employees, Le: number of employees, X: total output
The labor inducement coefficient includes not only the amount of labor required directly for the production of one unit of product in a certain industry but also the amount of labor required indirectly in the production ripple process. It is represented by Eq. (5), and in this study, the employment inducement coefficient is used to analyze the employment inducement effect.
Employment inducement coefficient
Hiring inducement coefficient = ---Eq. (5)
◦ : diagonal matrix of labor coefficients, I: unit matrix, Ad: domestic input coefficient matrix
The “degree of sensitivity” coefficient is calculated as a ratio for the industrial average of the unit that the ith industry must produce to increase the final demands of all sectors by one unit each. The coefficient of influence refers to the ratio of the production inducement coefficient of each sector to the average production inducement coefficient of all industries.
4.3. Analysis of Economic Ripple Effects
Input-output analysis is used to analyze economic ripple effects in various disciplines such as social sciences, engineering, and natural sciences (Hong et al., 2010; Jee et al., 2011; Park, 2018; Park & Hahn, 2011). Based on the fact that the flow of goods and services among economic sectors is relatively stable, the input-output analysis examines the economic system statistically in more detail, thus explaining economic phenomena. In particular, input-output analysis is widely used in fields related to economic policy establishments and effect analysis of a country, which means that it can be used to ascertain the economic ripple effects of domestic simulations.
First of all, we apply supercomputing-based simulations to the “Information Service,” “Software Development and Distribution,” “Research and Development,” “Other Scientific and Technical Services,” and “Other Business Support Services,” as shown in Table 2, to apply the input-output analysis. The result is derived as the output element of supercomputing-based simulations through the input element of the government R&D budgets.
Table 2
Classification of simulation in input-output tables
| Sub-category (165) |
|---|
| 610. Information Service |
| 621. S/W Development and Distribution |
| 700. Research and Development |
| 729. Other Scientific and Technical Services |
| 749. Other Business Support Services |
In this study, the production inducement coefficient, value-added inducement coefficient, and employment inducement coefficient are calculated through Eq. (1)-(5), as summarized in Table 3. Each inducement coefficient explains the inducement effect that occurs directly/indirectly in all the industries when the final demand for supercomputing-based simulations increases by one unit.
Table 3
Inducement coefficients (I.C.) for supercomputing simulation
| Sub-category (165) | Production I.C. | Value added I.C. | Coefficient of influence |
Degree of sensitivity |
|---|---|---|---|---|
| 610. Information Service | 1.694 | 0.826 | 0.877 | 0.855 |
| 621. S/W Development and Distribution | 1.302 | 0.907 | 0.674 | 0.729 |
| 700. Research and Development | 1.640 | 0.878 | 0.849 | 0.521 |
| 729. Other Scientific and Technical Services | 1.567 | 0.907 | 0.811 | 1.712 |
| 749. Other Business Support Services | 1.507 | 0.920 | 0.780 | 1.509 |
| Average Inducement Coefficients | 1.54 | 0.89 | 0.80 | 1.07 |
Assuming that “Information Service,” “Software Development and Distribution,” “Research and Development,” “Other Scientific and Technical Services,” and “Other Business Support Services,” which belong to the integrated sub-category in Table 3, affect the supercomputing-based simulation equally, the production inducement coefficient is 1.54 and the value-added inducement coefficient is 0.89.
In the national economy, the outputs from a particular industry group are used by other industries, and production activities are carried out as ripple effects in a value chain. In the value chain of our analysis, the effect of supercomputing-based simulations on the industries in front is called the forward linkage effect, and the effect on the industries on the rear side of the value chain is called the backward linkage effect. Here, the degree of sensitivity is 1.07, and the coefficient of influence is 0.80. Since the degree of sensitivity is greater than 1, there is a forward linkage effect. As the coefficient of influence is smaller than 1, it is interpreted that the backward linkage effect is small.
However, for each one of the five variables belonging to the integrated sub-category, we summarize the weight through the focus group interviews targeting ten experts from the industry, universities, and research institutes. The ten experts are three university professors (Hanbat National University, Gyeongsang National University, Chonnam National University), five people from government-funded research institutes (KIST, KRICT, KIMM, DISTEP, NAFI), and two persons from companies (INNOPLUS Company, Beyond Lab). The weight of each variable corresponding to the integrated sub-category is derived from the experts. The results show that the variables of “Information Service,” “Software Development and Distribution,” “Research and Development,” “Other Scientific and Technical Services,” and “Other Business Support Services” have effects with weights of 3:1:3:2:1, respectively. We then obtained the adjusted coefficient values reflecting them, as shown in Table 4.
Table 4
Adjusted inducement coefficients (I.C.) of supercomputing simulationa)
| Sub-category (165) | Production I.C. | Value added I.C. | Coefficient of influence |
Degree of sensitivity |
|---|---|---|---|---|
| 610. Information Service | 5.082 | 2.478 | 2.631 | 2.565 |
| 621. S/W Development and Distribution | 1.302 | 0.907 | 0.674 | 0.729 |
| 700. Research and Development | 4.92 | 2.634 | 2.547 | 1.563 |
| 729. Other Scientific and Technical Services | 3.134 | 1.814 | 1.622 | 3.424 |
| 749. Other Business Support Services | 1.507 | 0.92 | 0.78 | 1.509 |
| Adjusted Inducement Coefficients | 1.59 | 0.86 | 0.83 | 0.98 |
An examination of the inducement coefficient values adjusted by reflecting the experts’ opinions revealed that values of the production inducement coefficient and coefficient of influence are larger than the average coefficient values, and the value-added inducement coefficient and degree of sensitivity are smaller, thus showing that the results vary. Furthermore, when the employment inducement coefficients are calculated through the values of “Information Service,” “Software Development and Distribution,” “Research and Development,” “Other Scientific and Technical Services,” and “Other Business Support Services,” as in the coefficients given above, the results are as shown in Table 5. However, the average coefficient value—the evenly assumed coefficient value—indicates an inducement effect of 10.2934 persons per billion won, and the adjusted coefficient value is a value calculated reflecting the expert opinions and demonstrates an inducement effect of 9.9893 persons per billion won.
Table 5
Employment inducement coefficients (I.C.) of supercomputing simulationa) (person per billion won)
| Sub-category (165) | Employment I.C. |
|---|---|
| 610. Information Service | 7.525 |
| 621. S/W Development and Distribution | 8.699 |
| 700. Research and Development | 10.110 |
| 729. Other Scientific and Technical Services | 13.156 |
| 749. Other Business Support Services | 11.977 |
| Average Inducement Coefficients | 10.2934 |
| Adjusted Inducement Coefficients | 9.9893 |
To calculate the economic ripple effect of supercomputing-based simulations, we must determine which input variable is the most important factor. Therefore, the national R&D budget of the government is used as an input variable to calculate the economic ripple effect of supercomputing-based simulations. A total of 28.3 billion won is injected into the supercomputing-based simulations from 2007 to 2020; detailed information related to the budget is shown in Table 6.
Table 6
Annual budget of KISTI (millions of won)
| Year | Supercomputing simulation |
|---|---|
| 2007 | 1,236 |
| 2008 | 1,132 |
| 2009 | 1,195 |
| 2010 | 940 |
| 2011 | 1,464 |
| 2012 | 2,537 |
| 2013 | 2,198 |
| 2014 | 1,875 |
| 2015 | 1,301 |
| 2016 | 3,743 |
| 2017 | 3,797 |
| 2018 | 2,971 |
| 2019 | 2,381 |
| 2020 | 1,531 |
| Total | 28,301 |
To calculate the economic ripple effects based on the inducement coefficients of supercomputing-based simulations obtained in Tables 3, 4, and 5, we first estimate the production inducement effect by multiplying the production inducement coefficient calculated through the input-output table of supercomputing-based simulations. The value-added inducement effect is the net value of the national economy, which can be obtained through supercomputing-based simulations, and the portion attributed to the value-added in the production inducement effect can be estimated through the value-added inducement coefficient. The employment inducement effect can be assessed from the perspective that an increase in the related market of supercomputing-based simulations leads to a rise in employment, and it can be calculated by multiplying the employment inducement coefficient.
The fact that merely the input-output table of the Bank of Korea was used for the economic ripple effects of supercomputing-based simulations for budget input for a total of 14 years from 2007 to 2020 is a factor that needs to be improved in follow-up research. Nevertheless, this analysis is significant in that there has been no study or report that analyzes the economic ripple effects of supercomputing-based simulations for the past 14 years, and we have done it for the first time. Furthermore, our analysis is differentiated from other studies as we used the inducement coefficients adjusted by reflecting the opinions of ten experts from the industry, universities, and research institutes.
Table 7 describes the economic ripple effects induced by supercomputing-based simulations over the past 14 years.
Table 7
Economic ripple effect of supercomputing simulation (millions of won/person per billion won)
| Category | Production inducement effect | Value added inducement effect | Employment inducement effect |
|---|---|---|---|
| Average inducement effect | 43,640 | 25,120 | 291 |
| Adjusted inducement effect | 45,126 | 24,772 | 282 |
Assuming that the coefficients of the variables of supercomputing-based simulations are equal, the analysis results show that the total production inducement effect of supercomputing-based simulations over the last 14 years is 43.6 billion won, the value-added inducement effect is 25.1 billion won, and the employment inducement effect is 291 persons per billion won.
The inducement effects based on the coefficients adjusted by reflecting the opinions of the experts are as follows: The total production inducement effect of supercomputing-based simulations over the past 14 years is 45.1 billion won, the value-added inducement effect is 24.8 billion won, and the employment inducement effect is 282 persons per billion won.
5. CONCLUSIONS
This study used the input-output analysis of the Bank of Korea to analyze the economic ripple effects of supercomputing-based simulations performed over the past 14 years by KISTI. It calculated the inducement coefficients in five sectors—including Information Service, Software Development and Distribution, Research and Development, Other Scientific and Technical Services, and Other Business Support Services —in the integrated sub-category of the input-output tables. Each inducement coefficient was adjusted by applying the weight based on the opinions of ten experts from the industry, universities, and research institutes. According to the analysis results, in the case of “Information Services,” the production inducement coefficient is 5.082, the value-added inducement coefficient is 2.478, and the employment inducement coefficient is 7.525 persons. In the case of “Software Development and Distribution,” the production inducement coefficient is 1.302, the value-added inducement coefficient is 0.907, and the employment inducement coefficient is 8.699 persons. In the case of “Research and Development,” the production inducement coefficient is 4.920, the value-added inducement coefficient is 2.634, and the employment inducement coefficient is 10.110 persons. In the case of “Other Scientific and Technical Services,” the production inducement coefficient is 3.134, the value-added inducement coefficient is 1.814, and the employment inducement coefficient is 13.156 persons. Finally, in the case of “Other Business Support Services,” the production inducement coefficient is 1.507, the value-added inducement coefficient is 0.920, and the employment inducement coefficient is 11.977 persons. Based on these inducement coefficients and the budget (input variable, approximately 28.3 billion won) injected into supercomputing-based simulations over the past 14 years, we calculated the economic ripple effects. The analysis results show that the economic ripple effects of supercomputing-based simulations are as follows: the production inducement effect over the past 14 years is 45.1 billion won, the value-added inducement effect is 24.7 billion won, and the employment inducement effect is 282 persons per billion won.
This study is significant in that it derived the effects of the inputs by analyzing the economic ripple effects of the projects of KISTI, which have been supporting South Korean manufacturing companies for the past 14 years with supercomputing-based simulations. Furthermore, unlike previous studies, we calculated adjusted results by applying the weights derived through the FGI targeting industry/academic/research experts and derived accurate and meaningful results.
Nevertheless, there is a concern that the analysis results based on the input-output tables used in this study may be underestimated because direct effects, such as R&D investments in supercomputing-based simulations, could not be taken into consideration. Furthermore, there is a difficulty in making a definite assessment because the effects may be overestimated, in that this is a static analysis that cannot factor in price changes. Moreover, despite that the input-output tables are composed and released every five years, the analysis was conducted for the projects in the past 14 years using only the recently released input-output tables; this aspect needs to be improved in the future.
REFERENCES
(2021) Korea's manufacturing competitiveness, the pillar of the COVID-19 economic crisis i-KIET Industrial and Economic Issues, 108, 1-12 https://www.kiet.re.kr/research/issueView?issue_no=746.
, , , , (2017) An analysis and industrial classification of modeling and simulation service industry Journal of the Korea Academia-Industrial Cooperation Society, 18(3), 185-198 https://doi.org/10.5762/KAIS.2017.18.3.185.
KISTI (2021) Development of supercomputing applied technologies to solve engineering issues in the industrial and public sectors https://www.ntis.go.kr/project/pjtInfo.do?pjtId=1711149493&pageCode=TH_PJT_PJT_DTL
, (2018) Exploring the key technologies on next production innovation Journal of the Korea Convergence Society, 9(9), 199-207 https://doi.org/10.15207/JKCS.2018.9.9.199.
Ministry of National Defense (2014) Defense interoperability management directive https://www.korea.kr/archive/expDocView.do?docId=36947
(2018) An economic ripple effect analysis of National Science & Technology Information Service: Focusing an input-output analysis Journal of Korea Technology Innovation Society, 21(4), 1296-1312 https://www.koreascience.or.kr/article/JAKO201819867049447.page.
Scientific Computing World (2019) Advancing the industrial internet with simulation-based digital twins https://www.scientific-computing.com/analysis-opinion/advancing-industrial-internet-simulation-based-digital-twins