1. INTRODUCTION
Traditional universities have a hierarchical structure organized into distinct departments or fields of study. While this structure excels at cultivating experts in a specific field, it faces a notable limitation in cultivating individuals with comprehensive mastery across multiple fields. Despite the rise of multidisciplinary studies in academia (Moody, 2004; Van Noorden, 2015), undergraduate education, which serves as the foundation for future scholars and practitioners, appears to be struggling to keep pace with this trend. At the same time, universities are also required to meet an industrial demand to foster students who are well exposed to multidisciplinary experiences that will eventually enable them to transcend their disciplinary boundaries and understand the interdisciplinary nature of modern challenges (Feng et al., 2023). The fundamental challenge lies in the fact that existing academic divisions, with their emphasis on disciplinary separation, are deeply ingrained in universities (Guthrie, 2003; Nissani, 1997). To prepare students effectively for the complexities of modern problems, it has become significant to break down these barriers and promote interdisciplinary education.
The traditional method of delivering subject information is centered on academic majors, which is common in existing course handbooks. Document/table-based course handbooks, however, do not convey information about the relationship between courses across different majors. Students seeking information on courses in multiple disciplines often resort to searches based on trial and error and/or information gathering by word of mouth among seniors and juniors. There are numerous reports of undergraduate students failing to integrate the relevant knowledge across various fields of study (Del Rossi & Hersch, 2008). In addition, it is difficult for students to grasp the structure of courses within the curriculum at a glance. Without the understanding of the dependencies between classes, it is difficult for students to establish long-term course plans.
2. SCOPE OF THE PAPER
In this paper, we aim to provide a macroscopic perspective to undergraduate students by structuring and further schematizing the entire curriculum provided by the university. We have collected the syllabus database of Yonsei University and analyzed it using text mining and network analysis techniques. Using the results of the analysis, various information such as similarity between courses and dependency structure, which could not be grasped in the existing course handbook, can be delivered. Analysis information is implemented and provided in the form of network visualization.
We have also developed a graphical user interface that supports students who wish to fuse knowledge from various disciplines. This network-based visualized course navigation system is capable of a search that goes beyond the boundaries of existing majors, thereby solving the difficulties of information retrieval experienced by students interested in multiple academic fields, and helping students design a non-linear curriculum that is suitable for them.
Our study makes two contributions. First, we present concrete and detailed examples of structural analysis and visualization of undergraduate courses. Our data-driven approach, using text mining and network theory, is easily implementable as long as reliable syllabus datasets are available. Second, we propose a visualized course navigation system that is different from existing methods such as course handbooks or recommendation systems. Instead of simply listing courses, the graphical user interface allows students to navigate the entire academic space and understand the relationships between courses in detail. Our approach is expected to provide students with insight into possible connections between courses that may not otherwise be readily apparent.
3. RELATED WORKS
Recently, network analysis and text mining have been used in various fields (Lee, 2020; Newman, 2001a; Newman, 2001b; Nishavathi & Jeyshankar, 2020). Starting from Newman (2001a; 2001b)’s work on co-authorship networks, different types of networks, such as affiliation networks, co-authorship networks, and keyword networks, have been constructed and analyzed. Some other studies have examined patent networks to investigate the relationship between network characteristics and the value of patents, as well as scientific collaborations among researchers from different disciplines (Choi & Hwang, 2014; Kim et al., 2007; Lee, 2020; Nishavathi & Jeyshankar, 2020).
These studies have revealed the value of the interconnection and convergence of knowledge. Given the importance of collaboration and convergence, it has become important to study the structural nature of the knowledge provided by educational institutions. In particular, it is essential to inform students about the knowledge structures of their institutions in order to give them a comprehensive understanding of the learning opportunities available to them.
Traditional approaches to addressing this issue, such as curriculum mapping, often rely on time-consuming processes such as faculty interviews and one-on-one discussions (Uchiyama & Radin, 2009). These studies, which focus on specific domains such as medical education and computer science, lack a holistic perspective consistent with the purpose of this study in that they do not support students pursuing interdisciplinary academic goals of their own design (Holycross, 2006; Sekiya et al., 2010; Willett, 2008).
Other approaches to curriculum analysis in higher education include algorithmic methods such as text-mining (MacGregor & Salaz, 2021; Jeffery et al., 2017), latent Dirichlet allocation (LDA) (Sekiya et al., 2010), and collaborative filtering (Parameswaran et al., 2010). While these approaches have provided valuable insights, they have limitations. Text-mining based studies (Jeffery et al., 2017; MacGregor & Salaz, 2021) have analyzed syllabus data using text-mining software such as QDA Miner. Although these studies have uncovered potential research opportunities for library liaisons and faculty expectations of students, network visualizations remain rough and lack course-level information for students.
LDA-based visualization (Sekiya et al., 2010) is effective in displaying course clusters in a two-dimensional space and finding topics covered by them, but fails to illustrate intrinsic relationships between sparse and dense clusters of different majors. This is because their dataset is limited to a narrow range of majors. Collaborative filtering-based recommendation systems (Parameswaran et al., 2010) focus on the direct relationships between courses and users, and overlook the potential for exploring non-traditional learning paths and course combinations. Despite the existence of significant cumulative data in most universities, only a few studies have attempted to analyze syllabus databases (Sekiya et al., 2010), and the results have been actively put to practical use for educational purposes.
4. OUR APPROACH: DATASET, PREPROCESSING, AND NETWORK CONSTRUCTION
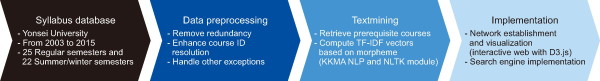
In this section, we explain the four steps of our approach that are depicted in Fig. 1.

Data processing and network building process. TF-IDF, term frequency-inverse document frequency; NLP, Natural Language Processing.
First, we have secured the syllabus database of Yonsei University, Korea. Syllabus databases are a reliable source of information outlining the key concepts covered in each course. Our syllabus dataset consists of undergraduate courses offered at Yonsei University from the spring semester of 2003 to the winter semester of 2015, inclusive.1 This period corresponds to 25 regular (spring and fall) semesters and 22 summer and winter semesters. Within this time period, the dataset contains 167 distinct major codes, 6,618 unique course IDs, and a total of 48,960 courses. Various attributes are extracted from the dataset, including course ID, major code, course title, instructor information, prerequisites, synopsis, weekly plan, and the semester in which the course was offered.
Next, we have pre-processed the syllabus data through data removal, separation, and data correction. Pre-processing is required to resolve the redundancy of course IDs, and to remove typos and vocabulary terms that contain relatively little information from text data. Two assumptions are made when preprocessing the syllabus data. First, we assume that the essence of the knowledge conveyed by courses with the same course ID is consistent across instructors, so we disregard information about instructors. Second, we assume that the core content of each course remains relatively stable, so we do not differentiate between the specific semesters in which each course is offered. These assumptions are valid, as our analysis focuses on undergraduate courses that are regularly offered and cover fundamental concepts within each major. After data pre-processing, 4,898 unique course entities are generated.
As a part of data pre-processing, we have also handled the following three exceptions within the dataset. We merge courses with different IDs but identical course titles and contents. For instance, the course “International Trade Theory” has two IDs: ECO2106 and ECO3131. Further investigation has revealed that the course was initially intended for sophomores but later became a recommended course for juniors. In this case, two courses are merged into one with a single ID. The opposite scenario is handled as well, where courses have the same course IDs but contents are clearly distinct. For example, “Junior Seminar: Computational Intelligence” and “Junior Seminar: Digital Astrophotography” share the same ID, EEE2001, because both are classified as seminar courses for junior students. To distinguish these courses with the same course ID but different contents from one another, new unique IDs, such as EEE2001a and EEE2001b, are assigned. Courses in medical science, nursing science, and music majors are excluded from our analysis due to limitations in data collection. Registration for courses in these academic majors is strictly controlled and is often only allowed for students majoring in the respective field. Detailed information about these courses is also limited within the system. Since one of our goals is to uncover potential opportunities for interdisciplinary learning, we have decided to proceed with the analysis without including these majors, as such opportunities are heavily regulated by university policies.
Thirdly, we have extracted prerequisite information and related information through text mining. Keywords for each course entity are extracted by applying two different natural language processing libraries: NLTK and KKMA (Aizawa, 2003; Bird, 2006; Lee et al., 2010). Then we measure the textual similarity values between courses using term frequency-inverse document frequency (TF-IDF) vectorization. Although the keyword sets belonging to unique IDs differ in their sizes due to various reasons such as the amount of details that instructors added to their syllabi, the TF-IDF vectorization method normalizes frequencies of words and weighs down the effect of terms which are too frequently used (Robertson, 2004). To define similarity between each pair of courses, we use angle distance between two TF-IDF vectors measured by cosine similarity (Aizawa, 2003; Huang, 2008). Even though each syllabus provides a limited amount of information, it is still a reliable summary of knowledge and contains key terminologies that are expected to be delivered by the corresponding course. Accordingly, the textual similarity can be used as a quantitative measure of the relationship between each pair of courses.
Finally, we have developed a network-based visualization and search interface. The network is created by treating courses as nodes and measuring edge weights using the textual similarities between pairs of syllabi (Park et al., 2018). The examples of network visualization and the search interface are shown in the following sections.
5. NETWORK ANALYSIS
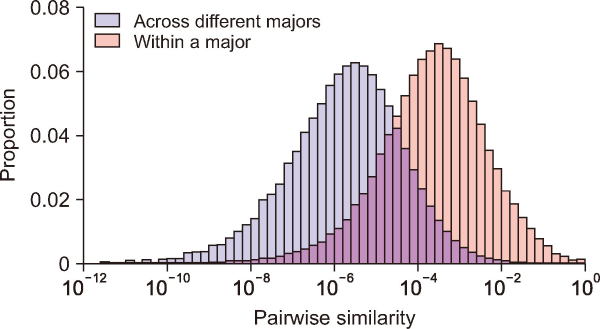
We investigate the following four aspects of the syllabus network of Yonsei University. First, we investigate the degree of separation between majors by analyzing the similarity values within each major and across different majors. The edge weights are classified into two groups: those within the same major (164,324 pairs) and those across different majors (5,240,199 pairs). In Fig. 2, the former group is colored red, with a mean similarity value of 0.0075 and a standard deviation of 0.0171. The latter group is shown in blue, with a mean similarity value of 0.0378 and a standard deviation of 0.0682. The two-sample t-test on these two groups shows a statistically significant difference between the mean values, with a p-value smaller than 0.0001. This result shows that there exists a certain level of segregation between different majors at Yonsei University.

Distributions of similarity values between course entities. The histogram in red shows the edge weights within a major, and the histogram in blue shows the edge weights across different majors.
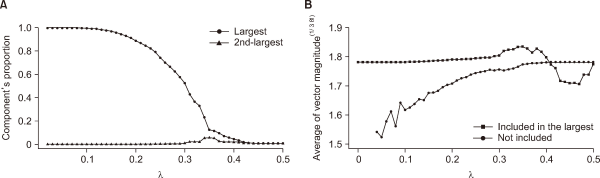
Second, we examine the properties of the largest component of the network. A threshold value λ is introduced to filter out insignificant links from the entire graph and reveal the underlying structure. Determining an appropriate threshold value is a delicate balance between the efficiency of link filtering and the preservation of potentially important connections. A range of values from 0 to 0.5 is tested to identify effective values of λ.
We monitor the sizes of the largest and second largest connected components to observe the effect of the threshold value on component sizes. Fig. 3A illustrates the change in the proportion of network components. The dominance of the largest connected component remains largely unchanged for λ values smaller than 0.3, albeit its size decreases for higher λ values. This result indicates that the knowledge taught at the undergraduate level at Yonsei University exhibits a high degree of interconnectedness, as expected. The network primarily consists of one large principal component, and its size remains robust within a certain range of λ values.

Average magnitudes of the course entities included and excluded in the largest connected component. (A) Proportions of the largest and the second largest components of the network under different threshold values of λ. (B) Average vector magnitudes of the course entities belong to the largest and the second largest components under different values of λ.
Thirdly, we compare the average magnitudes of the TF-IDF vectors for course entities included and excluded in the largest connected component. Vector magnitude suggests the amount of information that is included in the TF-IDF vector. Student t-tests on the two partitions of nodes across different values of λ are performed to verify the difference between the two mean values. We normalize the data and assess the normality of the transformed data using the Anderson-Darling test (p-value=0.0610). For λ values less than 0.4, we find that the difference between the two mean values is statistically significant at a significance level of 0.05. Fig. 3B shows that word sets corresponding to the nodes not included in the largest component generally have smaller magnitudes compared to those corresponding to courses included, for λ<0.4. The result indicates that the threshold value λ within a certain range effectively filters out less informative nodes from the main component.
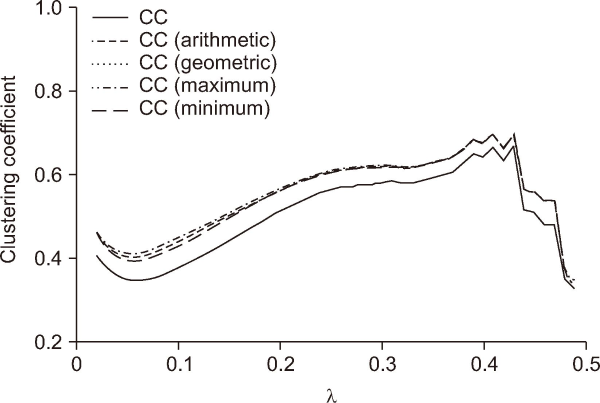
Finally, we investigate the trend of cliquishness as the threshold value λ increases. Cliquishness, also known as the clustering coefficient, measures the tendency of nodes in a graph to cluster together (Jackson, 2010). We compute the clustering coefficient of the weighted graph using five different approaches (Opsahl & Panzarasa, 2009). In Fig. 4, we observe that the clustering coefficient decreases when λ is between 0 and 0.05, and then increases gradually between 0.05 and 0.35. Because the dominant component gets smaller for λ values greater than 0.35, as shown in Fig. 3A, we exclude clustering coefficients beyond that range. The increase in the clustering coefficient indicates that λ in the range between 0.05 and 0.3 filters out peripheral structures or open triads while mostly preserving the core structures or triangles.

Five different types of clustering coefficients (CC) under different threshold values of λ.
6. VISUALIZATION & USER INTERFACE
In this section, we present a graphical user interface for course navigation. To effectively visualize the relationship between streams, we utilize force-directed graph visualization (Fruchterman & Reingold, 1991), a variant of the Spring-Embedder network visualization model. The proposed user interface requires the similarity threshold value (λ) and a list of majors. If the user is not interested in course relationships with low similarity values, the interface can exclude edges with similarity values below a given threshold.
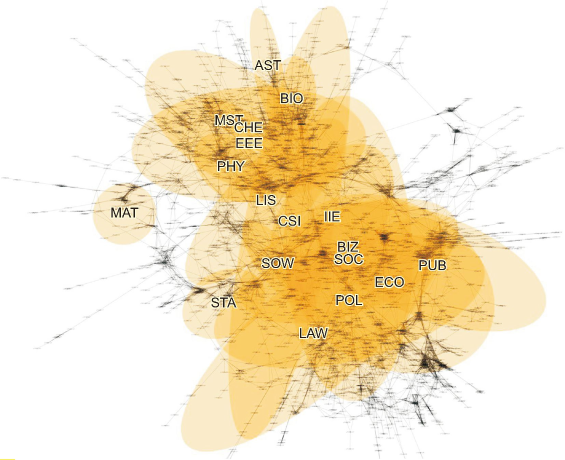
Fig. 5 shows the visualization of the largest connected component with λ set to 0.25. We draw the smallest enclosing ellipses that include at least 50% of each academic major’s courses to locate the core of each major cluster. The major code is added to the center of each ellipse. Core courses are selected greedily from the largest connected component to the smallest until the selected set is greater than 50% of all courses in the major.

Force-directed graph representing textual similarities between undergraduate courses at Yonsei University (λ=0.25). Only the largest connected component is shown in the figure. Engineering and science majors are clustered together on the upper side of the graph, while social science, business, and law majors are gathered on the lower side. It is noteworthy that the ellipses of computer science and information science are located between the abovementioned groups. AST, astronomy; BIO, systems biology; MST, materials science and engineering; CHE, chemistry; EEE, electrical and electronic engineering; PHY, physics; MAT, mathematics; LIS, library and information science; CSI, computer science; IIE, industrial engineering; BIZ, business administration; SOW, social welfare; SOC, sociology; STA, applied statistics; PUB, public administration; ECO, economics; POL, political science and international studies; LAW, law.
We employ the method proposed by Gärtner and Schönherr (1997) to determine the position of each ellipse based on the selected sets. This method finds the unique closed ellipsoid of the smallest volume enclosing a set of multiple coordinates. In Fig. 5, Physics (PHY) are clustered in the upper part of the graph. Astronomy (AST) is located in one corner, while electrical and electronic engineering (EEE), materials science and engineering (MST), and chemistry (CHE) are located in the center of the cluster. The overlap between MST and EEE is not surprising, since they share common topics and methods. Closely related majors, such as library and information science (LIS), computer science (CSI), and industrial engineering (IIE), are placed in the center of the graph. On the lower right side are the clusters of law (LAW), public administration (PUB), and political science and international studies (POL), which often cover subjects of public interest and share legal terminology. This macroscopic image provides insights into the structure of knowledge at the undergraduate level and shows possible connections between majors.
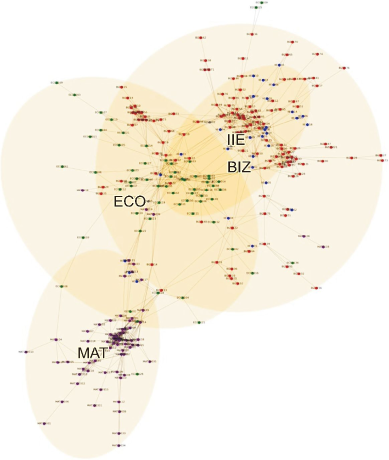
Fig. 6 is a visualization of courses belonging to IIE, business administration (BIZ), mathematics (MAT), and economics (ECO) majors. IIE and BIZ share a significant portion of their academic interests, and the visualization confirms this observation. The visualization suggests that the boundary between these two majors is not clear, and a collaborative curriculum could provide more opportunities for interdisciplinary learning.

Force-directed graph representing textual similarities between undergraduate courses of mathematics (MAT, purple), economics (ECO, blue), business administration (BIZ, red), and industrial engineering (IIE, green) at Yonsei University (λ=0.15).
In particular, it can be seen that financial management, a subject common to both majors, has strong connections to ECO and MAT. For instance, “Financial Engineering” and “Investment Engineering” courses offered in the IIE major are more closely associated with ECO compared to other courses within the same major.
Similarly, many BIZ courses such as “Financial Management” and “Investment Theory” show numerous connections with courses in ECO. While finance is a subfield within the business major, it seems closer to ECO courses than to other business courses.
Strong mathematical skills are a basic requirement for financial engineering or management science in business majors. However, there are relatively few direct links seen here between business courses and MAT courses. Among the BIZ subjects, only “Management Mathematics I” and “Management Mathematics II” are directly related to courses offered in the MAT major. On the other hand, “Actuary and Financial Mathematics,” offered in MAT, is separated from the main cluster in MAT and instead forms a triangle connection with the business major courses “Insurance Principles” and “Insurance Company Operations.”
Finance-related topics are covered in all of the previously mentioned four majors, but the coverage areas are not identical. If one is a student who wishes to learn finance at Yonsei University, it would be helpful to know about these broad ranges of lectures and their connections. Unfortunately, this information is not readily available to students in existing course catalogs and recommendation systems. Our graph-augmented course navigation system allows students to easily find courses that offer interdisciplinary learning opportunities.
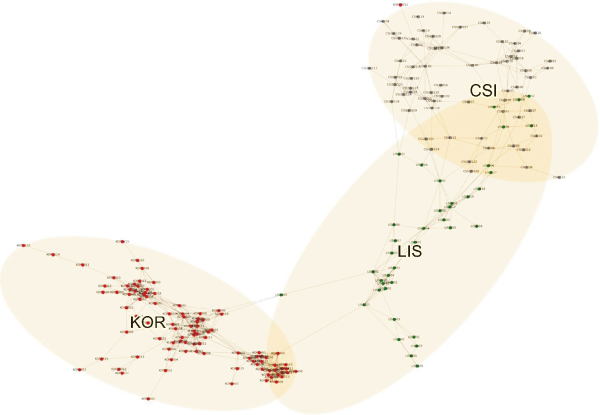
Fig. 7 showcases a relatively unusual combination of majors: Korean literature and language (KOR), LIS, and CSI. There are three links between the Korean literature department and the LIS department. “Introduction to Korean Language and Information” (KOR2403) is connected to “Introduction to Library and Information Science” (LIS1101), and “Digital Contents Planning & Construction” (LIS2405) is connected to “Classical Literature and Performing Arts” (KOR3518) and “Korean Classical Literature and Digital Contents” (KOR4506). On the other hand, there exists no strong direct links connecting Korean language and CSI departments, while LIS and CSI has multiple strong connections between them. This indicates that the topics of informatics in Korean language and digital contents are shared between the two departments: KOR and LIS, but are not covered in CSI major.

Force-directed graph representing textual similarities between undergraduate courses of Korean language and literature (KOR, red), library and information science (LIS, green), and computer science (CSI, blue) at Yonsei University (λ=0.15).
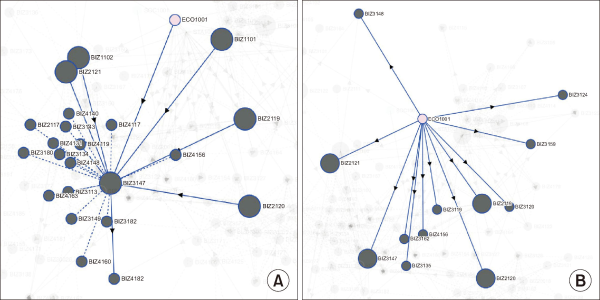
Fig. 8 presents an interactive user interface showing the network consisting of lectures in BIZ only. In addition to the similarity connections between lectures (represented as dotted undirected lines), prerequisite relationships between courses are displayed as directed edges. Additionally, the nodes representing graduation requirements are enlarged. The graphical user interface allows the student to search courses with a high degree of similarity to the one he or she might be interested in. It consists of three parts: the database storing syllabus, the similarity calculation unit that calculates the similarity between courses, and the course search unit that provides information on courses searched by users and ones that are similar to those searched.

Interactive network visualization of business major courses at Yonsei University: (A) when the user activates node BIZ3147 and (B) when the user activates node ECO1001.
By interacting with the visualization of the syllabus network, users can quickly identify course dependencies. Fig. 8A shows that “Strategic Management” is a significant capstone course for the BIZ major, and has several prerequisites, including five mandatory courses for graduation. Fig. 8B demonstrates the visualization when clicking on “Introduction to Economics.” This course is a prerequisite for many financial management courses, and four mandatory courses for graduation require that students have taken “Introduction to Economics.”
Easy access to the structural nature of the entire curriculum is essential for students. The visualization and interactive user interface help undergraduates plan their academic path and overcome their narrow perspective.
7. DISCUSSION
In this paper, we have suggested a graphical rendering method of courses, analyzed the syllabus database of Yonsei University, and explored the interconnected structure of undergraduate-level courses. The pedagogical challenge that universities face in supporting multidisciplinary learning gives our research practical importance. Our analysis provides comprehensive examples of performing structural analysis and visualizing undergraduate courses. Additionally, we have presented a visualization-based course navigation system aimed at providing students with access to the structure of the entire academic landscape of a university. The proposed system, patented by the Korean Intellectual Property Office (Park et al., 2018), also offers prerequisite and post-requisite information about courses. This innovative approach is expected to offer students valuable insights into potential connections between courses. The user interface empowers students to navigate the syllabi of various academic fields with ease and provides opportunities for self-driven interdisciplinary learning.
Our analysis reveals the existence of both knowledge separations and interconnections between academic majors. It demonstrates that humanities and science/engineering courses, while still upholding the validity of the boundaries defined by academic majors, exhibit a high degree of interconnectedness across those boundaries. It also quantitatively illustrates that a particular set of courses exhibits distinct characteristics. While some majors seem more isolated, others act as bridges between different disciplines. Although our results are based on data from a single university, the interfaces and analyses we propose are applicable to other institutions as well. We expect that the similarities and differences among the network structures of multiple universities will lead to a more comprehensive understanding of knowledge structure and specialization in each institution.
The user interface that we suggest is a tool for students to find opportunities for interdisciplinary learning and thus requires further support from the university involved. For example, university regulations regarding course registration and graduation requirements need to be more flexible to support interdisciplinary learning alongside our system. Students’ self-developed multidisciplinary learning should be recognized and affirmed by the university if it satisfies certain criteria, similar to academic minors. Finally, the levels of detail in syllabi still vary significantly in Yonsei University’s data, even though the university has its own standard format for syllabus writing. Lecturers’ responsible and sincere participation in delivering information through their syllabi will improve the overall quality of service based on our approach.
In our future study, we will focus on diachronic analysis and explain how the interdisciplinary connections between majors have evolved over time. Additional data, such as student demand for offered courses or students’ course registration log data (Parameswaran et al., 2010), can further enhance our approach by providing an education consumer’s perspective.
1Due to changes in the university’s policy regarding exporting internal databases, syllabus data after 2016 is unavailable.
REFERENCES
(2003) An information-theoretic perspective of tf-idf measures Information Processing & Management, 39(1), 45-65 https://doi.org/10.1016/S0306-4573(02)00021-3.
, (2014) Patent keyword network analysis for improving technology development efficiency Technological Forecasting and Social Change, 83, 170-182 https://doi.org/10.1016/j.techfore.2013.07.004.
, (2008) Double your major, double your return? Economics of Education Review, 27(4), 375-386 https://doi.org/10.1016/j.econedurev.2007.03.001.
, , , , (2023) Multidisciplinary education through faculty members' conceptualisations of and experiences in engineering education European Journal of Engineering Education, 48(4), 707-723 https://doi.org/10.1080/03043797.2023.2185126.
, (1991) Graph drawing by force-directed placement Software: Practice and Experience, 21(11), 1129-1164 https://doi.org/10.1002/spe.4380211102.
(2006) Curriculum mapping-An essential tool for curriculum development Journal of Physician Assistant Education, 17(4), 61-64 https://journals.lww.com/jpae/citation/2006/17040/curriculum_mapping_an_essential_tool_for.36.aspx.
, , , (2017) Digging in the mines: Mining course syllabi in search of the library Evidence Based Library and Information Practice, 12(1), 72-84 https://doi.org/10.18438/B8GP81.
, , , (2007) Structure of collaboration network among Korean scientists - 'Small World' and position effect Korean Journal of Sociology, 41(4), 68-103 https://www.dbpia.co.kr/journal/articleDetail?nodeId=NODE00912572.
(2020) Bibliometric analysis of Korean journals in arts and kinesiology - From the perspective of authorship Journal of Information Science Theory and Practice, 8(3), 15-29 https://doi.org/10.1633/JISTaP.2020.8.3.2.
, , , (2010) KKMA: A tool for utilizing Sejong corpus based on relational database Journal of KISS: Computing Practices and Letters, 16(11), 1046-1050 https://www.dbpia.co.kr/journal/articleDetail?nodeId=NODE01566424.
, , , , , (2021, September 20-23) Proceedings of the 7th European Conference on Information Literacy Information Literacy Association Mining syllabi for IL gold: Best practices for text mining institutional documents to inform assessment and strategic planning for libraries and information literacy, 99
(2004) The structure of a social science collaboration network: Disciplinary cohesion from 1963 to 1999 American Sociological Review, 69(2), 213-238 https://doi.org/10.1177/000312240406900204.
(2001a) Scientific collaboration networks. I. Network construction and fundamental results Physical Review E, 64(1), 016131 https://doi.org/10.1103/PhysRevE.64.016131.
(2001b) Scientific collaboration networks. II. Shortest paths, weighted networks, and centrality Physical Review E, 64(1), 016132 https://doi.org/10.1103/PhysRevE.64.016132.
, (2020) A scientometric social network analysis of international collaborative publications of all India institute of medical sciences, India Journal of Information Science Theory and Practice, 8(3), 64-76 https://doi.org/10.1633/JISTaP.2020.8.3.5.
(1997) Ten cheers for interdisciplinarity: The case for interdisciplinary knowledge and research Social Science Journal, 34(2), 201-216 https://doi.org/10.1016/S0362-3319(97)90051-3.
, (2009) Clustering in weighted networks Social Networks, 31(2), 155-163 https://doi.org/10.1016/j.socnet.2009.02.002.
(2004) Understanding inverse document frequency: On theoretical arguments for IDF Journal of Documentation, 60(5), 503-520 https://doi.org/10.1108/00220410410560582.
, (2009) Curriculum mapping in higher education: A vehicle for collaboration Innovative Higher Education, 33(4), 271-280 https://doi.org/10.1007/s10755-008-9078-8.
(2015) Interdisciplinary research by the numbers Nature, 525(7569), 306-307 https://doi.org/10.1038/525306a.
(2008) Current status of curriculum mapping in Canada and the UK Medical Education, 42(8), 786-793 https://doi.org/10.1111/j.1365-2923.2008.03093.x.