1. INTRODUCTION
Starting in late 2019, the COVID-19 pandemic has rapidly impacted over 200 countries and territories (World Health Organization, 2020). It has caused an unprecedented impact on the world in ways that are not yet fully understood. Since the emergence of the disease, social media platforms, such as Twitter, have witnessed an extensive discourse on various aspects of COVID-19. This discourse reflects how individuals respond and are affected by the consequences of the disease. The analysis of the social media content related to COVID-19 can reveal patterns that can be vital for decision makers, health organizations, and businesses to respond intelligently in the current and future pandemics.
Twitter has been increasingly used by officials, politicians, and medical practitioners to disseminate information and communicate with people. The use of Twitter as a discussion platform on COVID-19 will only continue to grow, especially under the social distancing measures which have pushed people to spend more time on social media to keep updated and stay in touch. Thus, Twitter can serve as important data sources to provide collective intelligence and awareness of different aspects surrounding the disease, including health, economy, politics, and social life.
Numerous studies have utilized Twitter as a public perception monitor in different disastrous events, including tsunamis (Pourebrahim et al., 2019), earthquakes (Mendoza et al., 2019), hurricanes (Alam et al., 2018), and terrorist attacks (Bruns & Hanusch, 2017). In the context of disease outbreaks, Twitter has been also used as a data source for health surveillance and emergency communication systems (Byrd et al., 2016; Dai et al., 2017; Jordan et al., 2019). Twitter data has been found to be useful for several public health applications, including monitoring diseases, public reaction, outbreak/emergency situations, prediction, and lifestyle (Jordan et al., 2019).
This study evaluates the topics and opinions of COVID-19 discussion found on Twitter by using spatiotemporal topic modeling and sentiment analysis. Topic modeling will be used to determine the topics of discussion on Twitter about the pandemic. Sentiment analysis will be used to determine the different levels of positive and negative opinion on COVID-19 present in the dataset. Identifying these topics and sentiments will give decision makers a comprehensive view of the ongoing events and their impacts. It will also help them analyze and improve their policies based on the trends and moods perceived from Twitter.
Our work contributes to the growing body of literature on social media analytics and COVID-19. Compared to other studies related to COVID-19, this study is distinguished by the in-depth analysis that is performed at different levels (volume analysis, topic modeling, sentiment analysis) and from different perspectives (spatial, temporal). In addition, it employs and evaluates an enhanced topic modeling approach that uses Latent Dirichlet Allocation (LDA) with author-based pooling and phrase modeling to improve the quality of topics.
The rest of the paper is organized as the following: The following section discusses related works and highlights the differences between this study and existing ones. Afterwards, the experimental methodology used in this study is presented, followed by data collection and preparation steps. The topic modeling approach is then explained. Subsequently, volume analysis is performed to establish basic geospatial facts about the dataset. Then, results from topic modeling are presented from both temporal and spatial perspectives, and are discussed in light of significant real-world events where possible. Results from the sentiment analysis are then discussed. The performance of the topic modeling approach is then evaluated by being compared with other alternative techniques. The last section provides the summary and conclusions.
2. RELATED WORKS
Recently, a growing number of works have tried to analyze Twitter activity during the COVID-19 pandemic. These efforts vary based on their intentions, analysis techniques, and depth of analysis. Table 1 summarizes the key features of existing studies so far and compares them with our study. Some works (Banda et al., 2020; Kabir & Madria, 2020; Lopez et al., 2020) presented descriptive statistics and key features of Twitter datasets they collected, but they did not employ machine learning techniques to analyze discussed topics or sentiments. Cinelli et al. (2020) performed a comparative analysis on five social media platforms (Twitter, Instagram, YouTube, Reddit, and Gab) for the purpose of identifying prominent themes of discussion.

Comparison of studies that analyzed Twitter activity during COVID-19 pandemic
Several studies used topic modeling to determine the topics of discussion on Twitter about COVID-19. Singh et al. (2020) analyzed themes of discussion with a focus on myths and misinformation shared about the virus. Sha et al. (2020) analyzed tweets posted by the U.S. governors, the president, and his cabinet members. The intention was to extract topics that attracted attention, and to understand how decision makers influenced each other by constructing influence networks. Ordun et al. (2020) used topic modeling to reveal common themes in Twitter data. They applied Uniform Manifold Approximation and Projection (UMAP) to visualize generated topics. However, user sentiment and geospatial analysis were not considered in their study. Abd-Alrazaq et al. (2020) performed topic modeling and then conducted sentiment analysis for each topic. However, their study did not include time based and geospatial analysis to compare the distribution of topics over time and across countries. Wicke and Bolognesi (2020) presented an analysis of the discourse around COVID-19 based on a corpus of 200k tweets. Their study used topic modelling, but it did not tackle sentiment, temporal, and special analysis of tweet contents. Duong et al. (2020) analyzed tweets from college students in terms of the response to the closure of universities and the discussed topics on several social issues. Medford et al. (2020) performed a sentiment analysis to identify emotional valence and predominant emotions during the COVID-19 outbreak. They also conducted topic modeling to explore discussion themes over time. Sharma et al. (2020) also used topic modeling to identify topics from Twitter posts on COVID-19. They also examined the sentiments over time in each country/region. Chen et al. (2020) presented a study on the topic preference related to the use of controversial and non-controversial terms associated with COVID-19 on Twitter.
To our knowledge, little work has been done so far to perform spatio-temporal analysis of topics and sentiments in COVID-19 Twitter content at a global level. Spatio-temporal analysis is essential to compare and contrast the nature of COVID-19 discussions between different countries and over time. In addition, the studies reported in Table 1 all cover early periods before the outbreak reaches its peak in top infected countries such as the USA and UK. This work inspects the time period from the middle of February to the end of May 2020. This period marked key moments in the timeline of the pandemic, such as reaching and surpassing the peak of the outbreak in certain countries. It also witnessed the tightening and easing of lockdown restrictions, which is likely to influence Twitter discussions and sentiments. Thus, our analysis is likely to reveal patterns and topics not observed in the early stages of the outbreak.
Another technical difference between this study and the others lies in the technique used for topic modeling. While most existing studies used the standard LDA to infer topics from Twitter content (see Table 1), it has been found that the standard LDA does not work well with the messy form of Twitter content (Zhao et al., 2011). The naïve application of LDA to Twitter content is likely to produce incoherent topics (Mehrotra et al., 2013). Instead, this study uses the tweet pooling scheme from Hong and Davison (2010) to merge related tweets and present them as a single document to the LDA model. Evaluation of the topic coherence has proved improved results when compared to the topic model generated by the standard LDA.
3. EXPERIMENTAL METHODOLOGY
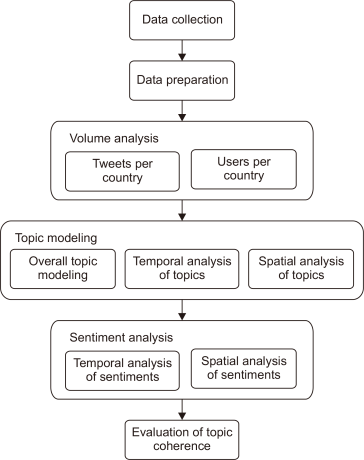
Fig. 1 depicts the experimental methodology adopted in this work. Several steps were performed sequentially in the workflow, including data collection, data preparation, volume analysis, topic modeling, sentiment analysis, and evaluation. Volume analysis aims to establish an overview on the geospatial features of the collected corpus. Topic modeling was then performed to identify the main topics of discussion. Topics were also analyzed over time and between top tweeting countries to provide an insight into the location-based and time-based differences. Sentiment analysis was also performed at both temporal and spatial levels, and results from the topic modeling were linked with the sentiment results where possible. Implications of each method of analysis were also discussed and put into context.

Experimental methodology.
4. DATA COLLECTION
The dataset consists of 9,716,668 distinct tweets posted during the period from 15 February 2020 to 31 May 2020. It was collected by using Twitter application programmable interface (API). The keywords used to search for tweets were: coronavirus, COVID, COVID-19, ncov19, and ncov2019. The collected tweets should contain at least one of the aforementioned keywords or some variant of them. The following variables were collected for each tweet where possible: tweetid (an id associated with the tweet), userid (an id identifying the user who posted the tweet), postdate (the time and day the tweet was posted), latitude, longitude, and message (the text of the tweet). Note that the latitude and longitude variables may have null values if the Twitter API cannot identify the location where the tweet was posted from. IDs of all tweets in the dataset were made available online and can be accessed from https://github.com/iyadalagha/COVID-19-corpus (tweet information can be retrieved by the tweet id using Twitter API). Table 2 shows sample tweets and the associated information from the dataset. Note that the userids are not shown for privacy issues.
Sample of tweets in the dataset
5. DATA PREPARATION
Tweets often have unique features that make the pre-processing of them different from that for ordinary text. Tweets are of limited length (140 characters at most), and may contain special texts such as hashtags, URLs, emoticons, and usernames. Tweets were pre-processed and prepared for the topic modeling and sentiment analysis by applying the following steps:
-
Filtering: This study is limited to tweets written in English only, so all non-English tweets were excluded. In total, about 16% of collected tweets were written in non-English languages. In addition, all non-geocoded tweets were eliminated: These are the tweets that have no associated latitude and longitude values. About 21.5% of the collected were non-geocoded.
-
Tokenization and Tagging: Tweets often come with a special grammar and abbreviations so that users can convey messages with the least possible words. Traditional tokenizers and part of speech taggers may be inadequate for pre-processing tweets, and there is a need for alternatives that can recognize tweets’ tokens, hashtags, emoticons, and URLs. We used a text processing library called ArkTweetNLP (Owoputi et al., 2013) to tokenize and tag tweets. The library was developed specifically to handle informal and online conversational text including various non-standard lexical items and syntactic patterns.
-
Cleaning: Twitter users often use symbols and non-standard language in their tweets. Many of the used symbols may be irrelevant and thus may lead to incorrect results when analyzed. Thus, tweets were cleaned by removing the following parts: Usernames, numeric expressions, punctuation, and URLs. These parts were recognized from the tagger applied in the previous step.
-
Normalization of emoticons: Emoticons are important for sentiment analysis; thus, their meanings should be preserved and should not be removed from tweets. In our approach, we used a special dictionary that contains the most used emotions and their meanings in English (Gimpel et al., 2013). This dictionary was used to replace each emoticon with its relevant meaning. For example, the emoticons ☺, ☺, and :) are all replaced with the word “happy.”
-
Spell check and correction: Tweets may contain incorrect or miss-spelled words. This step manipulates these words by using a spell checker, and substitutes them with correct words. Jazzy Spell Checker (Idzelis, 2005) was used for this step.
-
Reverse geocoding: Tweets that have latitude and longitude values should be mapped to a readable country name. This is necessary to perform the geospatial analysis. The Google maps geocoding API was used to determine the country that corresponds to the input latitude and longitude. After assigning tweets to countries, tweets were counted per country. Countries that ended up with a number of tweets less than 0.1% of the total number of tweets were ignored.
-
Stop-word and keyword removal: Stop-words were filtered out to improve the topic quality and reduce the noise. In addition, the keywords that were used to search for the tweets were also removed. Since these keywords are likely to be included in every tweet, removing them will ensure that the topics produced by topic modeling will not be dominated by the same keywords.
-
Phrase modeling: One limitation of LDA is that it generates topics consisting of single words only. As a result, generated words that are originally part of frequently used phrases will become meaningless in results. For example, phrases such as “Stay at home” and “social distancing” will be split and presented as separate words after applying LDA. To resolve this issue, frequently used phrases in the corpus were first detected by using the Gensim library in Python (Řehůřek & Sojka, 2011). For simplicity, only phrases of two and three words were detected if they occurred together n number of times, where n is a threshold value set to 100 based on our experiments. Each detected phrase is then put together into one word by replacing spaces with underscores (e.g., the phrase “Stay at home” becomes “Stay_at_home”). Hence it will be treated as a single word when processed by LDA.
After applying the aforementioned data preparation steps, the size of the final cleaned corpus was 6,058,710 tweets.
6. TOPIC MODELING USING LDA
Topic modeling is an unsupervised machine learning technique used to discover topics that occur within a collection of documents, and in what quantities (Blei & Lafferty, 2006). The topics generated by topic modeling are probabilistic mixtures of words that represent the word co-occurrence trends in the corpus. With respect to topic modeling in Twitter, each tweet is often treated as a document in the corpus, and can be viewed as a set of topics with different proportions depending on the frequency that terms appear (Alvarez-Melis & Saveski, 2016). Topics are the themes that the documents discuss or talk about. A good topic model is one that corresponds to distinct subjects of discussion in the dataset. This means that a good topic model should produce distinctive topics in the sense that the keywords belonging to a particular topic should not have much overlap with keywords in other topics.
LDA is a popular algorithm that is commonly used to train a topic model (Blei et al., 2003). Formally, LDA takes two inputs: 1) A bag-of-words corpus containing d documents and a vocabulary of size v, and 2) A scalar value k, which indicates the number of topics that the model will learn. LDA then outputs a model, m. The model m consists of two matrices:
-
A Topic × Vocabulary matrix, Tm∈Rk×v. This is the matrix of topics that are learned by the model, with entry Tmi,j representing the association of word j with topic i.
-
A Document × Topic matrix, Dm∈Rd×k, with entry Dmi,j representing the probability that document i is generated by topic j.
LDA works by looking at the word co-occurrences within documents. It then assumes that words that appear in the same document are likely to belong to the same topic, and that the documents that contain the same words are likely to contain the same topics. To summarize how the topics are inferred and to train an LDA model from the documents, the generative process is described as the following (Ponweiser, 2012):
LDA is often used on long documents. However, it has been found that it does not work well with shorter documents such as tweets and will often generate incoherent topics (Liu et al., 2018; Mehrotra et al., 2013). A common solution to this problem is tweet pooling (Alvarez-Melis & Saveski, 2016; Mehrotra et al., 2013), in which related tweets are merged together and presented as a single document to the LDA model. Several pooling schemes have been proposed in the literature to improve the LDA topic quality (Li et al., 2016; Mehrotra et al., 2013). These schemes include temporal pooling (tweets posted within the same hour), pooling by author, and pooling by hashtag. This work uses author-based pooling by building a document per author that includes all tweets he/she posted. Aggregating tweets according to the author is shown to be superior to un-pooled tweets with respect to topic modeling (Hong & Davison, 2010; Weng et al., 2010).
Another essential parameter of LDA is the number of topics that the model should produce from the corpus, k. Running the LDA model with k as input will result in dividing the documents in the corpus into k topics. Setting k to be too small will lead to too generic results because many distinct topics may be merged together. In contrast, setting k to be too big will result in too many topics that are individually confusing (Nikita, 2016). To choose the optimal number of topics k, the LDA model was built several times by setting k=5, 10, 15... and 50 (increments of 5), and the quality of the generated topics are compared. This approach was adopted in many works that used LDA for topic modeling (Maier et al., 2018; Zhao et al., 2015).
To address the memory and processing power needed to process the large volume of collected tweets and associated information, a cluster of computers was used in this study, and was operated by Apache Spark (Zaharia et al., 2016) as a cluster-computing framework. Apache Spark can distribute computational power to automatically parallelize and execute tasks on a large cluster of computers. It also provides a highly-optimized machine learning library called MLlib (Meng et al., 2016) which can perform LDA on numerous datasets.
7. RESULTS
7.1. Volume Analysis
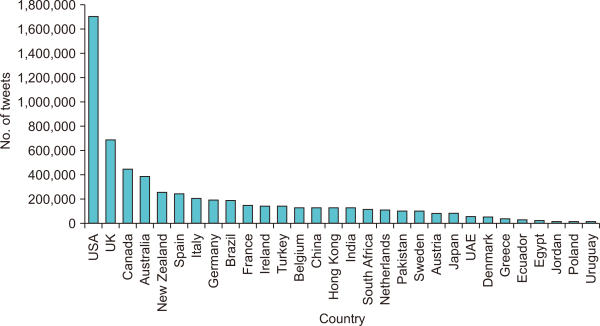
Analyzing the volume of tweets in terms of posting countries and users is an essential first step in exploring the data and may provide some useful results by itself. It can also help us to better understand and put into context the results of topic modeling and sentiment analysis. Fig. 2 shows the number of tweets per country. The top five tweeting countries are the USA with 1,708,556 tweets, the UK with 690,693 tweets, Canada with 442,286 tweets, Australia with 387,757, and New Zealand with 254,466. The USA is the top tweeting country with respect to COVID-19, and contributes with 28.2% of the total number of tweets. Results also indicate that the countries that have the largest numbers of English-speaking populations are the most predominant in the corpus.

Number of tweets per country.
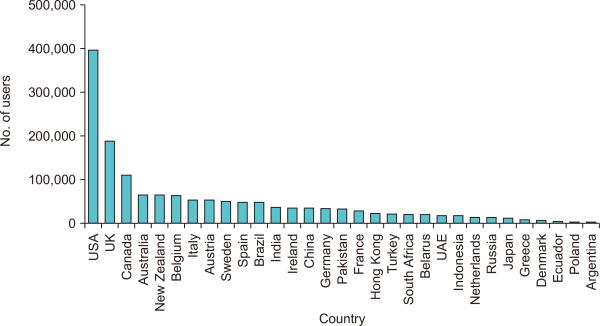
Another variable of interest is the number of users per country. In total, tweets in the corpus were posted by 1,553,516 users, and the average number of tweets per user is 4.9. Fig. 3 depicts the number of users per country. The distribution of users over countries is highly consistent with the distribution of tweets over countries. Over a quarter of the users in the corpus came from the USA. It is obvious from these results that the USA is the dominant country in the dataset in terms of the number of tweets and users. This is understandable given that the USA was the most affected country by the pandemic, during the period of study, as indicated by death and infection rates. Thus, it is likely that the attitudes and behavior of the USA users will have the highest influence on the topic modeling and sentiment analysis.

Number of users per country.
7.2. Topic Modeling
When testing LDA with different number of topics as an input parameter, results showed that using 20 topics resulted in the best topic model for the dataset. In addition, choosing 20 topics is a reasonable number that allows each topic to include a variety of narrower subjects.
7.2.1. LDA with author pooling scheme
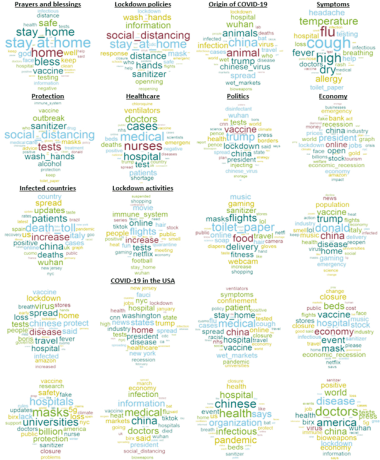
Table 3 shows the results of topic modeling with topic labels. In general, words produced within several topics were mostly related enough to be given a label that describes the enclosing topic. The labels of topics were chosen by looking at the top 30 words per topic based on their probabilities. The ability to label the produced topics could be a sign of a good topic model. However, some topics look incomprehensible from a human perspective, and thus could not be labelled correctly. Fig. 4 visualizes the same topic model with word clouds, whereas the size of a word within a word cloud is proportional to the probability of the word within the topic.

Word clouds for Latent Dirichlet Allocation topic model.
Top words of 20 topics generated from LDA with author-pooling scheme
After generating the topic model, each tweet in the dataset was assigned to its topic. This is necessary to understand the context in which words of the topic appear. LDA generates a document-topic matrix, which allows mapping tweets to the generated topics. Note that a single tweet can map to more than one topic. Thus, we mapped the tweet to the most probable topic so that topics are isolated for further analysis.
One should note that some generated topics may include incompatible words, and thus could not be labelled. As LDA starts with a degree of randomness, it generates a slightly different topic model every time, and the quality of some topics may vary largely. However, tuning LDA by setting the number of generated topics to 20 and by employing the author pooling scheme helped in stabilizing the generated topic model to a large extent in most iterations.
In addition, LDA does not discard words. It must assign each word to some topic, even if the word has relatively little meaning. This may cause some topics to be less coherent and meaningful. For example, the words “likes” and “doesn’t” appear in many topics. However, many of the topics in Table 3 are indeed meaningful, which was the intended result.
It is normal in topic modeling to find many words appearing in several topics but with different weights. For example, the words “China,” “Trump,” “Stay_at_home,” and “tests” appear in many topics, and this is a rational result when considering the overlap between the topics. In addition, several topics include multiword phrases such as “stay_home,” “social_distancing,” “wet_markets,” “wash_hands,” and “death_toll.” These phrases appeared due to the phrase detection and grouping step applied before performing topic modelling. Without such a step, LDA will only generate topics of single words that may not convey precise meaning as compared to phrases.
It can also be noticed that some topics look similar, with small differences that may not be observable. For example, the topics “lockdown policies” and “protection” have many similar words. However, the difference between topics has a basis in the word co-occurrence statistics in the dataset. For example, the topic “lockdown policies” includes words that have frequently occurred in the context of governmental/national actions and plans in response to the COVID-19 outbreak. On the other hand, the words in the “protection” topic were mostly inferred from tweets discussing protection, safety products, and procedures. Similarly, the “Origin of COVID-19,” “politics,” and “economy” topics overlap in several words, but each topic is inferred from a different type of discussions.
The “politics” topic includes words that are mostly used in the context of government policies and international relations pertaining to COVID-19. Most tweets in the “politics” topic came from politicians and news agencies reporting updates related to the outbreak. In addition, the controversy raised over President Trump’s tweets and White House briefings triggered political debates among USA users in particular. Numerous Twitter discussions that contributed to this topic also centered on tensions surrounding the trade and transport of medicines, diagnostic tests, and hospital equipment. Political figures like Donald Trump, Anthony Fauci, and Andrew Cuomo have gained attention in these discussions.
The economy is also strongly present in the topic model. The fears of economic fallout and job losses have been prevailing among Twitter users, and this was evident from the many topical words referring to the economic impact of COVID-19. Examples of these words are “Opening,” “bank,” “jobs,” “stock,” “recession,” “economic_recession,” “welfare,” “prices,” “industry,” and “emergency.”
It was also noticed that there are topics that reflect the top information needs and seeking behavior of Twitter users during the COVID-19 outbreak. Topics labelled as “symptoms,” “protection,” and “the origin of COVID-19” collectively show that the discovery of and protection from the disease were among the main topics raised in Twitter conversations. Another remarkable observation is the presence of a topic on healthcare. Words in this topic were mainly inferred from tweets discussing the concerns and difficulties faced by medical staff in infected countries and the shortage in hospital beds, ventilators, and medical staff.
Another interesting result is the presence of several words that indicate how people behave or spend their time during the quarantine. One topic is labelled as “Lockdown activities” since it includes words such as “movie,” “series,” “music,” “toilet_paper,” “gaming,” “wash_hands,” “webcam,” and “hair.” In fact, these words refer to products or activities that flourished during the lockdown. In addition, the topic model includes the names of several products that experienced high demand and spikes in sales such as “alcohol,” “hand sanitizer,” “masks,” and “ventilators.” The analysis of tweets related to this topic showed the increase in discussion around the closure of stores, and the shortage of certain products in several countries.
It is also interesting to find names of certain businesses such as “Amazon,” “TikTok,” and “Netflix” repeated in multiple topics. This result makes sense considering that the services offered by these businesses have seen an enormous increase in demand during the quarantine period. The word “online” also appeared repeatedly, indicating that consumers are shifting towards online activities in daily life. In general, these results shed light onto consumer behavior and spending habits during the pandemic.
Among the generated topics, there is also a topic dedicated to debate over the origins of COVID-19. This particular topic includes words that link to several conspiracy theories that were observed over multiple countries, such as the conspiracy promoting that COVID-19 is a bioweapon, the correlation between 5G technology and the virus, and the role of Chinese labs and bats. These terms, which also occurred in different other topics, highlight the widespread propagation of false information that has misled or influenced public opinion. Twitter discussions related to this topic also reveal the increased use of controversial terms insinuating that China is the origin of the virus. However, the controversy over the origin of the virus was prominent during March 2020 when many public figures used terms such as “the Chinese virus” in their tweets to refer to COVID-19, but it then subsided in April and May, especially after Twitter started labelling misleading, disputed, or unverified tweets about the coronavirus.1
7.2.2. Temporal analysis
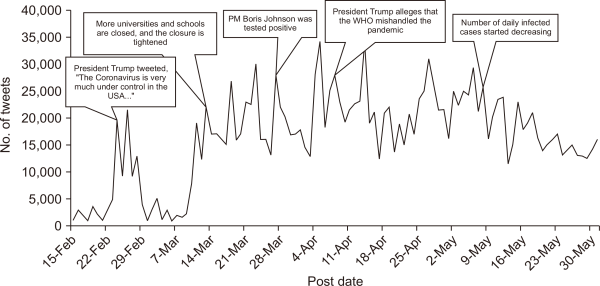
A temporal analysis of the topic model was performed. The purpose was to explore how the discussion on each topic changed over time, and the potential reasons behind the change. For simplicity, some related topics were examined as a group. For example, Fig. 5 shows a time series plot of the number of daily tweets belonging to the topics “politics” and “economy.” The number of daily tweets was generally increasing from the first of March till the first of May. The major increase was around the middle of March when nationwide social distancing protocols and school closures were attracting mass concerns. Afterwards, the daily number of tweets continued to increase at the same rate, before declining in May when most countries started to pass the peak of the outbreak and ease lockdowns. Thus, this pattern is in correspondence with the timeline of the infection and the changes in lockdown rules in the USA and the EU.

Proportion of “politics” and “economy” topic discussion per day. PM, Prime Minister; WHO, World Health Organization.
The spikes in the discussion on “politics” and “economy” topics were also explored and linked to certain events where possible (see data labels in Fig. 5). It was noticed that many spikes coincide with the discussion over the tweets of President Trump or lockdown procedures in the USA. In general, the discussion pattern was mostly influenced by political events and the timeline of the outbreak in the USA in particular. This indicates that politics/economy topics have a bias towards the USA as compared to other countries. This bias can be explained by the larger number of tweets in politics/economy that came from the USA. About 40% of USA tweets were in the politics/economy topics as compared to 30% of UK tweets and 22% of Canada tweets.
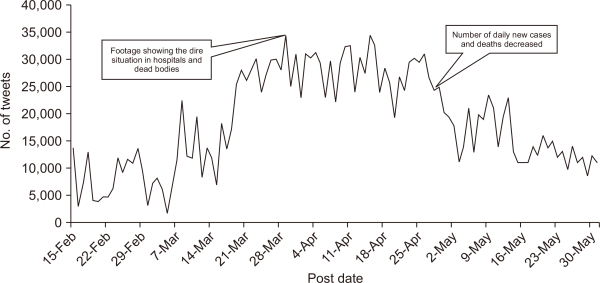
Fig. 6 shows a similar time-series plot of the number of tweets belonging to the topics “symptoms,” “protection,” and “healthcare.” The discussion over these topics started to rise after the first week of March, before reaching a peak in April, and then declining in May. Again, this is consistent with the timeline of the outbreak: In March, discussions over protection and lockdown protocols developed considerably in response to the outbreak and the pressure on healthcare services. The discussions then started to drop in May after most countries reached or passed the peak of infections.

Proportion of “symptoms” and “protection” and “healthcare” topic discussion per day.
7.2.3. Spatial analysis
In the previous analysis, topic modelling was performed at the world level by running LDA over the entire dataset. To explore the differences between individual countries, topic modeling was performed on certain English-speaking countries. LDA with an author pooling scheme and 20 topics was applied to the tweets of the USA, the UK, and Canada separately. Differences between generated topic models were then explored. Overall, the topic models of the UK and Canada were poor. The topics in the UK and Canada corpora were less meaningful and incoherent. Several topics were indistinguishable from each other, and many others seemed to cover multiple subjects at once. Only the model of the USA was the most similar to the model on the entire dataset, though the quality was lower. In general, the poor models produced for individual countries is likely caused by the division of the entire collection of tweets into smaller corpuses that were not sufficient for LDA to train accurate models. However, the larger size of the USA corpus compared to other countries resulted in a model with seemingly better quality.
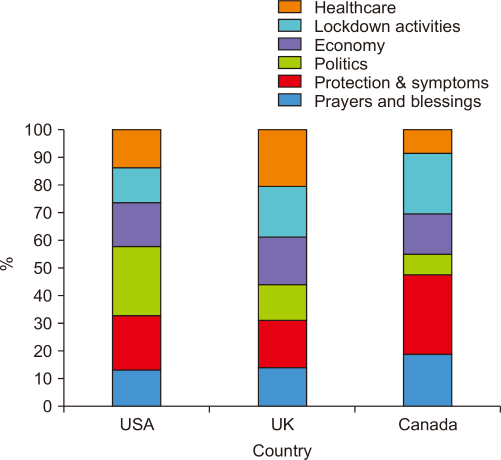
Based on the above discussion, it was not feasible to run LDA on county corpuses and then calculate the proportion of each topic discussion at the level of each country. To resolve this issue, just one topic model is produced using the entire dataset, and the percentage of tweets in each topic per country was analyzed. This approach was carried out by using the topic model shown in Table 3. For each of the aforementioned English-speaking countries, tweets in major topics (“politics,” “economy,” “protection & symptoms,” “healthcare,” and “prayers and blessings”) were separated, and the percentage of topic discussion per country was calculated. Fig. 7 shows these percentages. The percentage of topic discussion is defined as the number of tweets on that topic divided by the number of tweets on all topics times 100.

Topic discussion for select topics by country.
Notice that the “politics” topic made more discussion in the USA (25%) than in the UK (13%) and Canada (8%). This indicates that the tweets in the USA are more responsive to political events. This result is also consistent with the time-based analysis in Fig. 5, which shows that the growth in tweet numbers was influenced by certain political events. Discussion on the “economy” topic contributed by 15%, 17%, and 14% of the overall Twitter conversation in the USA, the UK, and Canada respectively. This indicates that the economic impact of COVID-19 was seemingly a shared concern in the three countries. The situation of healthcare staff and services also raised considerable discussion in the UK (21%), followed by the USA (14%) and Canada (9%). These numbers are apparently consistent with the severity of the outbreak and the pressure on the healthcare systems in the three countries. The little discussion on the healthcare topic in Canada can be explained by the fact that it is the least affected by the disease during the studied period.
Looking at the discussion on the “Lockdown activities” topic, it can be noticed that there was a significant Twitter discussion in the three countries about indoor activities that can alleviate the lockdown boredom. The analysis of this particular discussion can be of importance to business analyzers to better understand consumer behavior and preferences during the pandemic.
7.3. Sentiment Analysis
While volume analysis and topic modeling can be used to identify what topics are discussed in different countries or over a period of time, sentiment analysis is useful to determine emotional state in response to the outbreak.
To measure the sentiments of tweets, we used Valence Aware Dictionary and Sentiment Reasoner (VADER). VADER is a sentiment analysis model that was created for social media sentiment analysis (Hutto & Gilbert, 2014). It is more sensitive to sentiment expressions in social media contexts. The developers of VADER compared it with eleven state-of-the-practice benchmarks, and results showed that VADER improved the benefits of traditional sentiment lexicons (Hutto & Gilbert, 2014).
VADER was used to calculate a score for each tweet in the dataset. The calculated score ranges between -1 and +1, where -1 indicates the most negative and +1 indicates the most positive. Then, tweets were aggregated by postdates and countries in order to perform temporal and geospatial analysis of sentiment. The aim is to analyze how the sentiment has changed in different countries and over time. In addition, we aim to see whether spikes in positive or negative sentiment can be associated with certain events.
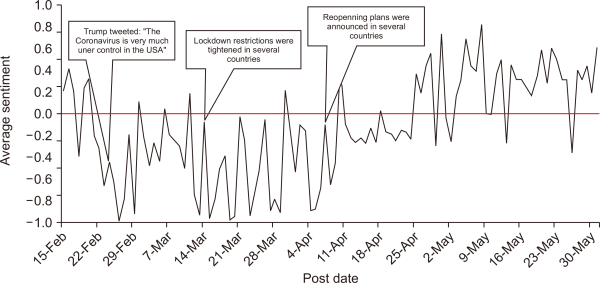
Fig. 8 shows a time-series plot of the total sentiment per day over the entire world. In general, the period from 15 February to 11 April was dominated by negative discussions. Looking at the tweets posted in this period, it was obvious that the feelings of fear and anxiety were strongly present. In addition, intensive debates raged over the preparedness of healthcare services and the response plans of governments. These debates were often filled wih derogatory and ridiculous words. After the middle of April, the sentiment started to swing towards the positive direction. In particular, the announcement of reopening plans in many countries and the ease of restrictions made a positive impact. This positivity was also observed from the increasing discussion during May on individuals’ plans to resume normal life activities.

Average sentiment of tweets per day.
It may be also interesting to link the change in sentiment in Fig. 8 with the distribution of discussed topics shown in Figs. 5 and 6. Major topics on politics, economy, symptoms, and protection were heavily discussed in March and April, before subsiding in May. Meanwhile, the average sentiment score was typically negative while the discussion on the aforementioned topics was active. Then, the sentiment score started to go positive as the infection started to decline and the discussion on the topics started to fade.
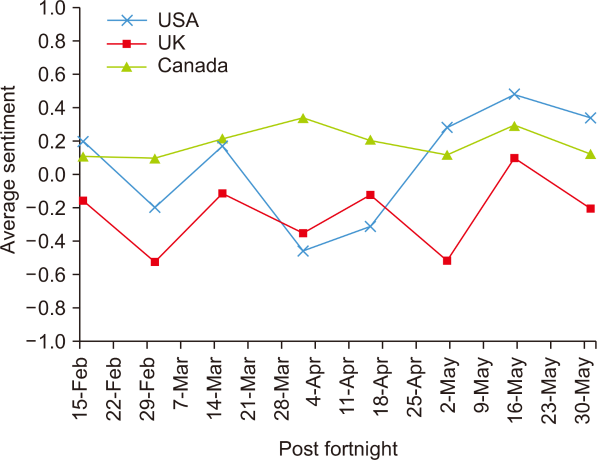
Fig. 9 shows the average sentiment of all tweets per fortnight by the top three tweeting countries (the USA, the UK, and Canada). The average sentiment per country for the whole period (15 February to 31 May) is -0.0261 for the USA, -0.2279 for the UK, and 0.2053 for Canada. This result makes sense because Canada is the least affected country by the pandemic during the studied period. The sentiment of Canada remained positive for the whole period, ranging between 0.115 and 0.401. The USA and the UK almost had negative sentiments until late April-May when the sentiment started going up. The three countries shared the same peak around the middle of May.

Average sentiment of tweets per fortnight between the three top tweeting countries.
8. EVALUATION
In this part, we aim to assess the interpretability of the generated topic models. The evaluation of topic modeling has been addressed in the literature by two schools: The first school adopted a human-based assessment in which humans read topics to evaluate their interpretability (Aletras & Stevenson, 2014; Rossetti et al., 2016; Smith et al., 2017). The second school has taken a more principled approach by employing measures that can automatically judge the quality of topics (Aletras & Stevenson, 2013; Mehrotra et al., 2013; Newman et al., 2010). A class of these measures are topic coherence measures, which are used to score a topic by measuring the degree of semantic similarity between the top words in the topic. These measurements help distinguish between topics that are semantically interpretable topics, and topics that are artifacts of statistical inference (Stevens et al., 2012). For the evaluation in this study, we consider the UMass metric (Mimno et al., 2011). UMass computes the coherence of a topic as the sum of pairwise distributional similarity scores over the set of topic words as the following:
where WT is the set of words in topic T. sim(wi,wj,∈) is the distributional similarity between a pair of words wi,wj. ∈ is a smoothing factor which guarantees that sim returns a real number (∈=1 is normally used). sim(wi,wj,∈) is calculated as the following:
where D(wi,wj) counts the number of documents containing words wi,wj, and D(wj) counts the number of documents containing wj.
A topic with a good UMass score contains words that are related to each other, i.e., words that are more likely to appear in the same tweets, whereas a topic with a bad UMass contains words that are unlikely to appear together in the same tweets. After calculating the UMass score of a topic, the performance of the whole topic model is calculated as the average of the UMass scores of its topics.
The quality of the model generated with LDA with author pooling scheme was compared with three other techniques commonly used in the literature for topic modeling. These techniques are:
-
Standard LDA, in which each tweet is treated as a single document, and LDA is trained on all tweets. This serves as a baseline for comparison to other techniques.
-
LDA with hashtag-based pooling: Hashtags are often used as topical markers for tweets. Users often use the same hashtags if they share related ideas or contribute with similar content. Of the 6,058,710 tweets in our dataset, 1,686,738 tweets (27.8%) have hashtags. Only tweets with hashtags can be used in this technique while other tweets are ignored. Tweets with the same hashtag were grouped as a single document. If a tweet had multiple hashtags, it was added to the document of each of those hashtags. This technique is used in Alvarez-Melis and Saveski (2016) and Sharma and Bedi (2018).
-
LDA with temporal pooling: When a major event occurs, a large number of users often start tweeting about the event within a short period of time. In this technique, tweets posted within the same hour were gathered in a single document. Then, the LDA model was trained on the collection of generated documents. This technique is used in Mehrotra et al. (2013).
The aforementioned three techniques were compared against the LDA with author-pooling scheme used in this study. For each technique, the same pre-processing and data cleaning steps explained in the data preparation step were applied. For each technique, a topic model was produced while changing the number of topics from 5 to 50 with a step of 5. The aim was also to investigate the optimal number of topics for each technique with our dataset. Table 4 shows UMass scores of different topic modelling techniques.
Comparison between topic modeling techniques based on UMass coherence score
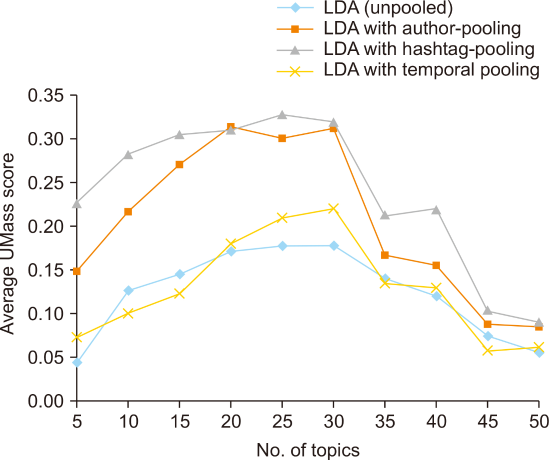
Fig. 10 depicts how the average UMass score changes as the number of generated topics increases. It indicates that the performance of the topic models reaches a peak between 20 to 30 topics for all techniques. Then, the performance starts degrading as the number of topics exceeds 30. In particular, LDA with author pooling generated the best model with 20 topics.

Change in UMass score when number of topics changes for different topic modeling techniques. LDA, Latent Dirichlet Allocation.
Overall, LDA with hashtag pooling gives the best UMass score with 20 topics. LDA with author pooling comes second with a marginal difference. However, it outperforms the other two techniques, i.e., the standard LDA and the LDA with temporal pooling. Given these results, LDA with author pooling is still considered the best choice for this study since only 27.8% of tweets are associated with hashtags.
9. CONCLUSIONS AND FUTURE WORK
This work presents a study of Twitter discussion on the COVID-19 pandemic for the purpose of analyzing themes of discussion and sentiment. LDA with author pooling scheme was used to extract topics. Topics are then discussed to highlight significant observations and potential implications. Our study differs from existing analytical studies on COVID-19 in Twitter in the following aspects: 1) Topic modeling and sentiment analysis are performed from both temporal and spatial perspectives, which allowed in-depth insight into the impact of the pandemic on topics and sentiments over time and between countries. Results showed that both topics and sentiments are influenced by significant events taking place during the timeline of the outbreak. In addition, countries had different topics of interests and sentiments depending on the preparedness of each country and how much it was affected by the infection. The analysis also uncovered several patterns, such as the kind of lockdown activities that people practiced, the businesses and products that were in high demand, and the misinformation swirling around COVID-19. 2) The study uses LDA with author pooling scheme and phrase detection for topic modeling. This is in contrast to most other studies which used an un-pooled LDA. The intention was to overcome the limitations encountered with the standard LDA when used with short texts such as tweets. 3) To our knowledge, the study covers a more recent and longer period of time that includes significant events not covered in previous studies. During the studied period, the lockdown policies were tightened and eased, and the infection reached the peak in the top tweeting countries.
The study has the following limitations: 1) It only examined tweets in English, and thus the results cannot be generalized to non-English speaking countries. 2) Many tweets in the dataset are difficult to understand because the context of the tweet, i.e., the conversation, is not preserved. This can affect the quality of the topic modeling and sentiment analysis, and make it difficult to perform text mining.
There are many directions to extend this work. Since the pandemic is at a global scale, analysis of other social media platforms and different languages is critical to gain a better understanding of the global consequences of COVID-19. Second, it is possible to analyze the retweet activity to better understand how information is propagated and which users dominated the COVID-19 discussions. Third, network analysis can be performed to identify clusters of users with topic similarity. Fourth, it may be interesting to analyze the Twitter activity of specific groups of users such as the people who were tested positive, or people who are more vulnerable to COVID-19.
REFERENCES
, , , , , , , , (2020) A large-scale COVID-19 Twitter chatter dataset for open scientific research -- an international collaboration arXiv https://arxiv.org/abs/2004.03688. Article Id (pmcid)
, , , , (2020) In the eyes of the beholder: Analyzing social media use of neutral and controversial terms for COVID-19 arXiv https://arxiv.org/abs/2004.10225.
, , , , , , , , (2020) The COVID-19 social media infodemic arXiv https://arxiv.org/abs/2003.05004. Article Id (pmcid)
, , , , (2020) The ivory tower lost: How college students respond differently than the general public to the COVID-19 pandemic arXiv https://arxiv.org/abs/2004.09968. Article Id (pmcid)
, , (2013, March 2013) Annotation guidelines for Twitter part-of-speech tagging version 0.3, http://www.ark.cs.cmu.edu/TweetNLP/annot_guidelines.pdf
(2005) Jazzy: The Java open source spell checker http://jazzy.sourceforge.net
, (2020) CoronaVis: A real-time COVID-19 Tweets data analyzer and data repository arXiv https://arxiv.org/abs/2004.13932.
, , , , (2018, July 1-3) Proceedings of the 30th International Conference on Software Engineering and Knowledge Engineering KSI Research Inc. and Knowledge Systems Institute Graduate School Topic modeling for noisy short texts with multiple relations, pp. 610-609, http://ksiresearchorg.ipage.com/seke/seke18.html
, , (2020) Understanding the perception of COVID-19 policies by mining a multilanguage Twitter dataset arXiv Understanding the perception of COVID-19 policies by mining a multilanguage Twitter dataset https://arxiv.org/abs/2003.10359.
, , , , , , , , , , , , , , , (2016) MLlib: Machine learning in Apache Spark Journal of Machine Learning Research, 17(2016), 1-7 https://www.jmlr.org/papers/volume17/15-237/15-237.pdf.
(2015) Select number of topics for LDA model http://rstudio-pubs-static.s3.amazonaws.com/107657_4cdc6f600fe44cc8b2600f6f9c470ce8.html
, , (2020) Exploratory analysis of Covid-19 Tweets using topic modeling, UMAP, and DiGraphs arXiv https://arxiv.org/abs/2005.03082.
, , , , , (2013, June 9-14) Proceedings of NAACL-HLT 2013 Association for Computational Linguistics Improved part-of-speech tagging for online conversational text with word clusters, pp. 380-390, https://www.aclweb.org/anthology/N13-1039.pdf
(2012) Diploma thesis Vienna, Austria: Vienna University Latent Dirichlet allocation in R, https://epub.wu.ac.at/3558/
, (2011) Gensim-statistical semantics in Python https://www.fi.muni.cz/usr/sojka/posters/rehurek-sojka-scipy2011.pdf
, , , (2020) Dynamic topic modeling of the COVID-19 Twitter narrative among U.S. governors and cabinet executives arXiv https://arxiv.org/abs/2004.11692.
, , , , , (2020) COVID-19 on social media: Analyzing misinformation in Twitter conversations arXiv https://arxiv.org/abs/2003.12309.
, , , , , , , , , (2020) A first look at COVID-19 information and misinformation sharing on Twitter arXiv https://arxiv.org/abs/2003.13907. Article Id (pmcid)
, (2020) Framing COVID-19: How we conceptualize and discuss the pandemic on Twitter arXiv https://arxiv.org/abs/2004.06986. Article Id (pmcid)
World Health Organization (WHO) (2020) Coronavirus disease (COVID-19) situation report - 142 https://www.who.int/docs/default-source/coronaviruse/situation-reports/20200610-covid-19-sitrep-142.pdf?sfvrsn=180898cd_6