Introduction
Wild boar (Sus scrofa Linnaeus 1958) is one of the most widely distributed and anthropologically introduced large mammal species in the world, including Asia and Europe (Ballari et al., 2015; Markov et al., 2022; Snow et al., 2017). It has been recently recorded from Jeju Island, where it was considered an extinct species (Han et al., 2011; Oh et al., 2007), and has been observed throughout the Korean peninsula (Cho et al., 2009).
Recent trends in habitat loss, agricultural land expansion, and vigorous reproduction have led to sharp increases in wild boar populations (National Institute of Biological Resources [NIBR], 2017; 2021). Such increases have resulted in conflicts with humans, due to damage to agricultural land (Bobek et al., 2017; Kim et al., 2014; Lee et al., 2018a; Schley et al., 2008), vehicle collisions (Kim et al., 2021; Pagany, 2020), and concerns regarding the possibility of transmission of diseases, such as African swine fever (ASF) and foot-and-mouth disease (Cadenas-Fernández et al., 2022; Guberti et al., 2019). As they are more frequently found in urban areas, damage to humans has increased and has become a social issue (Dudzińska & Dawidowicz, 2021; NIBR, 2021).
Human-wild boar conflict has been continuously increasing in recent years, and significant efforts are being made to address this issue (Lombardini et al., 2017; Pandey et al., 2016). In Korea, in particular, the situation has reached a critical point at which conflict between humans and wild boars has become a significant social problem owing to crop damage, incidents in urban areas, and even human casualties (Lee et al., 2018b). According to the Ministry of Environment (MOE, 2023a), damage to crops by harmful wild animals reached more than Korean Won (KRW) 10 billion per year from 2014 to 2021, and the damage to crops by wild boars reached 5 billion KRW per year. Between 2019 and 2021, 43,660 wild mammals and birds were killed, of which 573 were wild boar. In Korea, wild boar populations were comprised of 3,141 individuals with ASF by July 23, 2023 (MOE, 2023b).
In Korea, it is impossible to naturally control wild boar populations because of predator extinction (NIBR, 2017). Therefore, it is necessary to actively manage wild boars through hunting, reproduction control, and other methods to mitigate the damages (Croft et al., 2020). To this end, there have been diverse studies on the home range estimation of wild boars (Choi et al., 2006; Kim et al., 2017), its habitat density (Ferretti et al., 2021; Plhal et al., 2011), the status of its distribution (Acevedo et al., 2014), its population dynamics (Ditchkoff et al., 2012; Náhlik & Sándor, 2003), and feeding analytics (Lee & Lee, 2019). However, studies estimating the carrying capacity of wild boar populations, which indicates the maximum individuals that can survive in specific habitats, are largely lacking (Bruinderink & Hazebroek, 1995).
Recent developments in communication and information technology have led to the use of remote sensing data and habitat suitability models, which provide useful information for wildlife conservation (Heinrichs et al., 2017; Squires et al., 2013). Methods for estimating the potential carrying capacity of wild animal populations have shown remarkable development by integrating the characteristics of habitat environments (e.g., availability of food resources, competition with other species, interactions with predators, and diseases in natural ecosystems) with complex population characteristics (e.g., survival, reproduction, and movement). Carrying capacity refers to the maximum number of individuals that specific habitats can support when the growth rate of an individual becomes zero (McGinley, 2013).
HexSim ( https://www.hexsim.net/) is a robust software for spatially explicit and individual-based modeling. It facilitates the modeling of various species and ecosystems by simulating population dynamics, interactions, and responses to environmental changes. HexSim provides valuable insights into complex ecological processes by realistically representing ecological interactions. The flexibility of the program in model development and simulation enables researchers to make adjustments and explore different scenarios, aiding in the prediction of environmental impacts and informing decision-making in resource management (Schumaker & Brookes, 2018). HexSim is widely recognized and extensively utilized in the fields of ecology, resource management, and conservation biology because of its ability to accurately estimate population sizes by incorporating species characteristics and habitat conditions (Heinrichs et al., 2017; Huber et al., 2014; Schumaker & Brookes, 2018; Spencer et al., 2011).
Maximum Entropy model (MaxEnt) is a machine learning approach among the ecological niche models based on maximum entropy. It uses species occurrence data to predict geographic distribution and is well known for its high accuracy (Baldwin, 2009; Phillips & Dudík, 2008; Phillips et al., 2006). This model is widely employed in various fields as a presence-only method for species distribution modeling, and its utility has been extensively validated (Bosch et al., 2014; Kim et al., 2015; Lee et al., 2022; Peterson et al., 2007; Phillips & Dudík, 2008). Although MaxEnt and presence-only models have been criticized for their imprecise approximations (Brotons et al., 2004; Yackulic et al., 2013), MaxEnt stands out as the most unbiased model when working with presence-only data (Elith et al., 2011). Moreover, it provides robust inference even with limited information (Ward et al., 2009). Despite certain limitations such as spatial resolution dependence and sampling bias (Alsamadisi et al., 2020; Kramer-Schadt et al., 2013), MaxEnt modeling offers various benefits, including ease of use, compatibility with irregular samples, and tolerance for minor sampling errors (Kramer-Schadt et al., 2013; Morales et al., 2017). Therefore, we used MaxEnt to determine the habitat suitability of wild boars within the Bukhansan National Park using data on their occurrences and environmental variables (Phillips, 2017).
National parks prohibit the capture and hunting of wild boars under the Natural Parks Act. To mitigate crop damage and human-wildlife conflicts, national parks manage wild boar populations by installing fences and relocating captured boars. Estimating the optimal population size and predicting the geographical distribution within a park are crucial measures for effective population management.
This study aimed to assess the carrying capacity of wild boar populations in Bukhansan National Park by integrating population characteristics (survival, reproduction, and movement) and habitat suitability using HexSim. Habitat suitability was derived using the MaxEnt model to simulate dispersal, prospecting, and resource acquisition. To achieve this, we estimated the population size of wild boars based on the resource availability within their home ranges and compared the differences in population size.
Materials and Methods
Research methods
The environmental carrying capacity of wild boars in Bukhansan National Park was evaluated by integrating their spatial utilization and population characteristics. The spatial utilization characteristics of wild boars were determined by applying location data and habitat environmental variables to the MaxEnt model, resulting in habitat suitability scores. Population characteristics included age groups, reproductive and survival rates, dispersal, and movement. The appropriate population size of wild boars was estimated and compared based on the amount of resources within the wild boar home range (Fig. 1). The amount of resources was determined by summing the habitat suitability scores within the home range.
Study area
Bukhansan National Park is located in a city and was designated as the 15th National Park in Korea in 1983. It is distributed across 126.9347°-127.0511° East and 37.4314-37.7317° North. The park is 76.922 km2 in area, with the tallest peak at 836 m above sea level (Fig. 2). An average annual temperature of 18.0°C was recorded during a decade (2010-2019) and the annual average precipitation is 1,291.7 mm. The vegetation in Bukhansan National Park is dominated by Quercus mongolica–Pinus densifloracommunities (50.33%), followed by Q. mongolicacommunities (20.84%) and mixed forests (13.24%). Q. mongolicacommunities (1,665.19 ha) are regarded as climax vegetation and are dominant above 250 m above sea level. In addition, 2.23% proportion of national parks comprise plantations and agricultural fields adjacent to urban areas (Oh et al., 2008). The park is popular among hikers and Seoul residents, and has approximately six million annual visitors (6.08 million in 2016). The park and its surrounding areas are heavily utilized, including residential areas adjacent to military camps and Buddhist temples located within the park boundaries (National Park Research Institute [NPRI], 2019).
Wild boar has recently spread to the Seoul metropolitan area in Korea, which is home to approximately 25 million people (Lee et al., 2022). Until the early 2000s, wild boar sightings in Seoul were rare, and the species required protection (Seo & Park, 2000). However, wild boars were first spotted in Bukhansan National Park in 2004 (Korea National Park Service, 2004). Based on a survey of wild boars conducted in Mount Bukhansan National Park in 2019, the monthly average number of individuals decreased by 30% from 91.9 individuals in 2017 to 63.6 individuals in 2018. Additionally, the average density also decreased from 1.9 individuals per km2 to 1.4 individuals per km2 (NPRI, 2019). However, anthropogenic food resources, such as food waste from houses near Bukhansan National Park and temples within the park, have attracted wild boars to urban areas, causing crop damage and friction with local governments due to related civil complaints (NPRI, 2019).
Data
To estimate wild boar population size using the HexSim program, we used demographic data (e.g., survival and reproduction rates) from an existing study (Bieber & Ruf, 2005). Table 1 shows the mean litter size, proportion of females participating in reproduction, annual survival rate, and fertility under different environmental conditions (poor, intermediate, and good). In this study, we used the average values of these rates.
The locations of the wild boars used to assess habitat suitability were obtained from a study conducted in 2017 as part of the Bukhansan National Park Wild Boar Management Project (NPRI, 2017). Global positioning system (GPS) location data were collected using unmanned sensor cameras and tracking surveys. Twenty-nine unmanned sensor cameras were distributed across 22 locations where boar signs, including wallows, rubbing trees, and trails, were identified. Following the wildlife survey protocol of the NPRI (2017), biologists also identified additional boar signs (mostly feces, rubs, wallows, and footprints) and confirmed the locations for an additional 297 sign sites without unmanned sensor cameras. A total of 319 GPS location data points (22 camera trapping points and 297 field sign points) from wild boars were used in the MaxEnt model (Fig. 2).
Habitat environmental variables were prepared in a GIS format to calculate habitat suitability using the MaxEnt model (Table 2). We generated a 30 m×30 m digital elevation model (DEM) using GIS and the triangulated irregular network technique. The DEM was created using a digital topographic map downloaded from the National Spatial Data Infrastructure Map Service ( https://www.nsdi.go.kr/lxmap/index.do). Slope and aspect data were derived from the DEM. To assess accessibility from residential areas and farmland, we generated a map indicating the distances from these areas using Euclidean distance and a digital terrain map. Data on forest type and tree age were generated using a digital forest-type map from the National Forestry Information Service ( https://map.forest.go.kr/forest/). The digital forest-type map is a representative thematic map of forest distribution in South Korea, providing information on various attributes, such as forest type, tree age class, tree species, canopy density, stand volume, and elevation (Park et al., 2019). The age of trees was classified into six grades based on 10-year intervals using the average age of the forest stands. Forest types were classified into nine categories: coniferous, deciduous, mixed coniferous-deciduous, Pinus densiflora, Pinus koraiensis, Pinus rigida, Larix leptolepis, poplar, and oak forests. The GIS map data were generated using ArcGIS 10.7 software (ESRI, 2011).
Habitat suitability
Habitat suitability was used to evaluate the spatial utilization characteristics of wild boar populations. To calculate the habitat suitability of wild boars within Bukhansan National Park, we used MaxEnt version 3.4.4 (Phillips, 2017; Phillips et al., 2006) using 319 wild boar occurrences (Fig. 2) and eight environmental variables (Table 2).
Environmental variables were divided into natural and disturbed environments, and the former were further classified into topographic and forest environments. Natural environment factors included altitude above sea level (DEM), mountain slopes (slope), and slope direction (aspect), which are related to movement and hiding places. Forest environment factors included forest types and age classes of trees, which are related to feeding and hiding places. Disturbance factors include the distance from residential areas and farmlands, which are related to feeding and damage to humans (Morelle & Lejeune, 2015; NPRI, 2018; Rho, 2015; Seo & Park, 2000). We generated a random sample of 10,000 background points from environmental data (Elith et al., 2011; Phillips & Dudík, 2008), which were required by the MaxEnt method to mimic the absences or pseudo-absences of the species.
To prevent overfitting, which occurs when a model has high predictive accuracy on the training data but low predictive accuracy on the new data, we split the 319 location data points of wild boar populations into training data (75%) and verification data (25%). We then ran the model ten times (Radosavljevic & Anderson, 2014).
Performance of the MaxEnt model was estimated by calculating the area under the curve (AUC) of the receiver operating characteristic (ROC) curve. This is the preferred technique for evaluating models based on presence-only data (Stockwell & Peters, 1999). The ROC curve is a graphical plot of the true-positive rate (TPR) and false-positive rates (FPR). The TPR is the percentage of positive cases that were correctly identified, whereas the FPR is the percentage of negative cases that were incorrectly identified. The AUC is a measure of the overall performance of the model. An AUC value of 1.0 indicates a perfect model, whereas an AUC value of 0.5 indicates a random model. An AUC value between 0.5 and 0.7 indicates an inappropriate model, whereas an AUC value of 0.7 indicates a good model. An AUC value of 0.9 indicates an ideal model (Franklin, 2010).
The importance of the environmental variables was assessed using relative contributions and permutation importance (Phillips, 2017). The relative contributions in the MaxEnt model represent the degree of influence of each environmental variable on the habitat suitability for a species. They provide insights into the variables that play a significant role in shaping suitable habitats for the species (Phillips, 2017). By understanding these relative contributions, we can prioritize the important environmental factors for habitat suitability. Permutation importance is used to measure the importance of individual features in a predictive model. It assesses the effect of shuffling the values of a feature on the performance of the model. If shuffling the values of a feature leads to a significant decrease in the model’s accuracy or predictive power, this indicates that the feature is important for making accurate predictions. This method helps identify the most influential features in the model and understand their contributions to the overall performance (Phillips, 2017).
Carrying capacity model for wild boar populations
We used the HexSim program to assess the carrying capacity of the wild boar population in the Bukhansan National Park. The analysis was conducted based on the basic model provided by HexSim (Schumaker, 2015). In the HexSim program, reproduction and survival rates according to age class were used as population characteristics of wild boar populations, and home range size, individual independence, and movement distance for feeding were used as spatial-use characteristics.
The age class of the wild boar population was divided into three stages: juveniles (less than one-year-old), yearlings (1-2 years old), and adults (>2 years old). We utilized the data provided by Bieber and Ruf (2005) for the variables related to fertility and survival rates in our study. (Table 1).
In particular, the food resources required by wild boars vary depending on habitat quality, and the amount of resources available is an important factor that determines the size of the population (Kim et al., 2019; Singer et al., 1981). Therefore, the optimal number of wild boars in Bukhansan National Park was calculated and compared based on the amount of resources available according to the home range size. Resource amounts were calculated by summing the suitability scores within home range sizes, which were determined through a MCP analysis conducted in a previous study in 2017 (NPRI, 2017). The MCP is an internationally accepted standard method for estimating a species’ home range, particularly in circumstances in which presence-only data are the only type of spatially explicit data available (Burgman & Fox, 2003).
The population size was estimated by varying the amount of resources according to the MCP area. The minimum amount of resources was determined by summing the habitat suitability values extracted from the area corresponding to 50% of the MCP area. The average amount of resources was calculated by summing the suitability scores from the areas corresponding to 95% of the MCP. Finally, the maximum resource amount was determined by summing the suitability scores from 100% of the MCP area. These resource amounts were then used to estimate the population size of wild boars.
To assess the statistical differences in the number of wild boar individuals based on resource availability, we conducted a one-way analysis of variance (ANOVA). ANOVA is a statistical test used to determine significant differences between the means of three or more groups (Bevans, 2020).
Results
Mode performance and potential distribution of wild boar
The prediction accuracy of the model that estimated the habitat suitability of wild boar populations in Bukhansan National Park was as follows: the AUC values derived from training and test data were 0.880 (±0.011) and 0.902 (±0.020), respectively. The habitat suitability for wild boars ranged from 0 to 96.4%. The area where the habitat suitability of wild boars was less than 25% was 23.6 km2, the area with habitat suitability of 25-50% was 25.8 km2, the area with habitat suitability of 50-75% was 26.2 km2, and the area with habitat suitability of 75% or higher was 1.3 km2. Red areas shown in Fig. 3 are highly likely to be inhabited by wild boar.
Importance of environmental variables
The contributions of environmental variables were as follows: tree age (31.5%), forest type (20.7%), distance from residential areas (18.1%), distance from farmland (15.1%), digital elevation model (DEM) (7.3%), mountain slopes (4.1%), and slope direction (aspect) (3.2%). Table 3 provides estimates of the relative contributions and permutation importance of the environmental variables.
Response curves of wild boars to environmental variables
The responses of the species to changes in the selected variables are shown in Fig. 4. These plots reflect the dependence of prediction suitability on the selected variable. According to the response curve, areas where the tree age was between 10 and 20 years (age 2) or between 30 and 40 years (age 3) were found to be suitable habitats. Mixed forests were also found to be suitable habitat areas for wild boar. suitable areas were located at distances ranging from 277.9 to 1,226.1 m and 2,617 to 3,145 m from residential areas, respectively. suitable habitat areas were also identified at distances ranging from 5.6 to 156.0 m and 3,666.0 to 4,701.0 m from agricultural land. Additionally, areas with elevations between 119.2 and 317.2 m were identified as suitable habitats, whereas areas with slopes ranging from 6.5 to 17.3° were also found to be suitable habitat areas. With respect to aspect, suitable habitat areas were identified with orientations ranging from 2.2 to 8.3° (north-facing), 299.3° to 360° (northwest-facing), and 19.5° to 74.7° (northeast-facing).
Wild boar population size with the resource amount
Based on the resource amount within the home range size (MCP 50%, 95%, and 100%) of wild boar populations, we ran each simulation 100 times to estimate the population size and found changes in population size (Fig. 5). The resource amount was considered a result of summing habitat suitability scores within the home range size; the minimum resource amount of the calculated MCP 50% was 53.67, the average resource amount of MCP 95% was 76.61, and the maximum resource amount of MCP 100% was 1,353.63. The wild boar population estimated by the minimum resource amount corresponding to the home range size of MCP 50% was 217 individuals, the population size using the average resource amount corresponding to the home range size of MCP 95% was 225 individuals, and the number using the maximum resource amount corresponding to the home range size of MCP 100% was estimated to be 254 individuals (Fig. 5).
Analysis of variance based on resource amount within home range
We conducted a one-way ANOVA to compare the impacts of the three different resource amounts on wild boar population size. The results revealed that there was a statistically significant difference in the population average between the minimum, average, and maximum resource amounts (F (2, 300)=[10.95], P=2.56e-05). Tukey’s honestly significant difference (HSD) multiple comparison tests showed that the average value of the population size between the minimum and average resource amounts was significantly different (P=0.002, 95% confidence interval=[9.44, 49.40]); the average value of the population size between the minimum and maximum resource amounts was also significantly different (P<0.001, 95% confidence interval=[17.82, 57.78]). However, there was no statistically significant difference in average population size between the average and maximum resource amounts (P=0.585).
Discussion
The MaxEnt model yielded highly accurate predictions for the distribution of wild boars, with an AUC value over 0.85 and a standard deviation of 0.01. This indicates that the model effectively utilizes environmental variables to accurately predict the presence of wild boars (Franklin, 2010; Phillips & Dudík, 2008). This information can be considered useful for describing the spatial utilization characteristics that estimate the population size of wild boar. Although different environmental variables were used in this study, the predicted distribution was similar to the findings of previous studies on the distribution of wild boars (Lee et al., 2022). Wild boars are mainly found in areas around the Gugi Valley, Gucheon Valley, and Hyeongjebong Peak, which are located in the southern area of Bukhansan National Park and are close to residential areas and farmlands (Lee et al., 2022). Considering the high suitability of wild boars in residential and agricultural areas, it is important to take measures to prevent human-wildlife conflicts and mitigate the damage caused by wild boars to farmlands near forest boundaries, as these areas are more susceptible to farmland damage by wild boars (Lee et al., 2018b).
Among the factors influencing the habitat suitability for wild boars, tree age, representing the age of forests, was found to be the most important variable, followed by forest type, distance from residential areas, distance from farmland, DEM, slope, and aspect. In this study, the influences of natural and anthropogenic factors were relatively high (Lee et al., 2022). In particular, the age of trees and forest type were important variables influencing the suitability of wild boar habitat (Kim et al., 2019; Seo & Park, 2000).
Wild boars prefer low altitudes in northeastern South Korea (Seo & Park, 2000; Lee et al., 2022). However, wild boars used north-, northwest-, and northeast-facing slopes without any clear preference in Bukhansan National Park (Lee et al., 2022). The importance of tree age and forest type, which are environmental variables selected as food resources, was higher than that of other variables. According to previous studies, this is likely due to the fact that areas for reproduction of wild boars are mostly found in forests with old trees (Fernández-Llario, 2004); broadleaved forests and mixed forests with high forest density can provide high-calorie prey (e.g., insects) and safe shelter for juvenile wild boars (Meriggi & Sacchi, 2001).
Wild boars were mainly found in mixed forests (coniferous and broad-leaved forests) with trees aged 20 (10-20) and 40 years (30-40). Similarly, wild boars preferred lowlands with gentle slopes and low altitudes in forests with a mixture of old oak and pine trees (Kim et al., 2019). This indicates that it is easy to access food resources in these areas. Wild boars often inhabit mature broad-leaved forests and are frequently found near oak forests with sufficient food sources, such as acorns and other nuts (Kim et al., 2019; Sjarmidi et al., 1992). Wild boars mainly consume corn and chestnuts in nature as food resources, as well as a small amount of food waste from human-inhabited areas. This result shows the relationship of the species occurrence with the distance from residential areas (Lee & Lee, 2019).
The population size of wild boars in Bukhansan National Park was estimated by considering both population characteristics and habitat suitability. The findings showed a statistically significant decrease in the number of individuals as resource availability within the home range increased (Fig. 5). This can be attributed to the expansion of preferred habitat environments, such as oak forests, which provide stable food resources such as acorns (Kim et al., 2019). As a result, the size of home ranges for foraging by wild boars has increased (Singer et al., 1981). Consequently, a reduced population density within a limited park area can lead to a decrease in the number of wild boars (Massei et al., 1997). Additionally, competition among wild boars for food and space can contribute to a decrease in population size (Perlman, 2017).
This study linked population characteristics and habitat-usage features using the HexSim program to evaluate the carrying capacity of wild boar populations in Bukhansan National Park. Population characteristics, such as survival, reproduction, and movement were considered in this study. Habitat use features were derived using the MaxEnt model.
Among the factors influencing habitat suitability for wild boar populations, environmental variables related to food resources (tree age and forest type) were found to be relatively more important than other environmental variables. The analysis of the impact of resource availability on population size based on the home range size of wild boar populations revealed that there was a statistically significant difference in the population size in line with the resource amount. Through a multiple comparison test, we found a statistically significant difference between the population size estimated by the minimum resource amount and that estimated by the average and maximum resource amounts. However, there was no statistically significant difference between the population sizes estimated using the average and maximum resource amounts. Population size tended to decrease as the amount of resources required for wild boar populations increased. Based on the resource amount, the optimal wild boar population size in Bukhansan National Park was estimated to be between 217 and 254 individuals, and the appropriate size based on the average resource amount was estimated to be 225 individuals. This information can be useful for effective management of the species in the park.
Figures and Tables
Fig. 1
A schematic of the process of evaluating the environmental carrying capacity of wild boar. MaxEnt, Maximum Entropy model.
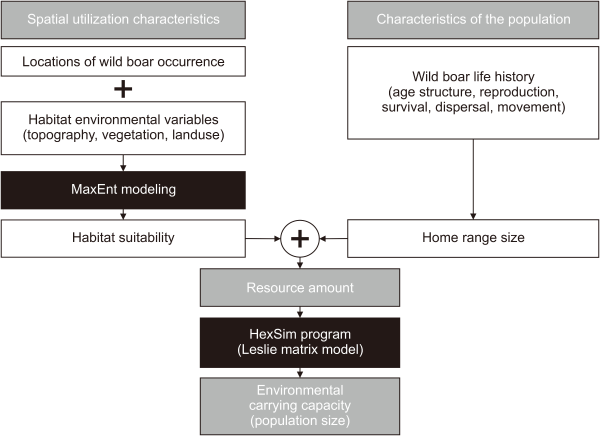
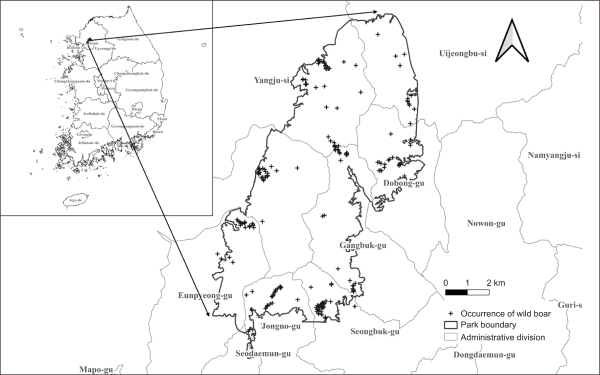
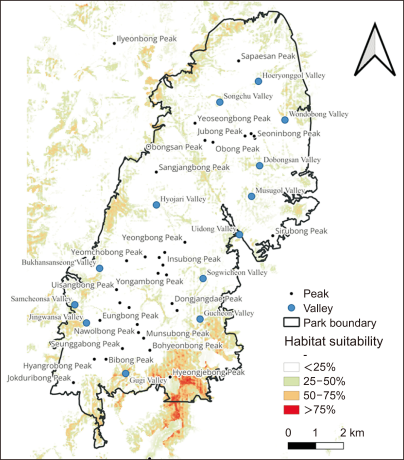
Fig. 4
Response curves of the environmental variables. (A) Response of wild boar to tree age. age 1, 1 to 10 years old; age 2, 11 to 20 years old; age 3, 21 to 30 years old; age 4, 31 to 40 years old; age 5, 41 to 50 years old; age 6, 51 years old and above. (B) Response of Wild boar to forest types. C, coniferous forest; D, pinus densiflora forest, H, deciduous forest; M, mixed coniferous-deciduous forest; Ca, castanea crenata forest; Po, poplar forest; PK, pinus koraiensis forest; PL, Larix leptolepis forest; PR, pinus rigida forest. (C) Response of wild boar to distance from farmland (measured in meters). (D) Response of wild boar to distance from residential areas (measured in meters).
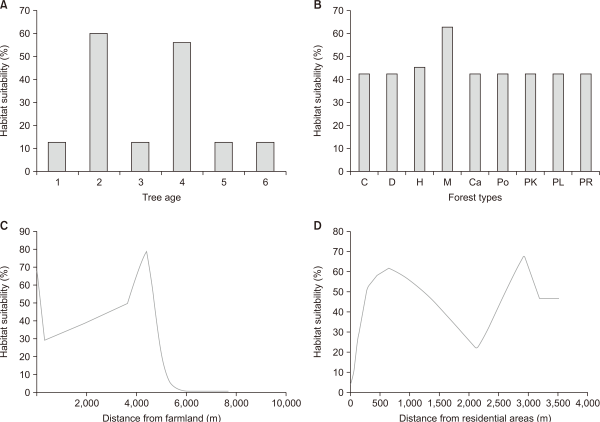
Fig. 5
The population size changes with the amount of resources. (A) Changes in population size based on minimum resource amount. (B) Changes in population size based on mean resource amount. (C) Changes in population size based on maximum resource amount.
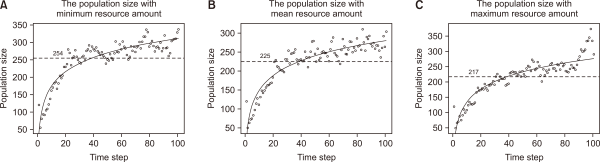
Table 1
Mean litter size, proportion of females participating in reproduction, yearly survival rates, and fertilities under different environmental conditions
| Stage class | Mean litter size | Proportion reproduction | Survival rates | Fertility | |
|---|---|---|---|---|---|
| Poor | Juvenile | 3.5 | 0.3 | 0.25 | 0.13 |
| Yearling | 4.5 | 0.8 | 0.31 | 0.56 | |
| Adult | 6.3 | 0.9 | 0.58 | 1.64 | |
| Intermediate | Juvenile | 4 | 0.4 | 0.33 | 0.26 |
| Yearling | 5.5 | 0.85 | 0.4 | 0.94 | |
| Adult | 6.5 | 0.9 | 0.66 | 1.93 | |
| Good | Juvenile | 4.5 | 0.5 | 0.52 | 0.59 |
| Yearling | 6.5 | 0.5 | 0.6 | 1.76 | |
| Adult | 6.8 | 0.5 | 0.71 | 2.29 | |
Table 2
Environmental variables for MaxEnt modelling
| Factor types | Factors | Use of factors | Data type | Mean±SD | |
|---|---|---|---|---|---|
| Natural environment | Topographic environment | DEM | Movement/hiding places | Continuous | 291.5±146.1 m |
| Slope | Continuous | 19.2±8.4° | |||
| Aspect | Continuous | 179.2±105.5° | |||
| Forest environment | Tree age | Feeding/hiding places | Categorical | - | |
| Forest type | Categorical | - | |||
| Disturbed environment | Anthropogenic environment | Distances from residential areas | Damage to human | Continuous | 1,249.3±780.6 m |
| Distances from farmland | Damage to human/feeding | Continuous | 1,319.2±987.1 m | ||
Table 3
The relative contribution and permutation importance of environmental variables to the MaxEnt model
| Variables | Percent contribution | Permutation importance |
|---|---|---|
| Tree age | 31.5 | 2.3 |
| Forest type | 20.7 | 2.4 |
| Distances from residential areas | 18.1 | 39.2 |
| Distances from farmland | 15.2 | 23.7 |
| DEM | 7.3 | 20.4 |
| Mountain slope | 4.1 | 8.7 |
| Slope direction (aspect) | 3.2 | 3.2 |