Introduction
Fragmentation of habitat, the continuous division of habitats into smaller and isolated patches, is a consequence of anthropogenic activities such as urbanization, agriculture, and infrastructure development (Onyenwe et al., 2017). This phenomenon is known to disrupt the interconnectedness of ecosystems, leading to habitat loss, reduced habitat quality, and altered species distributions (Crain et al., 2009). Fragmentation often results in isolated populations, reduced gene flow, and increased vulnerability to environmental changes, posing a threat to biodiversity and ecosystem functioning. Tropical regions are known for their extraordinary biodiversity, housing a substantial portion of the world’s species.
Complex ecosystems and intricate interdependencies among species characterize these tropical regions.
However, human activities including deforestation, land conversion, and habitat fragmentation are increasingly threatening tropical ecosystems (Mahmoud et al., 2020). Even minor changes can disrupt the delicate balance that sustains these diverse ecosystems, potentially triggering cascading effects. In West Africa, Nigeria features various ecosystems, ranging from rainforests and savannahs to wetlands and mangroves. These diverse habitats support the country’s rich biodiversity. However, rapid urbanization, agricultural expansion, and industrial development are causing habitat fragmentation and degradation, putting local species and ecosystems at risk (Bodo et al., 2021). Although flying insects and plants play integral roles in maintaining ecosystem structure and function, impacts of habitat fragmentation on them have been understudied.
This study aimed to examine and analyze species diversity, relative abundance, and decline of flying insects in a fragmented forest in FUTA Akure, Ondo State, Nigeria. Drivers of decline in flying insects, plant species diversity, and relative abundance were identified by reviewing existing literature, analyzing relevant data, and investigating how changes in land use could affect the diversity and abundance of flying insects and plants by analyzing data from different land use types and regions.
Species diversity, relative abundance, and decline of flying insects
Flying insects play a crucial role in maintaining ecosystem health and biodiversity. They are responsible for pollinating plants, controlling pest populations, and serving as food sources for many animals. However, recent studies have shown a significant decline in flying insect populations, causing concerns for both ecological and agricultural systems. Flying insects play a strategic role in agriculture through pollination of crops and control of pest populations. Pollination by insects is estimated to contribute to about 35% of global crop production (Klein et al., 2007). Similarly, natural pest control by insects saves billions of dollars in crop losses and reduces the need for synthetic pesticides that harm the environment and human health.
Species diversity reflects species variety within a particular ecosystem. It is essential to maintaining ecological balance as it ensures that the ecosystem can withstand environmental changes and provide resilience against disturbances. Similarly, relative abundance refers to the proportion of each species in an ecosystem. It is a crucial metric for understanding ecological balance and the role of each species in the ecosystem.
There has been a significant decline in flying insect populations worldwide in recent years. A study conducted in Germany found that flying insect populations declined by 76% over 27 years (Hallmann et al., 2017). Similarly, a global review of insect decline has found that 41% of insect species are threatened (Sánchez-Bayo et al., 2019). The decline of flying insects is attributed to loss of habitat, pesticide use, climate change, and pollution.
The decline of flying insects could significantly reduce crop yields and increase the use of synthetic pesticides known to harm the environment and human health. This poses several challenges in agriculture, such as reduced crop yields, increased use of synthetic pesticides, and increased production cost for farmers. It could also reduce the quality and variety of food available, which could have long-term effects on human health. Moreover, the loss of flying insects could disrupt the food web, which could have cascading effects on other species in the ecosystem.
MATERIALS AND METHODS
Site/Location
The Federal University of Technology Akure (FUTA) is a university founded in 1981 that occupies 640 hectares of land. FUTA is in Akure, the capital city of Ondo State, Southwest Nigeria. It lies between latitude 7°5′0″ and 7°20′0″ north of the equator and between longitude 5°5′0″ and 5°20′0″ east of the meridian. Through collaboration with the Department of Remote Sensing of FUTA, land satellite maps of the area (Fig. 1., Fig. 2.) occupied by FUTA were taken using the Geographical Information System (GIS). The land occupied by the university was an agro-forested area with minimum disturbance in 1984. FUTA Akure is characterized by a mix of urbanized and semi-urbanized landscapes, with the remaining forest patches serving as vital remnants of once-contiguous habitats.
Sampling Design
Randomly selected three mapped-out squared areas of 4046.48 m2 of land using transect were taken from three locations. These areas were classified according to the extent of land fragmentation. The land satellite map in 1984 was considered the original undisturbed agroforest area inherited almost 40 years ago, while the Landsat of 2015 showed that some areas were completely deforested and replaced with buildings. It is what is currently being used in this study. Based on this, the following three locations were referenced for this sampling:
Location 1: Forested areas covering the extreme northern side of the area. They have various plants, mango, cashew, oranges, palm trees, cassava, cocoa, and wild forest plants. These areas cover Obanla, a natural forest, and an undisturbed agro-forested area.
Location 2: Cultivated areas covering the university farmland. These areas are mono-cropped with cassava, maize, and a few wild forest plants. They cover the West side and Agricultural cultivated area.
Location 3: The developed area covering the southern part of the university. There are many buildings and roads. Dispersed forest areas are sighted. This area has ornamental plants and a few wild forest plants. It covers Obakekere, a disturbed area shown in the Landsat map of 2015 large-scale development and constructed areas.
Sampling of Insects in the Area
Flying insects were collected from locations by implementing a range of trapping techniques within a radius of three kilometers. Malaise traps were deployed at each study site to capture various flying insects. Sweep netting and light trapping were employed to capture diurnal and nocturnal species, respectively. Sampling was conducted over a defined period to ensure temporal consistency. Insect species captured were counted. The number was taken as a statistical representative of familiar flying insect visitors to plants. All insects sampled were killed and preserved in jars of 75% ethanol and brought to the Entomology Laboratory of the University for identification.
Plant sampling
Surrounding vegetation within a three-kilometer radius of the identified locations was sampled. To sample plants, leaves, flowers, fruits, or other parts were plucked. All plants sampled were pressed and brought to the University Herbarium for identification. These plants, in terms of numbers seen, had a range of frequencies, including high constancy, low constancy, rare and absent.
Identification of insects and plants
Collected flying insects and plant specimens were brought to the laboratory for taxonomic identification. Experts at order, family, and genus levels successfully identified insect specimens. An expert entomologist utilized a catalog to perform identification of the insect specimens. Any specimens that could not undergo identification were classified as unidentified. Expert botanists identified plant specimens at family and genus levels.
Data Analysis
Diversity of flying insects was analyzed by looking at the number of species present using methods such as the Shannon-Wiener diversity index and Simpson’s diversity index. To understand how common each species was, we counted the number of individuals in each species. We also used methods such as ANOVA and Pearson correlation analysis to investigate relationships between species diversity, relative abundance, and characteristics of habitat patches.
RESULTS
Insects species diversity and abundance
Flying insect species diversity analysis revealed significant variations among sampled fragmented forest patches (Table 1). A total of 2,214 insects were captured during sampling of the three locations. Location 1 characterized as a natural forest and an undisturbed agro-forested area resembling the Landsat map 1984 had the highest number of insects captured at 1,540. This finding shows the importance of preserving natural habitats for insect biodiversity.
Conversely, a noticeable trend of decreasing diversity was observed in smaller and more isolated patches, which could be attributed to increased human activity and habitat fragmentation around the other two locations. Location 2 recorded the second-highest abundance of insect species with 475 captures. This indicates that it still supports a relatively diverse insect community.
In contrast, location 3, a developed area covering the southern part of the university, exhibited the lowest insect abundance, with only 199 insects collected. This decline in abundance of insect species in the developed area highlights the negative impact of urbanization and human infrastructure development on insect populations.
Notably, species, especially common pollinators, demonstrated a significant reduction in abundance in more developed areas, emphasizing the importance of preserving natural and less disturbed habitats for these crucial ecosystem service providers (Cusser et al., 2016). This study’s results aligned with previous research emphasizing the link of habitat disturbance with insect species diversity and abundance (Debinski et al., 2000).
Plant species diversity and abundance
Plant species diversity in this study exhibited patterns that mirrored those observed for flying insects. More significant and less isolated locations consistently displayed higher Shannon-Wiener diversity index values for plant species, suggesting a positive correlation between location size and plant diversity (Sax, 2002). This finding shows the importance of preserving more significant and less disturbed habitats for maintaining plant diversity.
To further explore the relationship between plants and insects, we organized plant samples based on two criteria: the frequency of insects found on them and their taxonomic order. We categorized these plants as occasional, rare, high constancy, and low constancy. This categorization can identify critical plant species that play crucial ecological roles in providing insect resources (Lundberg et al., 2003)
This study revealed that certain plant species known for their ecological significance in supporting insect populations were less abundant in developed forest fragments (Laurance et al., 2002). This underscores the negative impact of habitat fragmentation and urbanization on the availability of essential insect resources, highlighting the need for conservation efforts to protect these critical plant species.
Frequency distribution and relative abundance of insect species
Analysis of the frequency of distribution and relative abundance (Table 2) revealed noteworthy variations in species distribution within fragmented forests and developed patches, aligning with previous research findings (Matlack, 1993). Commonly encountered species were consistently more abundant in larger patches with better connectivity, emphasizing the importance of preserving and restoring habitat connectivity to maintain population sizes of these species (Lepczyk et al., 2017).
Interestingly, less common species exhibited diverse trends, with some displaying higher relative abundance in more isolated patches, suggesting potential niche differentiation and niche specialization of certain insect species (Grevé et al., 2019). This phenomenon highlights the complexity of species interactions and the role of microhabitats within fragmented landscapes.
Findings indicated that Diptera, Lepidoptera, and Odonata were the most abundant insect orders in studied areas, consistent with global patterns of insect diversity (Jacobsen et al., 1997). Notably, location 1 had the highest total insect collection, with 1,540 insects, followed by locations 2 and 3, with 475 and 199 insects, respectively. This distribution of insect abundance might be attributed to differences in habitat quality and fragmentation levels among locations (Wettstein et al., 1999)
Regarding relative abundance, Diptera dominated the insect community, accounting for 54.15% of total relative abundance, followed by Hymenoptera at 23.21% and Lepidoptera at 11.25%. These proportions aligned with global trends of insect order composition (Fukami et al., 2005), providing valuable insights into ecological dynamics of studied ecosystems.
Pearson Correlation analysis for insects collected in the selected habitat
As indicated by Pearson correlation analysis, results underscored positive correlations between flying insect diversity and different locations within the fragmented forest landscape. This finding aligned with prior research emphasizing the interdependence of insect diversity and habitat characteristics (Donald et al., 2022).
While it was observed that higher plant diversity appeared to support more diverse flying insect communities, particularly in location 1, the abundance of insects in each location provided additional insights into habitats under examination.
This relationship between plant diversity and insect diversity has been documented in previous studies, highlighting the importance of floral resources for insect communities (Fründ et al., 2010).
Significantly, the strength of the correlation varied among patches, with larger patches demonstrating a stronger positive relationship between flying insect diversity and location. This variation in correlation strength justifies the importance of habitat size and connectivity in shaping insect communities within fragmented landscapes (Anderson et al., 2017; Brown & Davis, 2020).
Specifically, locations 2 and 3 exhibited a less positive correlation with location 1, with correlation coefficients ranging from 0.4 to 1 (Table 3). This observation suggests that while more significant, connected patches tend to support a more diverse array of flying insects, local factors and habitat characteristics unique to each location can influence the relationship between plant diversity and insect diversity.
These findings contribute to our understanding of complex interactions between habitat features, plant diversity, and flying insect diversity in fragmented landscapes, emphasizing the need for tailored conservation strategies that consider both landscape-scale and local factors.
Diversity indices of insect species recovered from selected habitat in FUTA
Species diversity was analyzed using Shannon index to provide insights into ecological characteristics of sampled locations (Stevens et al., 2002). Location 1 demonstrated the highest Shannon index value, with a score of 2.95, indicating a higher level of species diversity than other locations. This result aligned with previous studies emphasizing the importance of natural and less disturbed habitats in maintaining species diversity (Roberts et al., 1995).
Location 2 also displayed a relatively high Shannon index of 2.94, signifying diverse insect and plant communities (Table 4). This finding suggests that even in fragmented landscapes, specific larger patches or less isolated areas can support diverse species assemblages (Lindenmayer et al., 2002). In contrast, Location 3 showed a notably lower Shannon index of 1.53, indicating a reduced species diversity in this developed area. This observation underscores urbanization’s negative impact on species diversity and habitat fragmentation (Vandergast et al., 2007).
Assessment of evenness for measuring equitable distribution of species revealed that Location 2 had the highest evenness value of 0.47. This value indicates a relatively balanced species distribution within the community where no single species dominates. In contrast, Location 3 exhibited the lowest evenness of 0.29, implying a skewed distribution of species possibly due to dominance of a few species (Crowder et al., 2010).
Simpson index evaluation further elucidated the locations’ ecological dynamics. Locations 1 and 2 exhibited higher Simpson index values (8.9 and 8.19, respectively), suggesting a more even distribution of dominance among species. In these locations, no single species overwhelmingly dominated the community. Conversely, Location 3 displayed a lower Simpson index of 3.48, indicating a higher dominance of certain species and lower species rarity. This could indicate a simplified and less diverse ecosystem in Location 3. These results highlight the importance of considering multiple diversity indices to comprehensively understand the ecological status and conservation priorities within fragmented landscapes.
ANOVA table for comparing variations of insect species in sampled area
The P-value of 0.153 obtained from our analysis of variance, which assessed whether there were significant differences in the number of insects collected from different locations, was found to be greater than the significance level of 0.05 (Table 5), which supported the null hypothesis, indicating no statistically significant difference among insects collected from various locations (Jonsell et al., 2002). Although differences observed in previous results regarding species diversity and abundance might not be statistically significant, they are ecologically meaningful, highlighting essential trends in the data. These findings underscore the importance of implementing conservation strategies that prioritize preservation of more significant, contiguous forest habitats (Wintle et al., 2019). Such strategies may include efforts to enhance habitat connectivity, promote reforestation, and establish protected corridors for wildlife movement, all of which can contribute to the conservation of biodiversity in fragmented landscapes (Resasco et al., 2017).
Furthermore, our results emphasize the critical role of safeguarding plant species that are resources for flying insects. Preserving these plant species is essential not only for the maintenance of insect diversity, but also for ensuring continuity of vital ecological services, such as pollination which supports agricultural and ecosystem stability (Gill et al., 2016).
In summary, while our statistical analysis did not identify significant differences in insect collections among locations, ecological implications of the observed patterns highlight the need for proactive conservation measures to protect and restore habitats for the benefit of both insects and ecosystems they inhabit.
DISCUSSION
This research investigated species diversity, relative abundance, and a decline of flying insects in a fragmented forest ecosystem in FUTA Akure, Ondo State, Nigeria. This study aimed to assess the distribution and abundance of flying insects across three distinct sampled locations within the forest. A comprehensive analysis was conducted, revealing 10 distinct orders of insects. Notably, orders Diptera, Lepidoptera, and Odonata exhibited the highest relative abundance. This research collected 2,214 insects across sample locations, with location 1 having the highest number of insects collected as seen in Table 1.
Species diversity and abundance play pivotal roles in maintaining ecological balance of ecosystems. Flying insects are integral to these ecosystems, contributing to pollination, nutrient cycling, and other vital ecological processes. The dominance of Diptera, Lepidoptera, and Odonata among flying insects highlights their adaptability to the fragmented forest environment. These orders can exploit various niches within ecosystems, enabling them to thrive in changing landscapes. The observed decline in species abundance from location 1 to locations 2 and 3 suggests potential variations in habitat quality or resource availability. The significant number of insects collected emphasizes the importance of preserving and restoring fragmented forest habitats to support diverse insect communities.
Variations in Shannon index, evenness, and Simpson index values across sample locations signify distinct ecological patterns. Location 1 demonstrated higher species diversity and evenness, indicating a healthier and more balanced ecosystem. Location 2 also exhibited positive attributes, with relatively high values across all three indices. However, Location 3 showed significantly lower values, indicating reduced species diversity, uneven distribution, and potential dominance by certain species.
The present study investigated species diversity, relative abundance, and ecological dynamics of flying insects. Analysis revealed intriguing insights into distribution patterns and ecological roles of various insect orders across different sample locations. Specifically, orders Diptera, Lepidoptera, and Odonata emerged as the most abundant, raising questions about factors influencing their prevalence and potential implications for ecosystem health and stability.
The finding that Diptera, Lepidoptera, and Odonata were the most abundant insect orders in the fragmented forest ecosystem underscoring their adaptability and ecological significance. Dipterans, commonly known as true flies, accounted for 54.15% of all collected insects, showing a relative high abundance. The abundance of dipterans can be attributed to their diverse ecological roles, including pollination, decomposition, and predator-prey interactions. Their ability to exploit various resources and habitats contribute to their success in fragmented landscapes. This result supported a study of Naman et al. (2019) showing that the order Odonata was the most dominant order with a relative abundance of (22.92%), followed by Lepidoptera and Hymenoptera.
Hymenoptera, another prominent order, showed a relative abundance of 23.21%. This order includes bees, wasps, and ants known to play crucial roles in pollination, pest control, and nutrient cycling. The relatively high abundance of Hymenoptera further emphasizes their importance in maintaining the ecological balance within the fragmented forest ecosystem.
Lepidoptera consisting of butterflies and moths had a relative abundance of 11.25%. Despite their relatively lower abundance, lepidopterans are vital pollinators and indicators of ecosystem health. Their sensitivity to environmental changes and dependence on specific host plants highlight their role in monitoring conditions of the fragmented forest and potential impacts of habitat alterations.
Variations in total insect collections among the three sample locations offer valuable insights into habitat preferences and potential ecological stressors. Location 1 had the highest total collection of 1540 insects, indicating its favorable conditions for insect populations likely driven by suitable habitat structures, resource availability, and microclimatic factors. In contrast, lower collections from locations 2 and 3 (475 and 199 insects, respectively) might reflect differences in habitat quality or fragmentation effects. John et al. (2022) have asserted that land use is a significant constraint to population of insect species. Conversion of existing natural forest ecosystem to other land use types has become a menace that requires urgent attention due to its effects on populations of plant and animal species. This is due to many factors, such as land-use changes, deforestation, pollution, and intensive agriculture, among others, which have been reported to contribute to the decline in the population of insect species.
The observed dominance of dipterans in all locations could be attributed to their adaptability to diverse environmental conditions and resource availability. The presence of dipterans as the most abundant order in all locations suggests their resilience to habitat fragmentation and disturbance and their ability to exploit various ecological niches.
The p-value was 0.153 from ANOVA. At the chosen significance level of 0.05, there was no statistically significant difference in the number of insects collected from different sample locations. However, it is essential to consider the broader context including sample size and research objectives before drawing definitive conclusions about the significance or lack thereof. Further investigation and analysis, such as post-hoc tests or additional variables, could provide deeper insights into the patterns observed for insect collections in various locations. This finding corroborates with Adelusi et al. (2018) who researched the subject of diversity and abundance of insect species in Makurdi, Benue State, Nigeria. Their results showed that there was no significant difference in the diversity of insect species between sites of (F (4, 50) = 0.000375, P > 0.05). However, GYV had the highest diversity index and species richness (d) with the lowest dominance index, while APH had the lowest species richness but the highest dominance.
The strength of a positive correlation was found to vary among patches, with larger patches exhibiting a more pronounced relationship. This suggests that larger, less fragmented areas within a forest can provide more stable and diverse habitats for flying insects and plants. Weaker positive correlations observed in locations 2 and 3 than in location 1, further emphasizing effects of habitat quality and fragmentation on insect diversity. Correlation coefficients ranged from 0.4 to 1, indicating moderate to strong positive relationships. This suggests that as the diversity of flying insects increases in location 1, there is a corresponding increase in the diversity of insects in locations 2 and 3.
Conclusions
This comprehensive investigation into flying insect diversity and relative abundance within a fragmented ecosystem provided valuable insights into the complex interplay between ecological factors. Results underscore the significance of considering multiple variables to comprehend intricate relationships that shape ecosystem dynamics and guide conservation efforts. Diptera, Lepidoptera, and Odonata were found to be the most abundant insect orders, highlighting their adaptability to the fragmented forest environment. These orders are crucial for pollination, nutrient cycling, and ecosystem stability. Positive correlations between flying insect diversity and different locations underscore the importance of landscape connectivity and preservation of habitats for maintaining diverse insect communities.
The relationship between higher plant diversity and increased flying insect diversity, particularly in location 1, emphasizes roles of resource availability and habitat quality in supporting varied insect communities. However, differences in insect abundance among locations suggest that habitat characteristics beyond plant diversity, such as microclimate and structural features, can influence insect populations. Varying strengths of correlations among patches, with larger patches displaying stronger relationships, emphasize the significance of habitat size and integrity in sustaining biodiversity.
Suggestions
Efforts should focus on restoring and maintaining connectivity between habitat patches within the fragmented forest. Promoting a corridor establishment and enhancing landscape connectivity can facilitate the movement of flying insects and enhance their gene flow, contributing to genetic diversity and population resilience.
Likewise, given stronger correlations observed in larger patches, conservation strategies should prioritize the protection of larger habitat patches. These areas provide more stable and diverse habitats for flying insects and plants, supporting robust ecosystem dynamics. While the positive correlation between plant and insect diversity is evident, maintaining and enhancing plant diversity remains essential for ensuring a consistent and diverse resource base for flying insects. Incorporating native plant species into restoration efforts can enhance resources. Acknowledging influence of microclimate and structural characteristics of insect abundance, implementing microhabitat management practices, such as maintaining diverse vegetation structures and reducing habitat disturbances, can foster optimal conditions for flying insects.
Findings of this study emphasize the importance of holistic approaches to conservation, addressing both landscape-level connectivity and fine-scale habitat characteristics. By implementing suggested strategies and fostering collaboration among researchers, policymakers, and stakeholders, we can contribute to the preservation of diverse insect communities and the overall health of fragmented forest ecosystems.
Figures and Tables
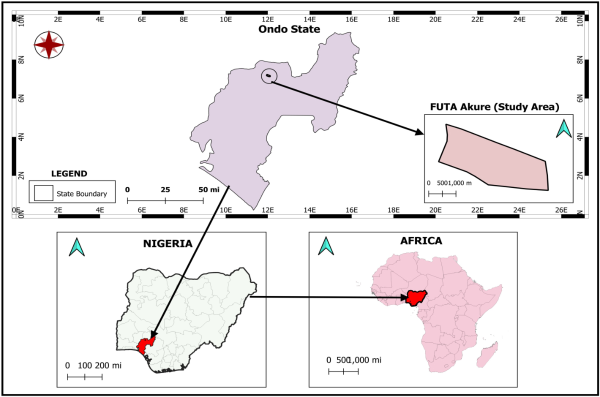
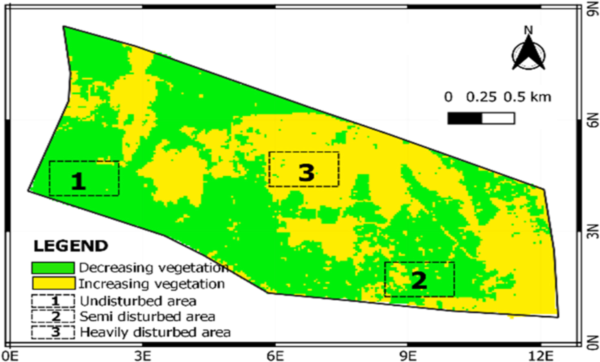
Table 1
Insect species diversity and abundance within FUTA, Main Campus, Akure.
| S/N | ORDERS | FAMILY | Species name | Location1 | Location2 | Location3 |
|---|---|---|---|---|---|---|
| 1 | DIPTERA | Culicidae | Anophelis gambiens | 287 | 57 | 21 |
| 2 | DIPTERA | Muscidae | Musca domestica | 342 | 79 | 87 |
| 3 | DIPTERA | Tephritidae | Ceratitis cosyra | 2 | 3 | 0 |
| 4 | DIPTERA | Tephritidae | Ceratitis capitata | 35 | 2 | 0 |
| 5 | DIPTERA | Tephritidae | Ceratitis penicillata | 25 | 4 | 0 |
| 6 | DIPTERA | Tephritidae | Ceratitis fasciventris | 2 | 0 | 0 |
| 7 | DIPTERA | Tephritidae | Ceratitis anonae | 0 | 5 | 0 |
| 8 | DIPTERA | Tephritidae | Trirhithrum nigerimum | 18 | 0 | 0 |
| 9 | DIPTERA | Tephritidae | Perilampsis woodi | 12 | 2 | 0 |
| 10 | DIPTERA | Tephritidae | C. vertebracus | 21 | 5 | 0 |
| 11 | DIPTERA | Tephritidae | C. dititssima | 32 | 3 | 0 |
| 12 | DIPTERA | Tephritidae | Bactocera cucurbitae | 17 | 7 | 0 |
| 13 | DIPTERA | Drosophilidae | Drozophila melanogaster | 11 | 4 | 56 |
| 14 | DIPTERA | Oceanthidae | Oecanthus pellucens | 14 | 7 | 0 |
| 15 | DIPTERA | Oceanthidae | Dacus bivitattus | 19 | 9 | 0 |
| 16 | DIPTERA | Oceanthidae | Dacus ciliatus | 0 | 7 | 0 |
| 17 | DIPTERA | Oceanthidae | Oecanthus pellucens | 0 | 4 | 0 |
| 18 | HYMENOPTERA | Tenthredinidae | Athalia rosae | 24 | 8 | 0 |
| 19 | HYMENOPTERA | Tenthredinidae | Caliroa cerasea | 22 | 12 | 0 |
| 20 | HYMENOPTERA | Ichneumonidae | Pimpler instigator | 8 | 4 | 0 |
| 21 | HYMENOPTERA | Vespidae | Polistes nimpha | 12 | 5 | 0 |
| 22 | HYMENOPTERA | Sphecidae | Ammophila sabulose | 15 | 6 | 0 |
| 23 | HYMENOPTERA | Sphecidae | Sceliphron destillatorium | 10 | 4 | 0 |
| 24 | HYMENOPTERA | Apoidae | Apis mellifera adansoni | 234 | 132 | 18 |
| 25 | ORTHOPTERA(ENSIFERA) | Tettigoniidae | Tetigonia viridisima | 5 | 1 | 6 |
| 26 | LEPIDOPTERA | Pieridae | Coliae croceus | 16 | 7 | 1 |
| 27 | LEPIDOPTERA | Pieridae | Pontai deplidice | 9 | 3 | 3 |
| 28 | LEPIDOPTERA | Pieridae | Gonepteryx rhanni | 8 | 4 | 0 |
| 29 | LEPIDOPTERA | Pieridae | Hesperia comma | 3 | 1 | 0 |
| 30 | LEPIDOPTERA | Pieridae | Pieris brassicae | 3 | 0 | 0 |
| 31 | LEPIDOPTERA | Pieridae | Pieris napi | 2 | 2 | 0 |
| 32 | LEPIDOPTERA | Pieridae | Leptidae sinapis | 4 | 2 | 0 |
| 33 | LEPIDOPTERA | Pieridae | Colias palaeno | 29 | 0 | 0 |
| 34 | LEPIDOPTERA | Danaidae | Danaus plexipus | 4 | 5 | 1 |
| 35 | LEPIDOPTERA | Nymphalidae | Neptis rivularis | 0 | 2 | 3 |
| 36 | LEPIDOPTERA | Nymphalidae | Limentis populae | 38 | 0 | 0 |
| 37 | LEPIDOPTERA | Nymphalidae | Limentis camilla | 26 | 0 | 0 |
| 38 | LEPIDOPTERA | Satyridae | Hipparchia fagi | 16 | 5 | 1 |
| 39 | LEPIDOPTERA | Satyridae | Minois dryas | 10 | 2 | 0 |
| 40 | LEPIDOPTERA | Satyridae | Lasiomata maera | 9 | 2 | 0 |
| 41 | LEPIDOPTERA | Satyridae | Chasara briseis | 10 | 0 | 0 |
| 42 | LEPIDOPTERA | Lycaenidae | Philotes baton | 8 | 3 | 0 |
| 43 | LEPIDOPTERA | Saturniidae | Saturnia pyri | 3 | 4 | 0 |
| 44 | EPHEMENOPTERA | Baetidae | Sympetrum sauguineum | 14 | 0 | 0 |
| 45 | EPHEMENOPTERA | Baetidae | Sympetrum flaveolum | 11 | 0 | 0 |
| 46 | ORTHOPTERA(CAELIFERA) | Tetrigidae | Tetrix subulata | 12 | 3 | 0 |
| 47 | MANTODEA | Agriidae | Mantis religiosa | 38 | 3 | 2 |
| 48 | ODONATA | Agridae | Agrion splendes | 8 | 5 | 0 |
| 49 | ODONATA | Agridae | Platycnentis pennipes | 5 | 2 | 0 |
| 50 | ODONATA | Coenagrionidae | Pyrrhosoma nymphula | 2 | 3 | 0 |
| 51 | ODONATA | Aeschnidae | Aeschna juncea | 3 | 1 | 0 |
| 52 | ODONATA | Aeschnidae | Anax imperator | 4 | 2 | 0 |
| 53 | ODONATA | Gonophidae | Gonophus vulgatissimus | 2 | 2 | 0 |
| 54 | ODONATA | Libellulidae | Sympetrum sanguinetum | 1 | 4 | 0 |
| 55 | ODONATA | Lestidae | Agrian splendeus | 1 | 5 | 0 |
| 56 | ODONATA | Lestidae | Lestes viridis | 7 | 3 | 0 |
| 57 | ODONATA | Perlidae | Perla bipunctata | 6 | 2 | 0 |
| 58 | HETEROPTERA | Pentatomidae | Palonema viridissima | 4 | 6 | 0 |
| 59 | HETEROPTERA | Pentatomidae | Pentatoma rufipes | 5 | 5 | 0 |
| 60 | HETEROPTERA | Pentatomidae | Graphosoma lineatum | 3 | 2 | 0 |
| 61 | HETEROPTERA | Reduvidae | Rhinocoris iracundus | 4 | 2 | 0 |
| 62 | HETEROPTERA | Anthocoridae | Anthocoris nemorum | 5 | 2 | 0 |
| 63 | HETEROPTERA | Miridae | Phytocoris tiliae | 14 | 2 | 0 |
| 64 | COLEOPTERA | Curculionidae | Balanogastris kolae | 15 | 5 | 0 |
| 65 | COLEOPTERA | Curculionidae | Sophrorhinus spp | 11 | 4 | 0 |
| Total | 1540 | 475 | 199 |
Table 2
Frequency distribution and relative abundance of insect species encountered in selected locations within the FUTA campus.
| S/N | Order | Number of Species (%) | Individuals (%) |
|---|---|---|---|
| 1 | DIPTERA | 17 (27.42) | 1199 (54.15) |
| 2 | LEPIDOPTERA | 17 (27.42) | 249 (11.25) |
| 3 | ODONATA | 10 (16.13) | 68 (3.07) |
| 4 | HYMENOPTERA | 7 (11.29) | 514 (23.21) |
| 5 | HETEROPTERA | 6 (9.68) | 54 (2.44) |
| 6 | COLEOPTERA | 2 (3.23) | 35 (1.58) |
| 7 | EPHEMENOPTERA | 2 (3.23) | 25 (1.13) |
| 8 | MANTODEA | 1 (1.62) | 43 (1.94) |
| 9 | ORTHOPTERA (CAELIFERA) | 1 (1.62) | 15 (0.68) |
| 10 | ORTHOPTERA (ENSIFERA) | 1 (1.62) | 12 (0.54) |
Table 3
Pearson Correlation analysis for insects collected from selected locations in FUTA.
| Location 1 | Location 2 | Location 3 | |
|---|---|---|---|
| Location 1 | 1 | ||
| Location 2 | 0.876322 | 1 | |
| Location 3 | 0.61819 | 0.433862 | 1 |