- P-ISSN2287-9099
- E-ISSN2287-4577
- SCOPUS, KCI
 ISSN : 2287-9099
Mobile User Behavior Pattern Analysis by Associated Tree in Web Service Environment

G.S. Thakur (Maulana Azad National Institute of Technology Bhopal)

Abstract
Mobile devices are the most important equipment for accessing various kinds of services. These services are accessed using wireless signals, the same used for mobile calls. Today mobile services provide a fast and excellent way to access all kinds of information via mobile phones. Mobile service providers are interested to know the access behavior pattern of the users from different locations at different timings. In this paper, we have introduced an associated tree for analyzing user behavior patterns while moving from one location to another. We have used four different parameters, namely user, location, dwell time, and services. These parameters provide stronger frequent accessing patterns by matching joins. These generated patterns are valuable for improving web services, recommending new services, and predicting useful services for individuals or groups of users. In addition, an experimental evaluation has been conducted on simulated data. Finally, performance of the proposed approach has been measured in terms of efficiency and scalability. The proposed approach produces excellent results.
- keywords
- Mobile User, Mobile Location, Mobile Service, Mobile Pattern, Associated Tree
1. INTRODUCTION
Mobile devices are very popular for communication and accessing mobile services. Mobile services can be accessed anywhere via information service providers (Chen et al., 2012). By the development of wireless communication techniques and high feature mobile devices, mobile commerce has become easier and fast. Today most of the mobile devices have high features and support for internet and web services (Kiukkonen et al., 2010). These devices are capable of sending requests for some transactions and services (Perez et al., 2010; Gao et al., 2013). They are also capable of transferring information between multiple users. Services may include selling, purchasing, online information accessing, or using social networking sites, etc. These various kinds of services are accessed by mobile devices and accessed information is stored in the transaction log files (Kiukkonen et al., 2010). Transactions mainly store user information, location information, and time information during which the user accesses any service, and finally the details of services are stored. For fast response from the system for any requested service, data mining operations can be applied to this stored information. These operations may be the mining of similar kinds of services, finding similar habits of users, and preparing groups according to services, etc. By applying such kinds of data mining operations we can restructure the web service environment and take advantage of providing recommendations and predictions for interested users. These are also helpful for business peoples for enhancing their business strategies in web environments.
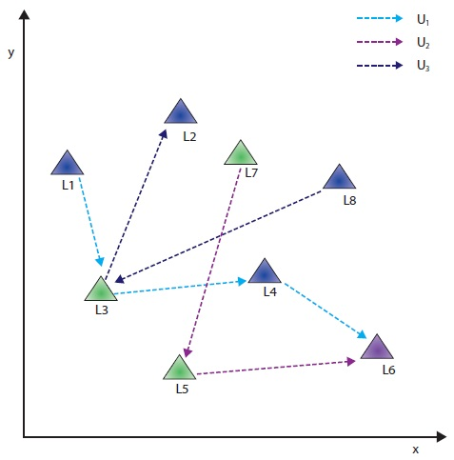
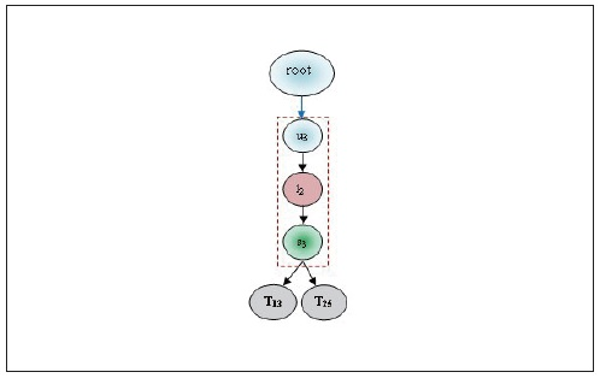
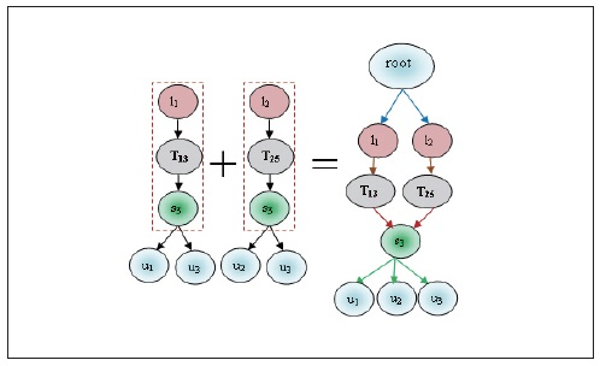
Traditional mobile services are inadequate in handling user movement pattern analysis without the use of location, time of the service, and service request details (Lee, 2007). Over the past years some studies have employed various data mining techniques to provide interesting patterns in mobile service environments (Liu & Keselj, 2007; Pabarskaite & Raudys, 2007). Association rules are used to find unknown frequent patterns between parameters (Agrawal & Srikant, 1994). Apriori is the pioneer for mining frequent itemsets from transaction databases. FP-Growth, which is based on a pattern growth method was afterward proposed to achieve a better performance than Apriori-based methods. FP-Growth improves efficiency of frequent items because it only scans databases twice. Some studies have also focused on the uses of large databases (Cheng et al., 2004). Some recent studies are going to mine the moving path on service request log mines (Agrawal & Srikant, 1994). Researchers have also studied the problem of location tracking (Yavas et al., 2005; Tsai et al., 2007; Tseng & Lu, 2009) and resource allocation (Huang & Lin, 2008; Huang et al., 2003; Peng & Chen, 2005; Peng & Chen, 2003). Bipartite graph matching is also used to find mobile user movement behavior (Ilyas et al., 2004; Fayyazi et al., 2004; Monnot & Toulouse, 2007). Currently, different approaches are in progress to find interesting patterns of mobile users (Lee et al., 2007; Lancieri & Durand, 2006; Tseng et al., 2007; Terziyan & Vitko, 2003; Huang et al., 2003). In mobile e-commerce environments interesting user behaviors can also be predicted, based on accessed services sequences. In this paper, we analyze the behavior of the mobile user movement and find the interesting patterns. Here we have used an associated tree method for joining multiple parameters of mobile access environments. These generated patterns are helpful to business people for launching new services and for providing quick responses to existing ones. figure 1 shows the simple scenario in which different locations are randomly visited by users. Here l1,l2,l3...ln shows the different locations and u1,u2,u3...un represents different mobile users. In this proposed associated tree based pattern mining approach we have used a predefined minimum support value using those interesting patterns which are extracted from the generated candidate records. An acsociated tree based record represents the relationship between four predefined parameters, and its numeric value represents the degree of matching relation of a particular record.
In this paper mobile users, visited locations, dwell time, and services are used to construct the associated tree. Associated trees are used to find the frequent patterns. A Maxflow database is used to represent the relation between these four parameters and joining operations performed between them. This proposed approach is compared with the Apriori candidate generation algorithm. The remainder of this paper is organized as follows. Section 2 defines the basics of the user movement on different locations. Section 3 shows the proposed approach for mobile user behavior analysis by joining associated trees. The experiments conducted and results obtained are explained in section 4. Finally the conclusion is presented in section 5.
2. PRELIMINARIES AND PROBLEM DEFINITION
Mobile e-commerce is an emerging field for recommendation and user behavior analysis. For predicting mobile user behavior, data mining techniques are used. Various parameters are responsible for user behavior prediction. The main parameters are user, visited locations, timestamp, and services (Chen et al., 2012; Mohbey & Thakur, 2013). By these parameters, we can mine various patterns for users. According to these generated patterns, prediction and recommendations are easier. In this paper, we have generated patterns using an associated tree method and the above discussed parameters. Based on generated patterns business people are entitled to launch new services, design appropriate strategies, and so on. The following terminologies are used in this paper.
Definition 1 (Mobile User). U={u1, u2, u3,...un}is the set of mobile users. Each mobile user represents a physical person who carries a mobile device that has the capability of receiving services from the mobile environment (Chen et al., 2012; Mohbey & Thakur, 2013).
Definition 2 (Visited Location). L={l1,l2,l3,...ln}is the set of locations at which users visit and stay for some time (Mohbey & Thakur, 2013).
Definition 3 (Timestamp). T={T1,T2,T3,...Tn} is the set of time durations where mobile users spend time for using requested services. The timestamp Tn, as defined in Table 2, is assumed to have an equal period and a uniform unit. The maximum duration is considered 30 minutes in general (Chen et al., 2012).
Definition 4 (Mobile Services). S={s1,s2,s3,...sn} is the set of mobile services requested by the mobile users.
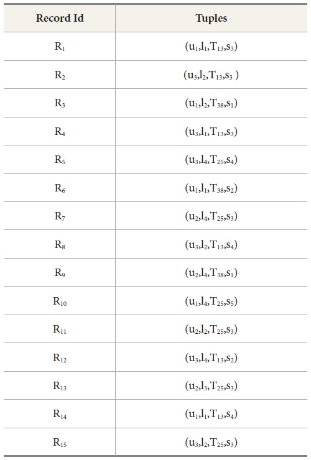
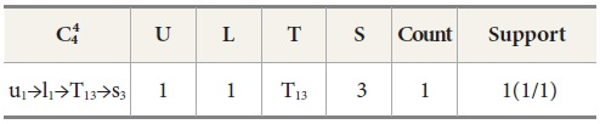
Definition 5 (Support of a Relation). The support of a relation r, such as user→location, user→time, user→ service, location→time etc, is denoted as sup(r) and defined as the number of tuples that contain r in the maxflow database. For example in Table 3, the support of the relation u1→l1 is 3.
Definition 6 (Matching Join). If M⊆U⋈L⋈T⋈S. this M is a match join of U,L,T,S (Chen et al., 2012; Mohbey & Thakur, 2013).
Table 1 shows the mobile user movement database in which (li,Time); li identifies the Location and Time in HH:MM:SS format. This table is derived from figure 1. Here 3 users visited different locations at different times.
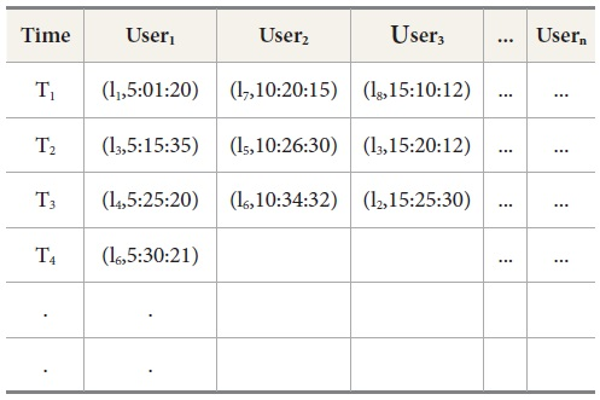
Table 2 shows the predefined timeslots. Maximum duration taken is 30 minutes. According to this, we divide a whole day into 48 time slots of 30 minutes each. These time slots are identified as T1,T2,T3...T48. Each time slot indicates a particular time when a particular user accesses a service from some location.
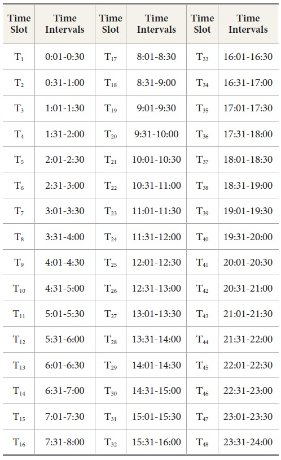
Table 3 shows the maxflow database in which each record represents the user-location-time-service relation. This relation is used to prepare frequent n-trees.
3. FREQUENT ASSOCIATED TREE PATTERN MINING
Associated trees are used to extract the interesting frequent patterns from the various relationships of the user-location-time-service values. Frequent tree patterns are extracted by applying loops. Then we get n-tree candidate patterns. To find the interesting frequent patterns, we firstly scan the maxflow database and generate frequent 1-tree candidate patterns. If the extracted candidate pattern is less than the predefined minimum support value then this pattern is pruned.
Now, a matching join operation is applied to generate a frequent 2-tree pattern. Again if the extracted candidate pattern support is less than the predefined minimum support then infrequent patterns are pruned. Similarly we extract the 3-tree candidate pattern and then the n+1 tree candidate frequent pattern. This process continues until the tree is empty or no more candidates are generated.
After getting each n-tree candidate frequent pattern set we prepare a associated sub tree of the relation record and count the nodes on it. Here maximum node count of a sub tree represents the strong frequent tree pattern. Algorithm 1 show the complete process of frequent associated tree pattern mining (Chen et al., 2012).

This whole process of finding frequent candidate patterns is illustrated in the example below.
4. ILLUSTRATIVE EXAMPLE
The complete procedure of associated tree pattern mining is shown here. For this illustration
we have taken 15 records in the maxflow database which is shown in table 3. Matching
join operation is performed between four parameters to generate candidate sets. These
candidate sets are 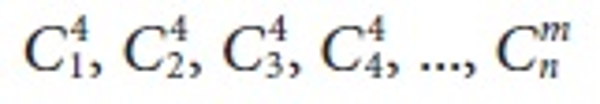 and frequent item sets are L1, L2, L3, L4... Ln.
4.1. Generating Candidate Set 
The proposed approach firstly generates the candidate set  for user, location, dwell time, and services. These generated candidate sets are
shown in Table 4, Table 5, Table 6, and Table 7 respectively.
for user, location, dwell time, and services. These generated candidate sets are
shown in Table 4, Table 5, Table 6, and Table 7 respectively.
4.2. Generating Candidate Set 
Now we apply a matching join operation between  and frequent itemset L1, then we found candidate set
  and L2. These sets are Ui⋈Lj, Ui⋈Tk, Ui⋈Sm, Lj⋈Tk, Lj⋈Sm and Tk⋈Sm. These matching joins are represented in Table 8 to Table 13 and corresponding frequent 2-tree candidate patterns in Figures 2 to 7 respectively.
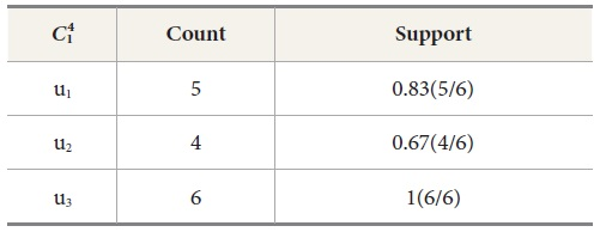
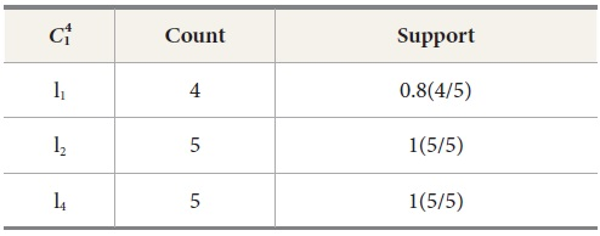
Table 8 represents the matching join of Ui⋈Lj. It is prepared by counting the relation of Ui⋈Lj as
u1→l1=3,
u1→l2=1,
u1→l4=1,
u2→l1=0,
u2→l2=1,
u2→l4=2,
u3→l1=1,
u3→l2=3,
u3→l4=2
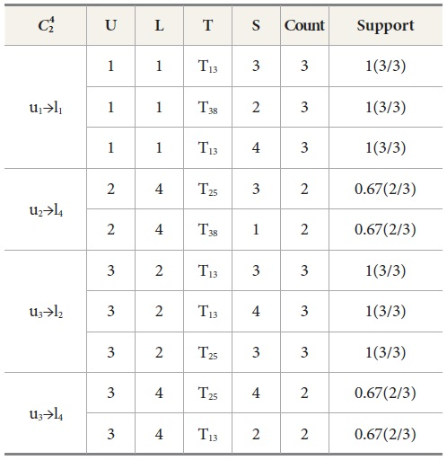
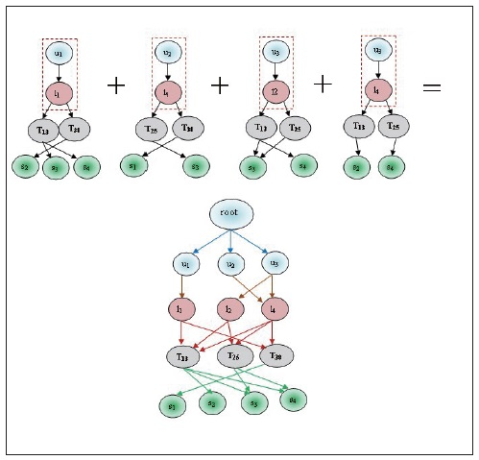
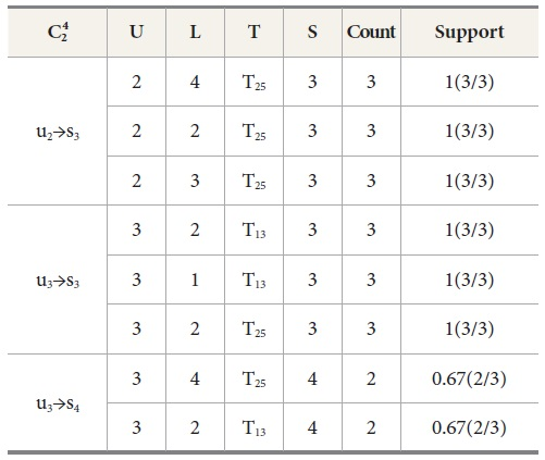
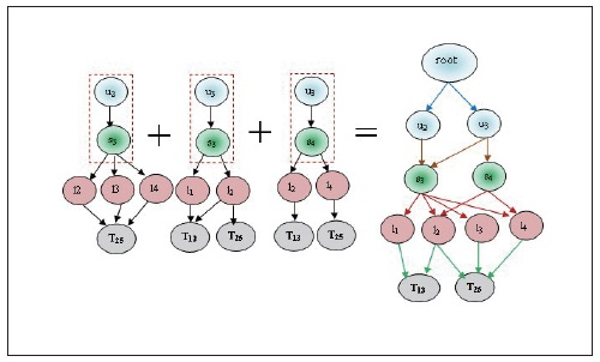
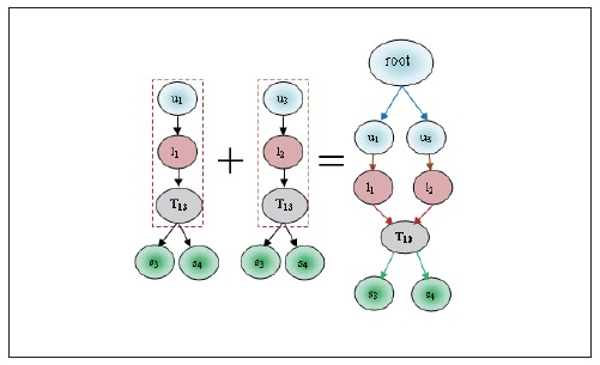
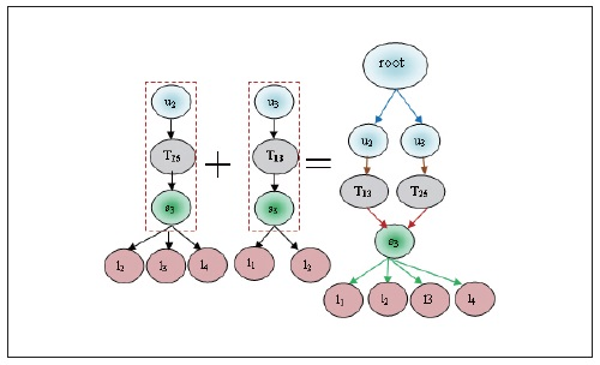
We prune the relations which have lesser count from the predefined minimum support. In this example we have set minimum count=2; so that the relation u1→l1, u2→l4, u3→l2, u3→l4 follows the matching join condition. These relations are denoted in Table 8 and the corresponding frequent 2-tree candidate pattern is shown in Figure 2. Associated Trees prepared by various cases of the matching join Ui⋈Lj, are presented in Table 8. By joining all these cases we find the final frequent candidate tree of 13 nodes.
Similarly, different  4 candidate sets are shown in Table 9, Table 10, Table 11, Table 12, and Table 13. Its frequent 2-Tree is shown in Figure 3, Figure 4, Figure 5, Figure 6, and Figure 7 respectively.
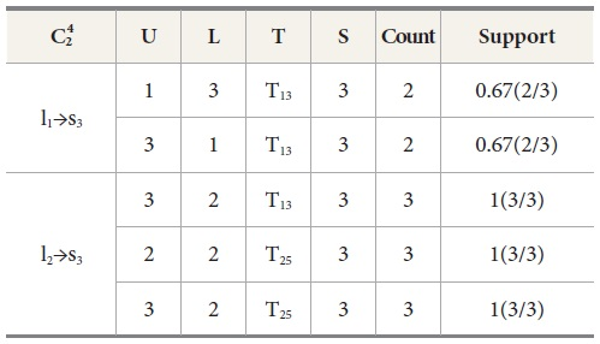
In all candidate sets of  4 we have counted nodes by associated tree as
No. of nodes in Ui⋈Lj = 13
No. of nodes in Ui⋈Tk = 14
No. of nodes in Ui⋈Sm = 10
No. of nodes in Lj⋈Tk = 11
No. of nodes in Lj⋈Sm = 8
No. of nodes in Tk⋈Sm = 13
By these matching joins we identified that the relation Ui⋈Tk has the maximum node from all  candidate sets, which is depicted in Figure 3 Thus it is clear that the relation Ui⋈Tk is stronger than the other matching relations of the candidate sets of
  .
.
4.3. Generating Candidate Set 
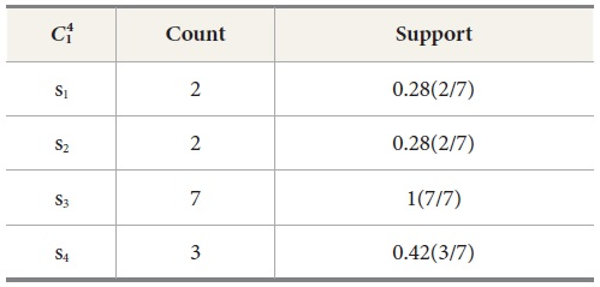
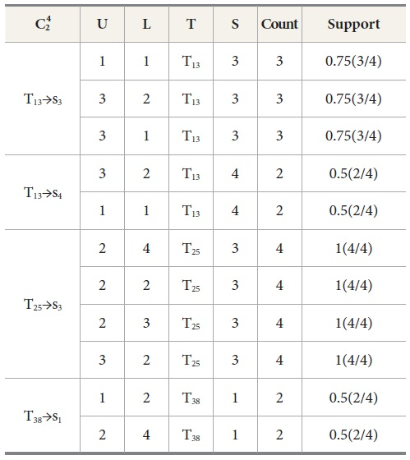
Now we find the candidate sets of  and frequent itemset L3. These are prepared by the relation Ui⋈Lj⋈ Tk, Ui⋈Lj⋈Sm, Ui⋈Tk⋈Sm and Lj⋈Tk⋈Sm.
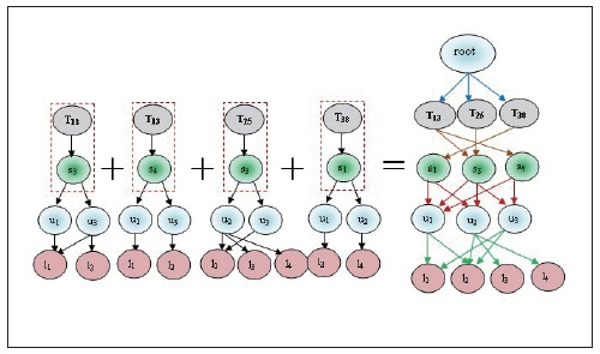
  candidate sets are illustrated in Tables 14 to 17 and the correspondent associated 3-Tree is shown in Figures 8 to 11 respectively.
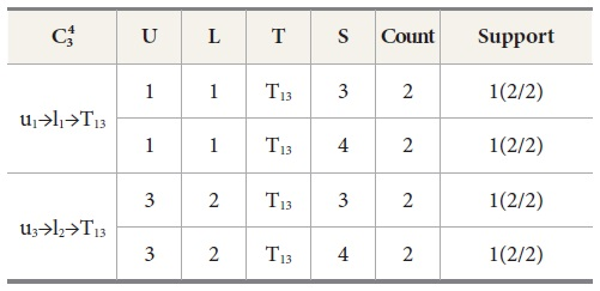
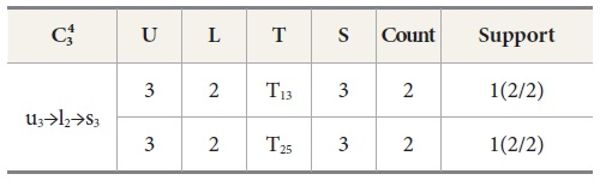
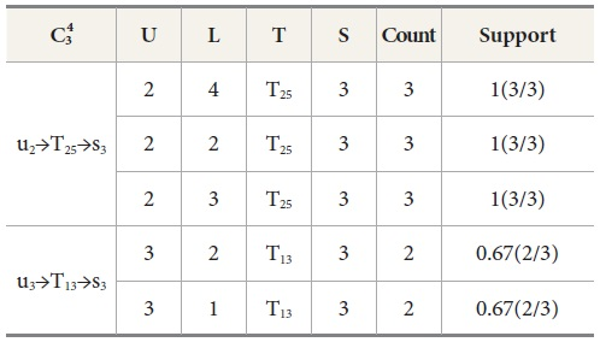
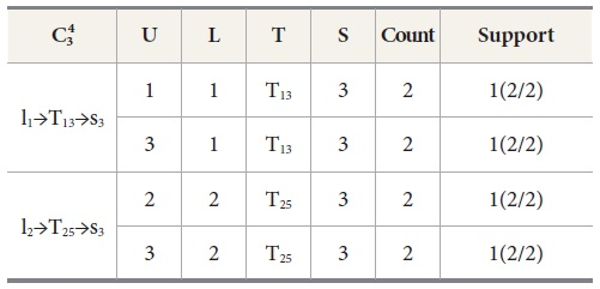
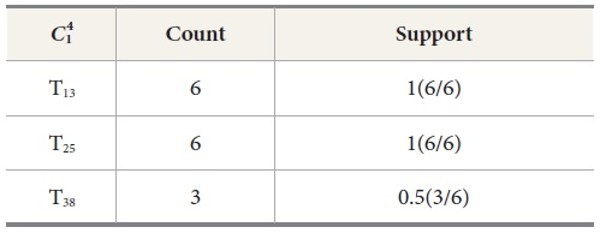
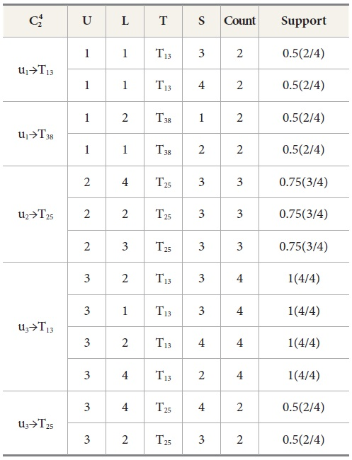
Ui⋈Lj⋈Tk are constructed by the counting of relations as
u1→l1→T13=2,
u1→l1→T38=1,
u2→l4→T25=1,
u2→l4→T38=1,
u3→l2→T13=2,
u3→l2→T25=1,
u3→l4→T13=1,
u3→l4→T25=1.
In all these counted relations we prune the relations which have less count (<2) from
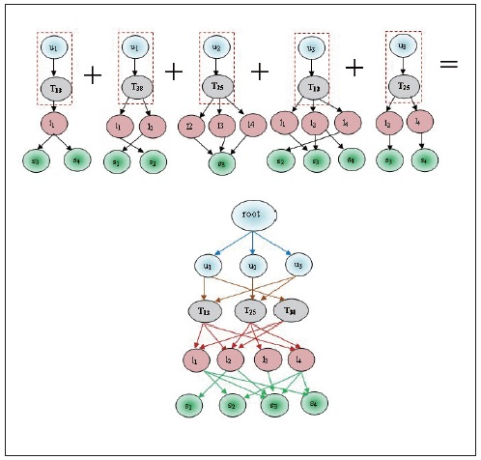
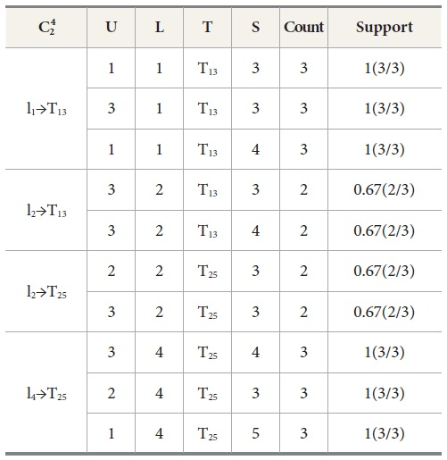
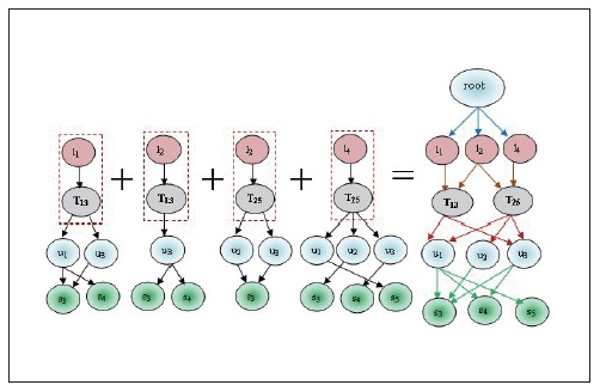
the predefined minimum support so that u1→l1→T13=2 and u3→l2→T13=2 satisfy the minimum support. These relations are denoted in Table 14 with the corresponding frequent 3-Tree in Figure 8. Similarly different  candidate sets and associated trees are prepared. After preparing all associated
sub trees the following nodes are counted:
candidate sets and associated trees are prepared. After preparing all associated
sub trees the following nodes are counted:
No. of nodes in Ui⋈Lj⋈Tk =7
No. of nodes in Ui⋈Lj⋈Sm=2
No. of nodes in Ui⋈Tk⋈Sm=9
No. of nodes in Lj⋈Tk⋈Sm=8
It is observed that the relation Ui⋈Tk⋈Sm has the maximum node count, thus this relation is stronger than other relations of
the candidate set  .
.
4.4. Generating Candidate Set 
In the next step we generate the candidate set  for relation Ui⋈Lj⋈Tk⋈Sm. It is shown in Table 18. Here we observed that the count of this relation is less
than the predefined minimum support (1<2). Thus the process is terminated and the
frequent item set and 4-tree candidate pattern are not prepared. Hence this relation
is neglected.
for relation Ui⋈Lj⋈Tk⋈Sm. It is shown in Table 18. Here we observed that the count of this relation is less
than the predefined minimum support (1<2). Thus the process is terminated and the
frequent item set and 4-tree candidate pattern are not prepared. Hence this relation
is neglected.
By the illustrated example we have found a strong associated tree among sets  Here relation Ui⋈Tk and Ui⋈Tk⋈Sm are the stronger relations among all the relations. These relations show that these
mobile accessing patterns are the most frequent relations. By these obtained relations
one can predict that, if we know the user id and time, then services can be easily
identified. According to this illustration the location parameter is less important
for service prediction. These mined patterns are also helpful for future prediction
and recommendation of services.
Here relation Ui⋈Tk and Ui⋈Tk⋈Sm are the stronger relations among all the relations. These relations show that these
mobile accessing patterns are the most frequent relations. By these obtained relations
one can predict that, if we know the user id and time, then services can be easily
identified. According to this illustration the location parameter is less important
for service prediction. These mined patterns are also helpful for future prediction
and recommendation of services.
5. EXPERIMENTAL EVALUATION
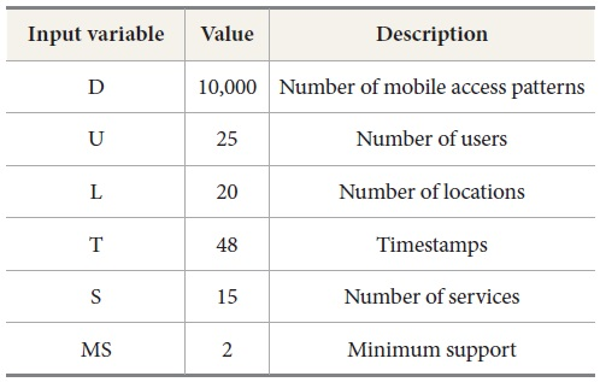
We evaluate the performance of the proposed algorithm in this section. The experiments were performed on a 3.0 GHz processor with 2 GB of memory and the operating system Microsoft Windows 7. The algorithms are implemented in Java. The experiment was conducted on various parameters which are shown in Table 19.
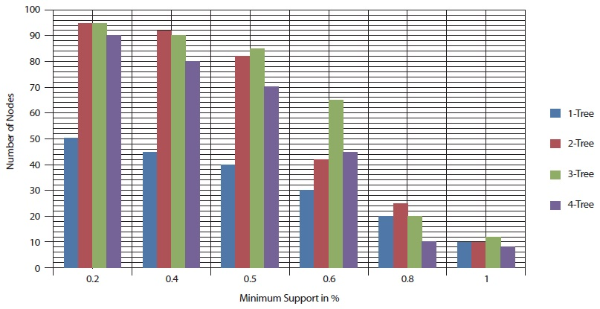
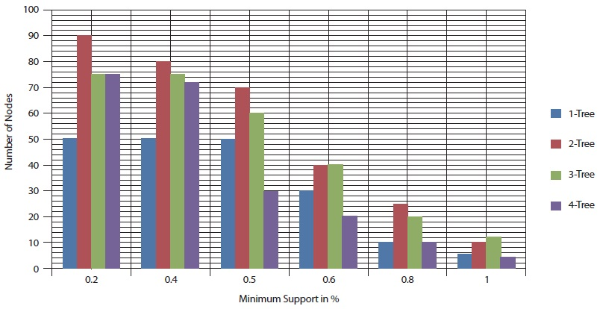
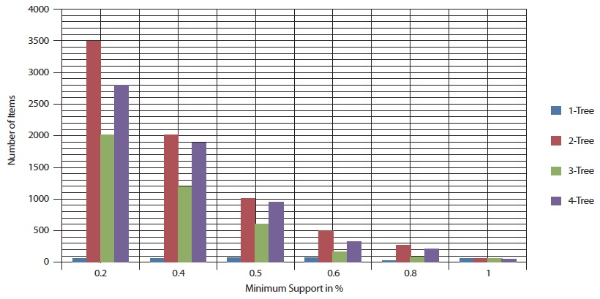
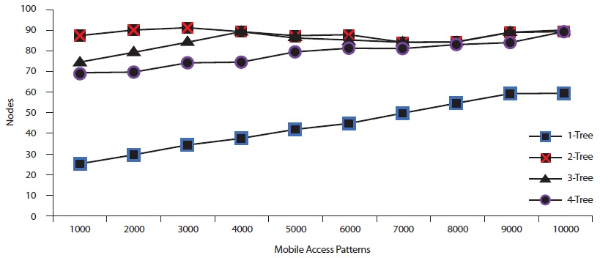
5.1. Analysis Case 1-Different Node Counts
In this experiment, the number of mobile access patterns was set to 5,000 and 10,000.
Here the different node counts are found with respect to different minimum support
values. Figures 12 and 13 show that while the minimum support value increased from 0.1% to 1%, the number of
nodes also decreased. Figures 12 and 13 also show that  has the highest number of associated sub tree patterns.
  had the lowest number of associated sub tree patterns.
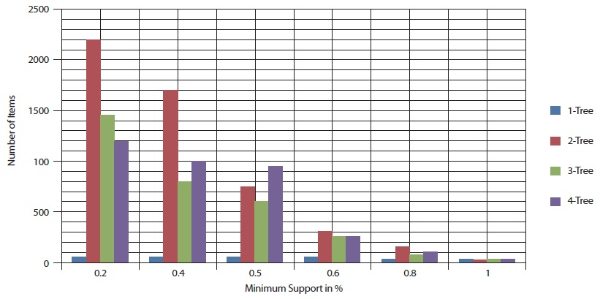
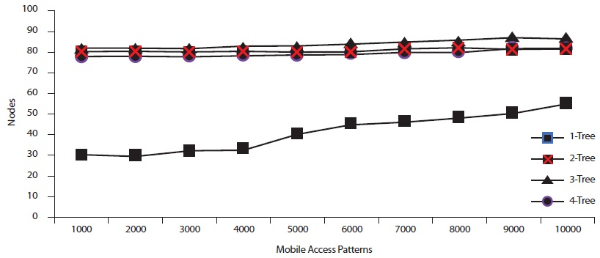
5.2. Analysis Case 2-Different Item Counts
In this experiment, the number of mobile access patterns was again set to 5,000 and 10,000. Figures 14 and 15 show the performance result with respect to different minimum support values. Figures 14 and 15 show that as the minimum support value varied from 0.1% to 1% the number of items decreases.
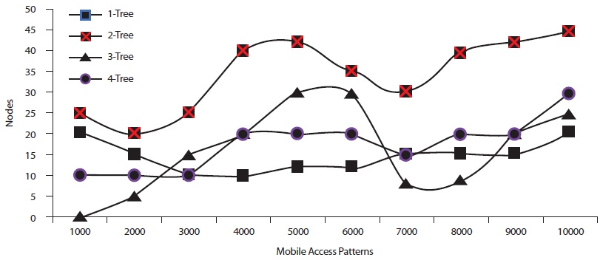
5.3. Analysis Case 3-Different Mobile Access Patterns
In this analysis, we have compared the number of nodes in associated tree patterns and the number of mobile access patterns with respect to different minimum support values. Figures 16 to18 show these comparison results. Figure 16 shows the number of nodes and mobile access patterns with respect to min support=0.2%. Figure 16 shows that the number of nodes increased, while the number of mobile access patterns increased. The variation also shows between number of nodes and mobile access patterns while minimum support is 0.5% and 0.8% respectively. This variation is shown in Figures 17 and 18 respectively.
5.4. Discussion
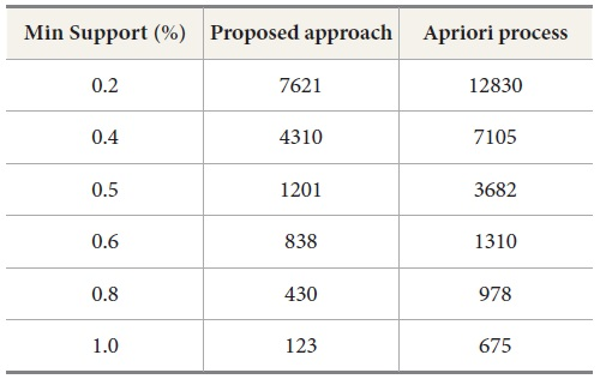
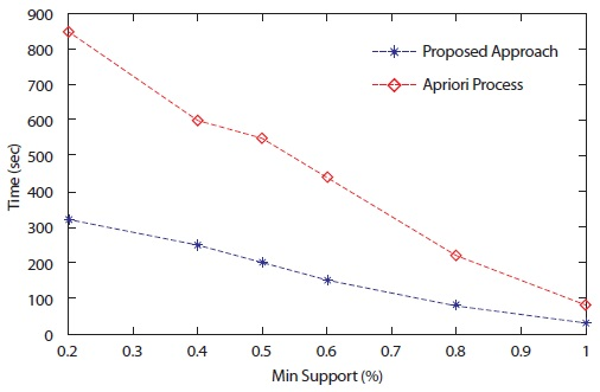
In this subsection experimental inferences are discussed. By the above experiments, the proposed associated tree based approach is shown to outperform the state-of-the-art approach Apriori process. The experimental results show that the proposed approach takes less time as compared to a basic association rule generation Apriori process. Execution time comparisons are shown in Figure 19. Table 20 shows the number of generated patterns with both approaches. Thus, the performance of the associated tree based approach is the best among the compared approaches. The proposed approach is also better in comparison with memory utilization.
6. CONCLUSIONS AND FUTURE WORK
In this paper, we proposed an approach to generate strong frequent patterns between different mobile accessing parameters including user, location, dwell time, and web services. These patterns are generated by the matching joins and presented as associated trees. The proposed approach generates a k-tree frequent pattern in the maxflow database according to defined support values. By the experimental results under the various simulated data, the proposed approach is valuable for recommending and predicting services for different users. The proposed approach is also helpful in business and e-commerce environments where web services are important. The comparison of this approach is done with standard Apriori algorithm, in which we find that the results of the proposed approach are excellent.
For future work, we plan to explore more efficient mobile pattern generation algorithms, and design more efficient frameworks to predict mobile services. In addition, we plan to apply some specific constraints in mining processes to achieve efficient behavior of mobile users. It is also planned to find service patterns according to utility or importance bases.
- Submission Date
- 2013-09-17
- Revised Date
- Accepted Date
- 2014-04-29
- 381Downloaded
- 1,055Viewed
- 0KCI Citations
- 0WOS Citations