- P-ISSN2287-9099
- E-ISSN2287-4577
- SCOPUS, KCI
 ISSN : 2287-9099
Assessment of Mechanical Engineering Research Output using Scientometric Indicators: A Comparative Study of India, Japan, and South Korea

N.S. Harinarayana (Dept. of Library & Information Science University of Mysore)

Abstract
This study examined the mechanical engineering research output from India, Japan, and South Korea on different parameters including growth, collaboration indices, and activity index. The purpose of the study is to understand the overall development of mechanical engineering through analytical approaches applied on the scholarly outcome of the countries considered for the study. The study focuses on analysing the articles published by India, Japan, and South Korea, and is restricted to articles indexed in the Science Citation Index – Web of Science for the period 2000 to 2014. The ratios of number of paper to citations for India, Japan, and Korea are 20,836: 1,97,679; 24,494: 2,04,393; and 30,578: 2,66,902 respectively for the period 2000-2014. The findings show that there is a decline in Japanese publications in mechanical engineering, whereas other two countries have recorded an increasing trend. While India has tripled its publications in a span of 15 years, South Korea, on the other hand, has doubled its publications in the same span of time. There has been an increasing trend towards collaboration in almost all fields of science and technology. However, the extent of collaboration and their rate of growth varied for one subject to another, one branch to another branch of the same subject, and from one country to another country. The present study analyses the growth of research publications of the mechanical engineering domain including authorship distribution, collaboration indices, prominent journals, and activity index.
- keywords
- Scientometrics, Mechanical Engineering, Doubling Time, Activity Index, Growth Rate for Scientific Publication, India, Japan, South Korea, Authorship Distribution, Collaboration Indices, Bradford's Law
1. INTRODUCTION
Mechanical engineering (UNESCO, 2010) emerged as a field during the industrial revolution in Europe in the 18th century; however, its development can be traced back several thousand years around the world. Mechanical engineering was driven forward by the successive waves of innovation and industrial revolution. The literature on the subject recognizes seven waves in the growth and development of mechanical engineering starting from 1750s (UNESCO, 2010). The last three waves have had significant impact on carving the road map of the growth of mechanical engineering as a discipline and a profession. The fifth wave, based on information and telecommunications, was related to electrical and mechanical engineering. The sixth wave, beginning around 1980, was based on new knowledge production and application in such fields as IT, biotechnology and materials. The seventh wave, beginning around 2005 and the current one, based on sustainable ‘green’ engineering and technology to promote sustainable development, climate change mitigation and adaptation, will once again be focused particularly on a core of mechanical engineering.
The developments discussed above are significant in terms of total R&D expenditures at the global level which have been on the rise. The indicators published in 2016 by National Science Foundation (National Science Foundation, 2014, pp. 4–17) highlight that China, South Korea and India are investing heavily in R&D and in developing a well-educated workforce skilled in science and engineering. The R&D expenditure in Asia is fast growing and the countries India, China, South Korea and Japan are the front runners, which was predicted many years ago. The high-technology manufacturing industries in China, Japan and South Korea too rose rapidly since 1998 (National Science Foundation, 2014, pp. 6–9).
Borrego (2007) studied the engineering research outcome to understand the role of engineering education coalitions in advancing the field of engineering education. The Engineering research has grown into a large research community with an ever-increasing number of publications and scholars. Borrego, Froyd and Hall (2010) and Wankat (2012) found out that the engineering education scholars are not well informed about the research by other scholars and the research outcomes. Mechanical engineering being the oldest and greatly evolved disciplines it remains unclear whether the mechanical engineering community is experiencing the same gap. This gap has high potential of bringing down the migration of research findings into practice.
Asia has a long history of engineering growth and this study plans to highlight the research growth with special reference to India, Japan and South Korea. The research outcome from India, China, South Korea and Japan have a high publication productivity compared to other countries of Asia in the area of mechanical engineering, data retrieved from Science Citation Index for the period 2000-2014. Globally, USA tops the list with 1,22,314 articles, followed by China with 69,515 articles, which is followed by England with 31,054 articles. While authors from India, Japan and South Korea have published 20,850, 30,578 and 24,494 articles respectively, China has a larger number with 69,515 articles in Asia which is more than double the articles published by Japan which is the highest among the three. The intention of this study is to have a comparison of the countries on equal footing. Hence, the study revolves around the contributions the three countries excluding China. Further, the first author of this paper, a mechanical engineer himself and also a library professional, has a natural flavour towards the discipline. These are the drivers which motivated the authors to take up a study which focuses scientometric analysis of mechanical engineering.
The present study aims finding out the growth of research publications of mechanical engineering domain from India, Japan and South Korea, including authorship distribution, collaboration indices, and activity index.
2. REVIEW OF LITERATURE
This study describe and explore the factual picture of research interests within mechanical engineering, by analyzing the literature.
Bibliometrics has established itself as a viable and distinctive research technique for studying the science of science based on bibliographical and citation data (Gupta & Gupta, 2004). There has been an increasing interest in using scientometric information for assessing or monitoring research activities for past few decades. The discipline devoted to the quantitative study and evaluation of the scientific literature is called scientometrics or bibliometrics. Bibliometrics has been applied to the evaluation of scientific disciplines, national scientific production, and bibliographic databases, and it provides valuable tools to describe the scientific activity in the past and to orient future research (Schoepflin & Glanzel, 2001). The aim of scientometrics is to provide quantitative characterizations of scientific activity. Because of the particular importance of publication in scientific communities, it largely overlaps with bibliometrics, which is quantitative analysis of media in any written form.
Bibliometric studies on engineering are rather scantly found. Kim (2002) compared the citation patterns of researchers from physics and mechanical engineering domain in Korea and found out that the type of publication source and type of authorship were found to influence the choice of sources cited by them. Noteworthy is that articles in physics journals from Japan are more frequently cited in papers written by purely Korean authorship than those with international co-authorship. In addition, articles of Korean journals are more highly cited in nationally authored papers than in internationally co-authored papers, in both fields. Ravichandra Rao and Suma (1999) analysed the Indian engineering literature and found that the engineers in India publish in a selected few journals and only a few of the institutions are concentrated in engineering research. They observed that research output in applied physics, light & optics, bioengineering and information science are increasing both at the world and India level. Kaur and Gupta (2009) examined the India’s performance based on its publication output in Immunology and Microbiology during 1999-2008, based on several parameters, including the country’s annual average growth rate, global publications share and rank, institutional profile of top 15 institutions, international collaboration profile and major collaborative partners, patterns of communication in national and international journals, and characteristics of its top 15 most productive authors. Karamourzov (2012) assessed the results of the independent development of the Commonwealth of Independent States (CIS) countries in the field of science over the period 1990–2009. Jesiek et al. (2011) studied the global trends in engineering education with the help of scientometric indicators and recommended ways to build global capacities in engineering education and suggested steps to grow the cross-national collaboration. In a similar study comparing the output of India and China in the fields of sciences and engineering, Panat (2014) found out that Chinese research output is increasing compared to India's. In a recent study, Banshal, Muhuri, Singh and Basu (2017) analyse the research output of 16 (out of 23) most prestigious engineering and technology institutions of India (Indian Institute of Technology), comparing with the likes of MIT-USA and NTU-Singapore. In the engineering disciplines, Mechanical engineering stand in top 5, inviting the policy makers/funding agencies to make strategic decisions in terms of the allocation of funds and resources to upliftment of the discipline. In a recent similar cross national comparitive assessment on endocrinology and metabolism, Lyu, Pu and Zhang (2017) compares the research output of China, Japan and South Korea. The research articles from China and South Korea increased in a span of 10 years from 2005-2014, but for Japan there wasn't significant increase.
Sangam, Keshava, and Agadi (2010), Gupta, Kshitij, and Verma (2011), Bhattacharya, Shilpa, and Bhati (2012), Elango and Rajendran (2015), Hadagali and Anandhalli (2015), Singh, Banshal, Singhal, and Uddin (2015), Liu, Lin, Wang, Peng, and Hong (2016), Barrot (2017), Zou and Laubichler (2017), Nobre and Tavares (2017) are the studies to assess the scientific research output in the last ten years, to mention a few. There has been an increasing trend towards collaboration between countries and institutions in almost all fields of science and technology. However, the extent of collaboration and their rate of growth varies for one subject to another, one branch to another branch of the same subject and from one country to another country. The present study aims finding out the growth of research publications of mechanical engineering domain from India, Japan and South Korea.
3. METHODOLOGY
The data for this study was collected from the Science Citation Index- Expanded (SCI-E) of Web of Science, a comprehensive and exhaustive database enveloping almost all subjects of Science and Technology. Its coverage in engineering field is quite comprehensive and well acknowledged. The database was searched for collecting documents pertaining to the areas related to mechanical engineering published between 2000 and 2014.
The query used to search documents from South Korea is:
CU = South Korea AND WC= (Mechanics OR Engineering Mechanical OR Thermodynamics OR Engineering, Aerospace OR Engineering Manufacturing OR Engineering Industrial OR Robotics). The search results were restricted to Science Citation Index Expanded with the time span 2000-2014. India and Japanese publications were retrieved by changing CU=India and CU=Japan in the query respectively.
The data was collected in the month of April 2016. Articles, conference proceedings, and review articles are considered for the present study. The data was then analysed with the help of Microsoft excel, and formulae related to scientometric analysis have been used to calculate the desired results. Scientometric indicators like collaboration indices, activity index have been calculated in addition to publications growth, author productivity, and the most prominent journals are calculated.
The collaboration indices have been calculated, the formulae to calculate the various indices are stated here:
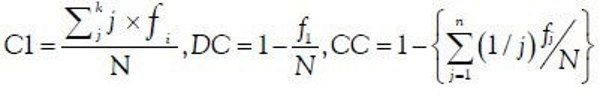
Where fi the total number of articles with i authors published during a certain period of time,
N is the total number of articles published during the same time period,
k is the number of authors per article in each discipline,
f1 is the number of single authored papers,
fj is the number of articles with a single author published during a certain period of time.
The Activity Index (AI) is also calculated which characterizes the relative research effort of a country for a given subjects. AI is defined as;
<math xmlns="http://www.w3.org/1998/Math/MathML"> <mtext>AI </mtext> <mo>=</mo> <mtext> </mtext> <mfrac> <mtext>given field’s share in the country’s publication output</mtext> <mtext>given field’s share in the world’s publication output</mtext> </mfrac> </math>
<math xmlns="http://www.w3.org/1998/Math/MathML"> <mtext>Mathematically AI </mtext> <mo>=</mo> <mtext> </mtext> <mfrac> <mtext>nij/nio</mtext> <mtext>noj/noo</mtext> </mfrac> <mo>*</mo> <mn>100</mn> </math>
Where:
nij - Indian/South Korea output of papers in particular field
nio - Total Indian/South Korean output on all subjects
noj - World output of papers in particular field
noo - Total World output on all subjects
4. RESULTS AND DISCUSSION
This section provides the results after application of scientometric tools to analyse the outcome.
4.1. Growth of Publications
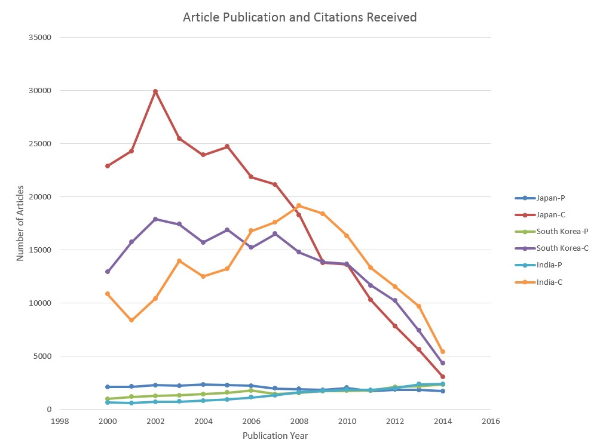
One of the obvious features of scientific literature in recent years has been its rate of growth. A number of growth models have been proposed regarding the rate of growth. Way back in 1963 Price (1963) proposed an exponential rate of growth of scientific literature. He predicted a regular exponential growth with doubling period of ten to fifteen years. Price proposed an exponential rate of growth of scientific literature. He predicted a regular exponential growth with doubling period of ten to fifteen years. For testing the fitness of Price model, it’s found that the articles doubled in the topic considered here from India in the span of 7 years from 660 articles in 2000 to 1332 articles in 2008. Similarly, for South Korea the doubling period is 12 years with 1004 articles in 2000 to 2113 articles in 2013. The Table 1 provides the temporal development of research publications, and related references and the citations for the articles published in time span studied. As far as Japan is considered, there was a thin change both upwards and downwards for the period studied. Figure 1 puts the data into a pictorial representation with the publications and the citations data. Interestingly the research publications’ slope for Japan is downward from 2115 articles in 2000 to 1737 articles in 2014. Further analysis showed that out of the top 10 Japanese journals which were indexed in Web of Science in 2000, only one continue to be indexed in 2014, nine of them were discontinued over the years. The number of journals indexed dropped to 137 in 2014 from 215 in 2000 accounting for a drop-percentage of 36.27. While for India, although there is a drop in the number of indexed journals between 2000 and 2014, the drop percentage is not as significant as in Japan’s case. 42 out of 50 (in 2000) Indian journals continue to be indexed in 2014 with a drop-percentage of 16. Indian authors published their articles in 286 journals. The drop-percentage for South Korean journals is 21.08 with 131 out of 166 (2000) journals continue to be indexed in 2014. South Korean authors published their articles in 268 journals in 2014.
India is slightly ahead in publications compared to South Korea and Japan in 2014, even though the research publications was less compared to both the countries. A total of 2,66,902 articles cited 30,578 articles published by Japan, likewise for South Korea 2,04,393 articles cite 24,494 articles and 20,836 articles published by India received 1,97,679 citations. The citations per paper rate is highest for India with 9.5 followed by 8.7 for Japan and 8.3 for South Korea. Gross droop can be identified for South Korea beginning 2005 when there was a drastic increase in publications in 2006, and similarly for India during the same time frame. But interestingly there was a drop in publications beginning 2006 in South Korea and it took five years to regain numbers.
Table 1
Growth of Publications and Citations
| Published Year | India | Japan | South Korea | ||||||
|---|---|---|---|---|---|---|---|---|---|
| Cited References | Publications | Citations | Cited References | Publications | Citations | Cited References | Publications | Citations | |
| 2000 | 12713 | 660 | 10840 | 28548 | 2115 | 22913 | 15847 | 1004 | 12933 |
| 2001 | 11358 | 609 | 8392 | 30220 | 2153 | 24318 | 18899 | 1183 | 15748 |
| 2002 | 13755 | 703 | 10442 | 34436 | 2294 | 29922 | 20064 | 1264 | 17915 |
| 2003 | 15039 | 757 | 13970 | 33767 | 2222 | 25483 | 22221 | 1335 | 17424 |
| 2004 | 18106 | 838 | 12514 | 36048 | 2336 | 23948 | 23781 | 1440 | 15721 |
| 2005 | 20525 | 927 | 13236 | 38486 | 2281 | 24724 | 25711 | 1580 | 16882 |
| 2006 | 26338 | 1125 | 16796 | 37713 | 2230 | 21868 | 28437 | 1773 | 15227 |
| 2007 | 31900 | 1332 | 17608 | 35671 | 1972 | 21153 | 27255 | 1459 | 16520 |
| 2008 | 39016 | 1619 | 19166 | 36883 | 1932 | 18285 | 31583 | 1571 | 14793 |
| 2009 | 45017 | 1765 | 18402 | 34770 | 1839 | 13806 | 35042 | 1721 | 13878 |
| 2010 | 51006 | 1855 | 16340 | 41246 | 2024 | 13627 | 38716 | 1753 | 13697 |
| 2011 | 51265 | 1851 | 13324 | 39827 | 1753 | 10286 | 41255 | 1790 | 11668 |
| 2012 | 60100 | 2020 | 11549 | 41649 | 1863 | 7857 | 49765 | 2113 | 10225 |
| 2013 | 71218 | 2371 | 9698 | 45472 | 1827 | 5640 | 54967 | 2166 | 7422 |
| 2014 | 77583 | 2404 | 5402 | 45551 | 1737 | 3072 | 60035 | 2342 | 4340 |
| Total | 5,44,939 | 20,836 | 1,97,679 | 5,60,287 | 30,578 | 2,66,902 | 4,93,578 | 24,494 | 2,04,393 |
4.2. Authorship Distribution
Due to the advent of technology in last few decades, the collaboration between researchers has increased, multiple-authorship has been a characteristic feature of the modern science (Balog, 1980). The literature on any subject reflects not only the basic publishing pattern but also the characteristics of the authors themselves. Collaboration in research is said to have taken place when two or more scientists work together on a scientific problem or project and contribute their physical and mental efforts. Price (1963) was among the first to observe that multi-authored papers are steadily increasing with simultaneous reduction in single authored papers. His observations were based on sampling of Chemical Abstracts for the period of 1910-1960.
The pattern of co-authorship was studied by distributing the output of publications with respect to number of authors. The distribution was done as single author, two authors, till four authors and the rest were clubbed into one group named five and above group. The Table 2 clearly shows that articles with three authors in both Japan and South Korea are on top when compared to the other set of articles. Articles published by researchers in Japan and South Korea preferred to work in large groups. In India, researchers are becoming more and more aware of the importance of collaboration where articles with two authors are in higher number compared to the other set of articles. Overall, 29% of the total number of articles (for all three countries) have been authored by three authors, followed by 28% with two authors. Interestingly 18% of the total number of articles are authored by four authors, and only 8% of the articles are authored by single author. This reveals that collaboration has gained momentum and the trend is towards two-authored, three-authored publications. It would be pertinent to mention here that single author does not necessarily mean no collaboration. Majority of single authors were found to be having multiple addresses thereby meaning that they were utilizing the facilities of other institutions with in the country and thus have been considered as domestic collaboration. Collaboration between authors in Japan and South Korea is slightly better than compared to India, as larger percentage of articles in Japan and South Korea are authored by three authors.
Table 2
Authorship Pattern
| Authorship Pattern | ||||||
|---|---|---|---|---|---|---|
| India<br>(20,836) | Japan<br>(30,578) | South Korea<br>(24,494) | ||||
| No. of Authors | No. of Publications | Percentage | No. of Publications | Percentage | No. of Publications | Percentage |
| 1 | 1496 | 7.2 | 3400 | 11.1 | 1533 | 6.3 |
| 2 | 7746 | 37.2 | 6233 | 20.4 | 6543 | 26.7 |
| 3 | 6815 | 32.7 | 7993 | 26.1 | 7213 | 29.4 |
| 4 | 3002 | 14.4 | 6261 | 20.5 | 4757 | 19.4 |
| 5 & above | 1791 | 8.6 | 6691 | 21.9 | 4448 | 18.2 |
4.3. Collaboration Indices
Collaboration is an intense form of interaction that allows for effective communication as well as the sharing of competence and other resources (Melin & Persson, 1996). To compare the extent of collaboration in two fields (or subfields) or to show the trend towards multiple authorships in a discipline, many studies have used either the mean number of authors per paper, termed the Collaborative Index (CI) by Lawani (1980) and/or the proportion of multiple-authored papers, called Degree of Collaboration (DC) by Subramanyam (1983) as a measure of the strength of collaboration in a discipline. These two measures are shown inadequate by Ajiferuke, Burell, and Tague (1988) and they derived a single measure called Collaborative Coefficient (CC) that incorporates some of the merits of both of the above. Collaboration Coefficient as defined by Ajiferuke, Burell & Tague, lies between 0 and 1, with 0 corresponding to single authored papers. However it is not 1 for the case where all papers are maximally authored, i.e. every publication in the collection has all authors in the collection as co-authors. The research output indicators revealed the stable growth and increased cooperation in terms of the number of articles, the average number of references, and the collaboration index.
In the last section we discussed about authorship pattern and saw Japan and South Korea have published more articles with three authors when compared to India where two authored publications are more. After necessary computations, the indices data are being published in the Table 3. Japan scores high in terms of collaboration with the maximum CI being 3.82 and minimum being 3.27, followed by South Korea with a maximum of 3.52 CI. India has been bit consistent in terms of growth in CI compared with Japan and South Korea.
The degree of collaboration (DC) for India on the other hand indicates a steep curve beginning 2003 with an indication of collaborative research being on the rise, compared to Japan and South Korea where at times in the middle the trend is downwards. All the three indices indicate that the collaboration is on the upward trend, with a yellow occupying the last part of the table. The collaboration coefficients for India, Japan and South Korea are 0.6, 0.66, and 0.65 respectively which infers that the collaborative pattern is dominant than the single authored papers in this study. This trend, of course, is similar to the trends found in other disciplines as in laser science (Garg & Padhi, 2001), social media (Coursaris & Van Osch, 2014), cloud computing (Heilig & Vob, 2014) computer science (Singhal, Sumit Kumar Banshal, Uddin, & Singh, 2015), etc.
Table 3
Collaboration Indices
| Published Year | CI | DC | CC | ||||||
|---|---|---|---|---|---|---|---|---|---|
| India | Japan | South Korea | India | Japan | South Korea | India | Japan | South Korea | |
| 2000 | 2.67 | 3.32 | 2.71 | 0.89 | 0.86 | 0.90 | 0.54 | 0.58 | 0.55 |
| 2001 | 2.72 | 3.32 | 2.95 | 0.90 | 0.85 | 0.93 | 0.55 | 0.58 | 0.59 |
| 2002 | 2.65 | 3.41 | 3.00 | 0.89 | 0.88 | 0.93 | 0.54 | 0.60 | 0.60 |
| 2003 | 2.75 | 3.27 | 3.03 | 0.88 | 0.87 | 0.92 | 0.55 | 0.59 | 0.60 |
| 2004 | 2.87 | 3.43 | 3.12 | 0.91 | 0.88 | 0.93 | 0.57 | 0.60 | 0.61 |
| 2005 | 2.76 | 3.45 | 3.22 | 0.91 | 0.90 | 0.94 | 0.56 | 0.62 | 0.62 |
| 2006 | 2.78 | 3.57 | 3.42 | 0.92 | 0.88 | 0.95 | 0.57 | 0.61 | 0.64 |
| 2007 | 2.79 | 3.41 | 3.37 | 0.92 | 0.88 | 0.94 | 0.57 | 0.61 | 0.63 |
| 2008 | 2.86 | 3.55 | 3.36 | 0.93 | 0.89 | 0.94 | 0.59 | 0.62 | 0.63 |
| 2009 | 2.87 | 3.54 | 3.38 | 0.93 | 0.90 | 0.93 | 0.59 | 0.62 | 0.63 |
| 2010 | 2.95 | 3.61 | 3.44 | 0.94 | 0.90 | 0.94 | 0.59 | 0.63 | 0.64 |
| 2011 | 2.92 | 3.61 | 3.47 | 0.94 | 0.90 | 0.94 | 0.59 | 0.62 | 0.64 |
| 2012 | 2.96 | 3.57 | 3.51 | 0.94 | 0.88 | 0.95 | 0.60 | 0.62 | 0.65 |
| 2013 | 2.95 | 3.74 | 3.51 | 0.94 | 0.93 | 0.95 | 0.59 | 0.65 | 0.65 |
| 2014 | 2.93 | 3.82 | 3.52 | 0.95 | 0.93 | 0.94 | 0.60 | 0.66 | 0.64 |
4.4. Activity Index
In the present study, the Activity Index (AI) has been calculated for different years to see how India, Japan and South Korea’s performance gradually changed during different years. Activity Index has been used to calculate the same. The Activity Index was first suggested by Frame (Frame, 1977) and used among others by Schubert and Braun (1986) Nagpaul (1995), Karki and Garg (1997), Garg and Padhi (1999), Kumari (2006), Chetri, Saini, and Luthra (2009), Sagar and Kademani (2011).
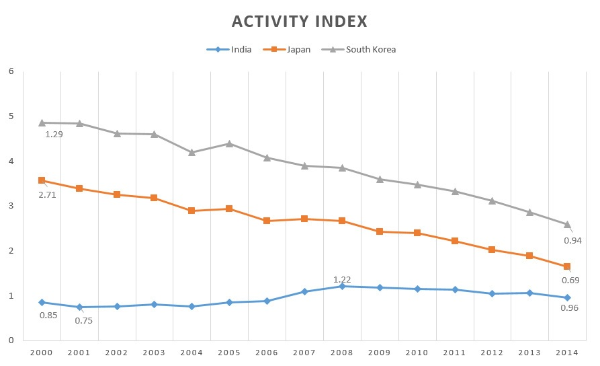
The activity index in Table 4 clearly shows that research in Japan was high in 2000 and decreased gradually, and its a downward trend altogether. On the other hand South Korea's research can be compared to a sine wave as in 2001 it was in peak and reached high in 2005 and took a downward trend from then onwards. On the other hand, India's research is on the upward trend beginning 2000, with a minimal downtrend in the middle. Overall there is a significant rise in terms of articles published by India when compared to Japan and South Korea. A graph (Figure 2) has been plotted to display the activity index of all the three countries.
Table 4
Activity Index
| Published Year | World Publications | Publications | Activity Index | ||||
|---|---|---|---|---|---|---|---|
| India | Japan | South Korea | India | Japan | South Korea | ||
| 2000 | 5441 | 660 | 2115 | 1004 | 0.85 | 2.71 | 1.29 |
| 2001 | 5691 | 609 | 2153 | 1183 | 0.75 | 2.64 | 1.45 |
| 2002 | 6441 | 703 | 2294 | 1264 | 0.76 | 2.49 | 1.37 |
| 2003 | 6540 | 757 | 2222 | 1335 | 0.81 | 2.37 | 1.42 |
| 2004 | 7668 | 838 | 2336 | 1440 | 0.76 | 2.13 | 1.31 |
| 2005 | 7619 | 927 | 2281 | 1580 | 0.85 | 2.09 | 1.45 |
| 2006 | 8794 | 1125 | 2230 | 1773 | 0.89 | 1.77 | 1.41 |
| 2007 | 8522 | 1332 | 1972 | 1459 | 1.09 | 1.62 | 1.19 |
| 2008 | 9288 | 1619 | 1932 | 1571 | 1.22 | 1.45 | 1.18 |
| 2009 | 10370 | 1765 | 1839 | 1721 | 1.19 | 1.24 | 1.16 |
| 2010 | 11281 | 1855 | 2024 | 1753 | 1.15 | 1.25 | 1.08 |
| 2011 | 11338 | 1851 | 1753 | 1790 | 1.14 | 1.08 | 1.10 |
| 2012 | 13432 | 2020 | 1863 | 2113 | 1.05 | 0.97 | 1.10 |
| 2013 | 15536 | 2371 | 1827 | 2166 | 1.07 | 0.82 | 0.97 |
| 2014 | 17462 | 2404 | 1737 | 2342 | 0.96 | 0.69 | 0.94 |
| Total | 145423 | 20836 | 30578 | 24494 | |||
4.5. Bradford’s Law of Scattering
Bradford (1934), a British mathematician, librarian and documentalist at the Science Museum in London revealed a pattern of how literature in a subject is distributed in journals.
Table 5 provides the journal distribution during the study period, each of the zone covers one third of the articles. The core journals in the zone 1 for each country are listed in the Table 5a. The analysis of journals shall help the scholars in getting an overview of prominent journals. The Journal of Materials Processing Technology and International Journal of Heat and Mass Transfer top the list from all countries. They are the prominent journals by the mechanical engineering research community.
Table 5
Zone-Wise Distribution of Articles and Journals from all Three Countries
| Zone | 1st | 2nd | 3rd | |
|---|---|---|---|---|
| India | Articles | 64028 | 64929 | 67748 |
| Journals | 9 | 26 | 343 | |
| Japan | Articles | 87789 | 86633 | 87072 |
| Journals | 18 | 37 | 332 | |
| South Korea | Articles | 66602 | 67591 | 68714 |
| Journals | 12 | 39 | 325 |
Table 5a
Core Journals for each Country Grouped in Zone 1
| Country | Journal | Articles | Citations Received |
|---|---|---|---|
| INDIA | International Journal of Heat and Mass Transfer | 681 | 10974 |
| Journal of Materials Processing Technology | 517 | 9658 | |
| The International Journal of Advanced Manufacturing Technology | 826 | 8644 | |
| Journal of Sound and Vibration | 441 | 6664 | |
| Journal of Chemical & Engineering Data | 513 | 6578 | |
| Wear | 339 | 6543 | |
| Energy | 283 | 5398 | |
| The Journal of Thermal Analysis and Calorimetry | 616 | 4788 | |
| Energy Conversion and Management | 276 | 4781 | |
| JAPAN | Journal of Materials Processing Technology | 692 | 10160 |
| International Journal of Heat and Mass Transfer | 534 | 9017 | |
| Wear | 365 | 6160 | |
| CIRP Annals - Manufacturing Technology | 390 | 5808 | |
| Journal of Fluid Mechanics | 278 | 5226 | |
| Physics of Fluids | 420 | 4898 | |
| Journal of Micromechanics and Microengineering | 360 | 4688 | |
| Composites Part A:Applied Science and Manufacturing | 208 | 4570 | |
| Journal of Chemical & Engineering Data | 308 | 4378 | |
| Energy | 225 | 4330 | |
| Proceedings of the Combustion Institute | 328 | 4172 | |
| Journal of Sound and Vibration | 329 | 3866 | |
| International Journal of Fatigue | 256 | 3659 | |
| International Journal of Plasticity | 91 | 3446 | |
| International Journal of Refrigeration | 231 | 3430 | |
| Advanced Robotics | 663 | 3426 | |
| IEEE/ASME Transactions on Mechatronics | 170 | 3352 | |
| The International Journal of Robotics Research | 91 | 3203 | |
| SOUTH KOREA | Journal of Materials Processing Technology | 781 | 11124 |
| International Journal of Heat and Mass Transfer | 577 | 10543 | |
| Journal of Sound and Vibration | 535 | 7246 | |
| Journal of Micromechanics and Microengineering | 467 | 6581 | |
| Journal of Mechanical Science and Technology | 2285 | 6295 | |
| International Journal of Precision Engineering and Manufacturing | 1071 | 4875 | |
| International Journal of Refrigeration | 249 | 3727 | |
| The International Journal of Advanced Manufacturing Technology | 459 | 3459 | |
| Energy | 265 | 3391 | |
| International Journal of Plasticity | 83 | 3187 | |
| International Journal of Machine Tools and Manufacture | 162 | 3088 | |
| International Journal of Solids and Structures | 197 | 3086 |
5. CONCLUSION
The idea behind studying the publication output is to understand the growth of the mechanical engineering publications amongst the three countries which have a common footing. The publications in the field of mechanical engineering from India, Japan and South Korea have been analysed. Price connected the size of science and time in terms of scientific growth. India and South Korea prove his model of doubling time, in fact India being in the forefront which has greatly increased its scientific activities in mechanical engineering. The study suggests the need to increase the pace of Japanese research in mechanical engineering as there is decline in the publications. This may indicate that India can earn significant competitive advantages in the area of mechanical engineering. Japan's contributions were superior in the beginning, i.e., 2000 and there was a downtrend as the years passed by, with South Korea showing rise and decline with the time. India's research was on the upward trend, with a small downtrend in the middle. Japan scores high in terms of collaborativeness amongst authors. Articles published by researchers in Japan and South Korea preferred to work in large groups. In India, researchers are becoming more and more aware of the importance of collaboration. The study did indicate that the collaboration is on the upward trend with the time.
The analysis of most preferred publications may help, especially new generations of scholars, to get an overview of important publications in the area of mechanical engineering. The study demonstrates the strength of a scientometric analysis to investigate a field of interest. As demonstrated, the results of the study are valuable for discussing and defining future research agendas in the area of mechanical engineering. As a continuation of this research work, the authors intend to do further analyses to identify the important stakeholders in the field of mechanical engineering. In the nutshell, the study Japan’s achievements are higher than the other two countries, i.e., India and South Korea, as far as mechanical engineering is concerned.
- Submission Date
- 2017-04-12
- Revised Date
- Accepted Date
- 2017-06-01
- Downloaded
- Viewed
- 0KCI Citations
- 0WOS Citations