ISSN : 2287-9099
Altmetrics: Factor Analysis for Assessing the Popularity of Research Articles on Twitter

Jin-Cheon Na (Wee Kim Wee School of Communication and Information, Nanyang Technological University)

Bhargavi Veeramachaneni (Wee Kim Wee School of Communication and Information, Nanyang Technological University)

Rashmi Vishwanath Boothaladinni (Wee Kim Wee School of Communication and Information, Nanyang Technological University)

Abstract
Altmetrics measure the frequency of references about an article on social media platforms, like Twitter. This paper studies a variety of factors that affect the popularity of articles (i.e., the number of article mentions) in the field of psychology on Twitter. Firstly, in this study, we classify Twitter users mentioning research articles as academic versus non-academic users and experts versus non-experts, using a machine learning approach. Then we build a negative binomial regression model with the number of Twitter mentions of an article as a dependant variable, and nine Twitter related factors (the number of followers, number of friends, number of status, number of lists, number of favourites, number of retweets, number of likes, ratio of academic users, and ratio of expert users) and seven article related factors (the number of authors, title length, abstract length, abstract readability, number of institutions, citation count, and availability of research funding) as independent variables. From our findings, if a research article is mentioned by Twitter users with a greater number of friends, status, favourites, and lists, by tweets with a large number of retweets and likes, and largely by Twitter users with academic and expertise knowledge on the field of psychology, the article gains more Twitter mentions. In addition, articles with a greater number of authors, title length, abstract length, and citation count, and articles with research funding get more attention from Twitter users.
- keywords
- altmetrics, twitter metric, factor analysis, negative binomial regression
1. INTRODUCTION
Our humanity’s growth depends on how science can contribute to educate, innovate, and build at all levels of society, satisfying human needs and improving living standards. According to Boskin and Lau (1994), introducing new technologies accounts for 30% to 50% of economic growth. As academic research is of greater importance in this digital revolution and research work develops consistently, the necessity to recognize high-quality research articles is amplifying.
Traditionally, citation analysis, a research area of bibliometrics, is applied to evaluate the quality and popularity of research papers. Citation analysis measures the impact of an article by counting the number of times that the article has been cited by other works, and an article with more citation count is considered as a highly qualified, popular, and impactful document. However, citation count and traditional metrics such as journal impact factor and h-index are based on scholarly output alone, and are increasingly failing to keep pace with the new ways that researchers can generate impact in today’s digital world. Especially, these metrics do not recognize non-scholarly and other online uses of an article in today’s digital environment. Therefore, in conjunction with conventional citation impact metrics, altmetrics are used to measure research impact. Altmetrics aim to gauge web-based scholarly discussions, essentially how research is tweeted, blogged about, discussed, or bookmarked (Thelwall, Haustein, Lariviere, & Sugimoto, 2013; Trueger et al., 2015). These non-traditional metrics help to measure the reach of scholarly work through social media activity.
Twitter is often used for altmetrics studies because of its popularity and ease of data extraction (Thelwall, Tsou, Weingart, Holmberg, & Haustein, 2013). According to Thelwall et al. (2013), Twitter is the most live and active social media platform for sharing scientific works. Thus Twitter is chosen as a social media platform in this study. The retweet is a key mechanism for information diffusion on Twitter. URLs and hashtags in tweets have a stronger relationship with retweeting as a part of content features, while follower counts of Twitter users are part of the contextual feature (Suh, Hong, Pirolli, & Chi, 2010). Weng, Lim, Jiang, and He (2010) explained the impact of friends on Twitter, where both users follow each other as they share a common topic of interest leading to a Twitter list.
Medicine, health, and social science related fields have received a greater amount of online activity or attention compared to others, indicating larger public interest in these fields. Previous studies indicated that medical and health-related articles are among the most widely shared articles on social media (Hassan et al., 2017; Zahedi, Costas, & Wouters, 2014). In addition, Htoo and Na (2017) mentioned that psychiatry, clinical psychology and political science are the most promising disciplines with a higher correlation between altmetrics and citation count, and numerous bibliometric and scientific studies assessed psychological and behavioural research trends (Ho & Hartley, 2016; Piotrowski, 2017). As psychology is one of the popular health-related disciplines discussed widely on social media by common users, it is chosen as the field of study in our research.
This study aims to analyse various Twitter and article level factors that affect the popularity of articles in the field of psychology on Twitter. The Twitter factors include the following ones accumulated for each article mentioned on Twitter: the number of followers, number of friends, number of status, number of lists, number of favourites, number of retweets, number of likes, ratio of academic users, and ratio of expert users. The article factors include the number of authors, title length, abstract length, abstract readability, number of institutions, citation count, and availability of research funding. Using a regression approach, these Twitter and article factors as independent variables are analysed to determine how these attributes contribute to the number of article mentions on Twitter as a dependant variable.
To the best of our knowledge, no research work has analysed how Twitter factors affect the popularity of articles on Twitter. So we would like to fill this research gap by examining both Twitter factors and article factors that contribute to the dissemination of research articles. The objective of this research is to answer the following question: What are the Twitter and article factors that contribute to the popularity of research articles on Twitter?
In the following sections, Section 2 discusses related work, and Section 3 describes data collection process and challenges involved. Section 4 explains the method for the classification of Twitter users mentioning research articles as academic versus non-academic users and experts versus non-experts, and reports experimental results. Section 5 discusses Twitter and article factor analysis using regression techniques. Section 6 concludes the paper and discusses limitations and future work regarding the study.
2. RELATED WORK
2.1. Scholarly Communication on Twitter
Rowlands, Nicholas, Russell, Canty, and Watkinson (2011) analysed the regular use of social media by researchers, and reported that many scholars joined social media sites that were integrated into their daily scientific practices, and they wanted to know how much of their work had caused an impact on society. According to the Faculty Focus report, more than 35% of surveyed faculty members used Twitter (Bart, 2010). Therefore, Twitter provides an easy communication channel between researchers and the public, either for educational purposes or dissemination of research articles to wider audiences (Vainio & Holmberg, 2017).
Twitter is often used for scholarly communication studies because of its popularity and ease of data extraction (Thelwall, Tsou, Weingart, Holmberg, & Haustein, 2013). For instance, Holmberg and Thelwall (2014) did research to understand the usage of Twitter by researchers for scholarly communication. To figure out the variation among different user types, they conducted an extensive content analysis of tweets from researchers in different disciplines and found that researchers were inclined to share more links and retweet more than average Twitter users, and there were significant disciplinary differences in how they used Twitter. In addition, Yu (2017) reported that research users’ tweets had a greater correlation with citation count than general user groups because researchers who disseminate, discuss, and comment on research products will be more likely to cite them, while the public is more likely to use research products for educational and entertainment purposes.
2.2. Text Classification
Aisopos, Tzannetos, Violos, and Varvarigou (2016) compared various machine learning algorithms for sentiment classification and identified the best performance factors, such as the optimal size of n-gram, and logistic regression achieved the highest accuracy compared to support vector machine (SVM) and naïve Bayes multinomial classifiers. They observed a decrease in performance of all classification techniques when the size of n-gram increased from 3 to 5. Alom, Carminati, and Ferrari (2018) conducted classification of spam accounts in Twitter using seven machine learning algorithms, i.e., k-NN, decision tree, naïve Bayes, logistic regression, random forest, SVM, and XG boost classifiers, and experimental results showed that the performance of random forest and XG boost classifiers were better than the other classifiers. Wang, Li, and Zeng (2017) showed that XG boost classifier yielded the highest accuracy of 97% with reduced training time with the selected features, compared to SVM accuracy of 95% in the classification of Android malware.
Wei, Qin, Ye, and Zhao (2019) reported that convolution neural networks (CNN) classifier achieved an accuracy of 92.89%, which is higher precision than SVM classifier for text classification of the large training dataset. They also reported that self-trained word embedding of training data outperformed pre-trained Glove word embedding due to Glove word embedding being too general. Yao, Mao, and Luo (2018) also stated that CNN with word embedding produced an improved F1-score because word embedding contains more semantic information that is important for text classification.
The first stage of this study aims to classify Twitter users mentioning articles as academic versus non-academic users and experts versus non-experts using various machine learning algorithms, such as naïve Bayes, logistic regression, SVM, random forest, XG boost, basic neural network, CNN, and long short-term memory (LSTM), and we classify all the Twitter user data using the best model.
2.3. Factor Analysis
Previous studies analysed articles’ attributes in order to investigate the way scientific work receives attention through academic literatures. For instance, compared to unstructured abstract content, articles with structured abstracts and readable content get more citations (Hartley & Sydes, 1997), whereas research papers with longer titles and less information receive fewer citations (Haslam et al., 2008). In addition, the country and institutional prestige of authors have a large impact, as the institutions of higher status employ the best researchers (Baldi, 1998), so greater attention is given to the work carried out by the authors from recognised institutions. Funded research articles from competitive grants have higher citation impact than unfunded research ones (Cronin & Shaw, 1999). Moreover, papers written by multiple authors take advantage of the strengths of individual authors and tend to have more influence on citation factor (Smart & Bayer, 1986). Excellent writing skills may be also important to get more attention from other researchers.
Count data indicate the number of incidences in a fixed period (e.g., the number of Twitter users who have mentioned an article). In the cases in which the outcome variable is a count number with arithmetic mean less than 10, ordinary least square may produce a biased result, and Poisson regression is an appropriate model if the dependent variable is a count number (Coxe, West, & Aiken, 2009). Poisson regression is a generalized linear model where the predicted values are natural logarithms of the count data. When the variance exceeds the mean, it is referred to as overdispersion. Two variants of the Poisson model address the problem of overdispersion. Poisson regression assumes that the mean is equal to the variance. When the variance is greater than the mean, a negative binomial regression model is appropriate.
Didegah, Bowman, and Holmberg (2018) used a negative binomial-logit hurdle model to perform a factor analysis of twelve article factors across different altmetrics platforms such as Mendeley, Twitter, Facebook, blogs, and newspapers. The hurdle model was used to handle a negative binomial part that models the positive non-zero observations and a binary (or logit) part that models the zero observations. The factors include journal impact factor, individual collaboration, international collaboration, institution prestige, country prestige, research funding, abstract readability, abstract length, title length, number of cited references, field size, and field type. They reported that journal impact factor and international collaboration are the two factors that significantly associate with increased citation counts and with all altmetric scores, including increased Twitter posts. However, they did not analyse how social media factors (i.e., Twitter factors) affect the popularity of articles on Twitter.
In this paper, we use a negative binomial regression model to perform a factor analysis of nine Twitter factors (the number of followers, number of friends, number of status, number of lists, number of favorites, number of retweets, number of likes, ratio of academic users, and ratio of expert users) and seven article factors (the number of authors, title length, abstract length, abstract readability, number of institutions, citation count, and availability of research funding). The majority of previous analysis studies used simple linear regression for assessing the factors, which might produce a misleading conclusion in identifying significant factors.
3. DATA COLLECTION
In this study, all the research articles published in 2017 from the top 20 journals in the field of psychology were targeted. The top 20 journals, indexed by Science Citation Index Expanded, were selected using their 2017 journal impact factors. The extraction of the articles was based on the International Standard Serial Numbers of the top 20 journals from Web of Science (WoS), the largest scientific citation indexing database. A total of 4,457 articles were retrieved from the top 20 journals. Then, we obtained 2,078 Altmetric IDs by using these articles’ DOIs (Digital Object Identifier) and Altmetric API ( http://api.altmetric.com/v1/doi/). The articles without Altmetric IDs were filtered out. Subsequently, the Altmetrics IDs were used to obtain tweets mentioning these articles from Altmetric ( https://www.altmetric.com/), which is a service provider for altmetrics data. As a result, a total of 19,471 Twitter user records were collected. The Twitter users without descriptions were filtered out, and an English language detection tool was used to remove Twitter users with non-English descriptions. The final dataset consists of 15,007 distinct Twitter user profiles with additional Twitter attributes like Twitter ID, description, followers count, friends count, status count, listed count, favourites count, retweet count, and like count. The summary of the collected data is shown in Table 1.
4. CLASSIFICATION OF TWITTER USERS
It is important to know how journal articles are discussed and shared by various categories of Twitter users in Twitter. Hence, we categorize Twitter users mentioning articles into academic versus non-academic users and experts versus non-experts using a machine learning approach. Then the user profile information (i.e., the ratio of academic users and ratio of expert users for each article) is used as independent variables with other Twitter factors when building a regression model to determine the number of Twitter mentions of an article.
4.1. Data Preparation
From 15,007 records with English Twitter descriptions, 2,064 records were taken for labelling academic versus non-academic users, and an additional 1,999 records for expert versus non-expert labelling. Each record was manually labelled by two coders. Twitter users (i.e., user descriptions) are labelled as ‘Academic user’ if they fall under any of the following categories: researchers, students, professors, universities, research institutes, research team and groups, publishers, librarians, and libraries. The users are classified as ‘Non-academic user’ if they fall under any of the following categories: private personnel, software and IT professionals, private institutes, non-governmental organization groups, commercial firms, journalist, the public, and others (Htoo & Na, 2017). If the number of ‘Academic user’ related word occurrences is greater than the number of ‘Non-academic user’ related words, then the user is tagged as ‘Academic user’ and vice versa. For example, when the user description is “IT professional, part-time researcher, student,” the user is tagged as ‘Academic user.’
The users are labelled as ‘Expert’ if they fall under any of the following categories: researchers, publishers, and individuals who work or study in psychology or psychiatric related areas such as psychiatry, neuroscience, trauma, and bipolar. The users are classified as ‘Non-expert’ if they fall under the following categories: work or study in fields that are not related to psychology such as computer science, mechanical, electrical, chemical, mathematical, and other areas. If the number of ‘Expert’ related word appearances are more than the number of ‘Non-expert’ related words, then the user is tagged as ‘Expert’ and vice versa. For example, when the user description is “psychologist, specialized in psychotherapy,” the user is tagged as ‘Expert.’
Inter-coder reliability was measured to test the consistency and validity of the labelled data of two independent coders, and Cohen’s kappa values for academic versus non-academic users and experts versus non-experts are 93.4% and 94.2%, respectively. Table 2 shows the distribution of academic versus non-academic users and expert versus non-expert labelled data.
In this study, as part of data preprocessing for the user description text, we replaced contractions, performed tokenization, and applied various preprocessing techniques such as converting words to lowercase, and removing punctuations, special characters, non-ASCII words, emoticons, and stop words. In general, removal of these noise features improves the efficiency of the classifiers, and stemming does not significantly affect the accuracy performance (Hidayatullah, Ratnasari, & Wisnugroho, 2016). Therefore, stemming was not performed during the data preprocessing.
4.2. Methodology and Results
In this study, various machine learning algorithms were experimented to classify the Twitter users as academic versus non-academic users and experts versus non-experts in the field of psychology. Before applying any transformation to the dataset, we put 75% of the dataset into training set, and the rest of the dataset into test set. Stratification method was used to make the training and test sets have the same proportions of class labels.
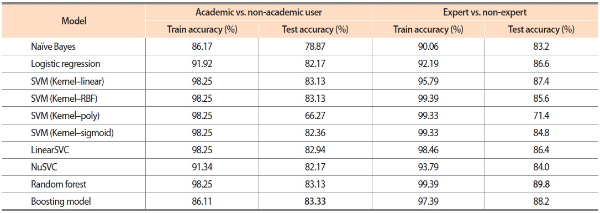
Initially, feature extraction was applied to convert each input text to a feature set vector. Afterward, among traditional machine learning algorithms, naïve Bayes and logistic regression classification models were used in which naïve Bayes provided lower accuracy over logistic regression. In SVM classification, we experimented with various parameters in four different kernels, i.e., linear, radial basis function (RBF), poly, and sigmoid. The performance results of all the SVM classifiers were similar, but SVM classifiers with linear and RBF kernels performed better than SVM classifiers with poly and sigmoid kernels. We also experimented LinearSVC and NuSVC classifiers, which resulted in similar performance to other SVM classifiers. In addition, we experimented random forest and boosting models in our classification where both models outperformed the other machine learning algorithms. The results of the machine learning algorithms are shown in Table 3.
Table 3.
Accuracy of traditional machine learning models
SVM, support vector machine; RBF, radial basis function.
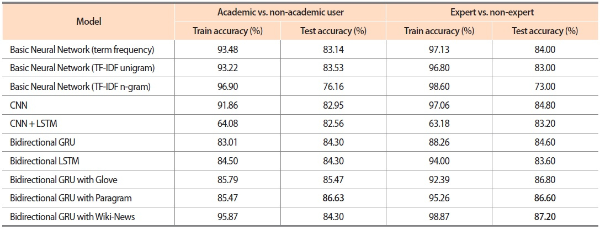
To increase the accuracy of the classification task, we also implemented deep learning algorithms. Among various deep learning approaches, first, we experimented with basic neural network models with different input features, i.e., term frequency (TF), TF-inverse document frequency (TF-IDF) unigram, and TF-IDF n-gram features. Our results showed that the performance of the model with TF-IDF n-gram input was lower and it was overfitting compared to the other models. Later, we continued our experiments by implementing CNN with word embedding layer and it gave satisfying results. Then we combined the LSTM model with CNN to improve the predictive power (Kim & Kim, 2019). However, the fusion of CNN with LSTM underperformed the CNN model. Therefore, we further implemented bidirectional Gated Recurring Units (GRU) and LSTM approaches. From our findings, bidirectional GRU and LSTM models yielded better accuracy compared to the CNN model. Finally, we also used pre-trained vectors, i.e., Glove, Paragram (Wieting et al., 2015), and Wiki-News (Mikolov et al., 2018) with bidirectional GRU since deep learning models with pre-trained vectors generally perform better with reduced computation time (Yao et al., 2018). We attained the best performance using the bidirectional GRU models with pre-trained vectors compared to other deep learning approaches. To avoid the problem of overfitting, the cyclic learning rate was used in all the neural network models. Classification accuracies of the deep learning techniques are shown in Table 4.
Table 4.
Accuracy of deep learning models
TF-IDF, term frequency inverse document frequency; CNN, convolution neural networks; LSTM, long short-term memory; GRU, Gated Recurring Units.
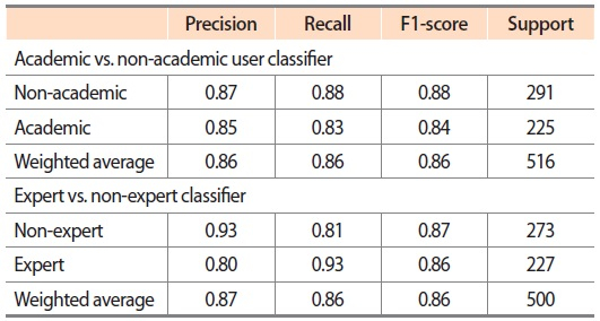
As the bidirectional GRU model with Paragram performed well in both academic versus non-academic user and expert versus non-expert classification tasks, it was used as the final classifier model to categorize the unlabelled Twitter users. Table 5 shows the test precision, recall, and F1-score of the bidirectional GRU model with Paragram. Accuracy, precision, recall, and F1-score are measured using the following formulas:
5. FACTOR ANALYSIS USING REGRESSION
5.1. Data Preparation
With the classification models, we classified all the Twitter users mentioning collected articles as academic versus non-academic and expert versus non-expert users, and prepared the ratio of academic users and ratio of expert users for each article, which are independent variables for the regression model. In addition, we prepared the median and maximum number of followers, lists, status, friends, and favourites (the minimum value of these factors was not considered to reduce the total number of factors), and the minimum, median, and maximum number of retweets and likes for each article. For instance, for each article, the maximum number of followers was extracted from all the Twitter users who mentioned the article. Table 6 describes Twitter factors used for regression. Also, as shown in Table 7, article factors were collected for each article. As the dependent variable of the model is the number of Twitter mentions of an article, a count regression model is appropriate. If any of the factors has a variance that is orders of magnitude larger than others, it might govern the other factors and make the estimator unable to learn from other factors correctly as expected. So standardization (or feature scaling) of the independent variables was performed to normalize the range of their values.
Table 7.
Article factors for regression

WoS, Web of Science; ASL, average sentence length; ASW, average number of syllables per word.
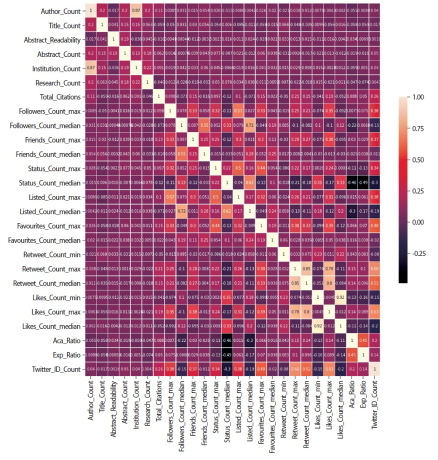
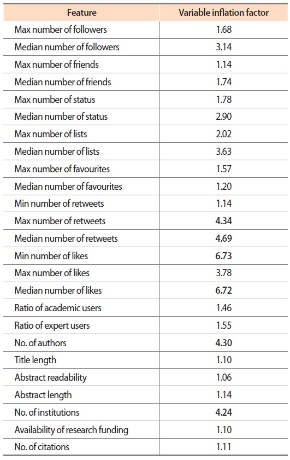
Multi-collinearity is the measure of linear dependence between the two variables. Using a correlation matrix shown in Fig. 1, it was inferred that the minimum number of likes and median number of likes count are highly correlated by 92%. The number of authors and number of institutions are correlated by 87%, the maximum number of retweets and median number of retweets are correlated by 85%, and the median number of retweets and maximum number of likes are correlated by 80%. In addition, based on variance inflation factor values shown in Table 8, the minimum number of likes, median number of likes, median number of retweets, maximum number of retweets, number of authors, and number of institutions are highly correlated factors. So some of the highly correlated factors were removed (i.e., median number of retweets, median number of likes, and number of institutions), and we built a regression model with the remaining factors.
5.2. Fitting the Model and Results
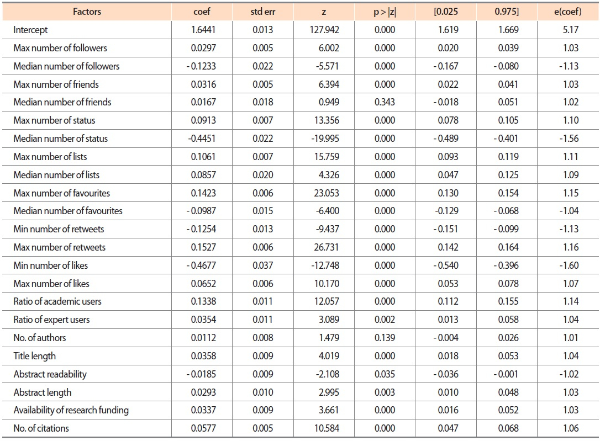
In this study, negative binomial (NB) regression that is the generalization for Poison regression was used for factor analysis. In the cases where the variance is greater than the mean, NB regression is proved to be a better fit (Didegah et al., 2018). The negative binomial distribution uses a positive dispersion parameter, alpha, to specify the extent to which the distribution’s variance exceeds the mean. The variance can be described by the following equation: σ2= μ + αμ2. From the equation, we see that when alpha (α) tends toward zero value, the variance (σ2) approaches the mean (μ). In the NB regression model, the continuous positive dispersion parameter was adjusted to 0.01. The statsmodels documentation suggests that a value in the range of 0.01 to 2 is permissible. The results of the NB regression model for predicting a Twitter mention count for each article are presented in Table 9. The NB regression model shows that all factors except for the median number of friends, number of authors, and abstract readability are significant factors at the 0.01 level to determine the Twitter mention count.
As shown in the “e(coef)” column of Table 9, the maximum number of retweets increases the number of Twitter mentions by 16%. In other words, a unit change in the maximum number of retweets contributes to 16% increased Twitter mentions. Thus, the popularity of the article is mainly increased by a particular tweet with the maximum retweet count. On the other hand, the minimum number of retweets contributes to a 13% decrease in Twitter mentions, so it is better to have a small minimum retweet count to increase the chances of the article to get popular. From these results, we may say that the popularity of an article is determined by the most popular tweet that is retweeted many times by users.
The maximum number of likes and maximum number of favourites are also associated with increased Twitter mentions, and a unit change in the maximum number of likes and maximum number of favourites contributes to 7% and 15% increases in Twitter mentions, respectively. These results indicate that if a research article is mentioned by a tweet or tweeter that is liked or favoured by many users, there is a high chance for the article to get popular. Moreover, the maximum number of status (10%), maximum number of lists (11%), and maximum number of followers (3%) are associated with increased Twitter mentions. Hence, if an article is mentioned by influential Twitter power users who have large status, list, and follower counts, it increases the popularity of the article. However, the minimum number of likes (-60%), median number of favourites (-4%), median number of status (-56%), and median number of followers (-13%) are negatively correlated with the Twitter mentions, whereas median number of lists count (9%) is positively correlated. In general, the popularity of an article is mainly increased by the maximum values of Twitter factors, which represent a popular tweet or a Twitter power user out of all the tweets or tweeters that mentioned the article.
The ratios of academic and expert Twitter users are associated with increased Twitter mentions. A unit change in the ratios of academic and expert Twitter users contributes to 14% and 4% increased Twitter mentions, respectively. Therefore, if a research article is mentioned largely by academic and expert users who have in-depth knowledge about the psychology discipline, the article gains more attention from other Twitter users.
For the article factors, the number of authors (1%), title length (4%), abstract length (3%), number of citations (6%), and availability of research funding (3%) are associated with increased Twitter mentions. These results represent that articles with longer titles and abstracts receive more attention than articles with shorter titles and abstracts. In addition, articles with a greater number of citations receive more attention than articles with fewer citations. Articles with a larger number of authors receive more attention compared to articles with fewer authors. The availability of research funding increases the number of Twitter mentions by 3%. However, abstract readability (-2%) is negatively correlated with Twitter mentions. We noted that these results are largely in line with ones reported in Didegah et al. (2018), and apart from the Twitter factors, the article factors also play a major role for increased Twitter mentions.
Overall results depict that Twitter users with a greater number of friends, status, favourites, and lists, tweets with a large number of retweets and likes, Twitter users with academic and expertise knowledge in the field of psychology, articles with a greater number of authors, title length, abstract length, and citation count, and articles with research funding contribute significantly in increasing the popularity of research articles.
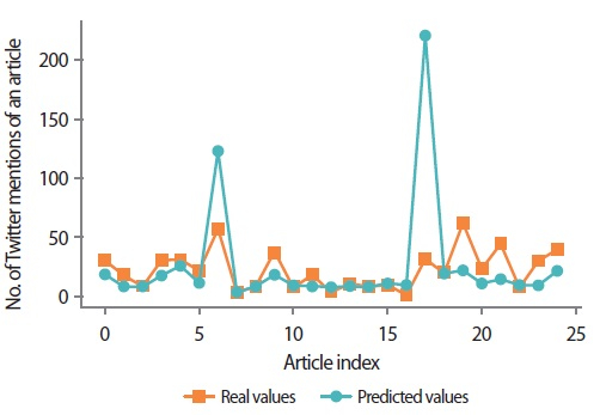
Fig. 2 shows the plot between the fitted values and actual values for the first 25 articles. The model seems to have a good fit except for a few articles (i.e., articles 6 and 17; article index starts with 0).
6. CONCLUSION
This paper studied a variety of factors that may affect the popularity of articles (i.e., the number of article mentions) in the field of psychology on Twitter, and endeavoured to answer the proposed research question: What are the Twitter and article factors that contribute to the popularity of research articles on Twitter? As results, if a research article is mentioned by Twitter users with a greater number of friends, status, favourites, and lists, by tweets with a large number of retweets and likes, and largely by Twitter users with academic and expertise knowledge in the field of psychology, the article gains more Twitter mentions. In addition, articles with a greater number of authors, title length, abstract length, and citation count, and articles with research funding get more attention from Twitter users. We believe that the findings from this study will contribute to help researchers to understand how (or why) an article gets attention from Twitter users. In addition, it will help research policy makers to interpret the meaning of the Twitter metric score, i.e., the number of Twitter mentions of an article.
Nonetheless, there are several limitations in this study. First, this study included only seven article factors, i.e. the number of authors, title length, abstract length, abstract readability, availability of research funding, institution prestige and the number of citations for an article. We plan to include more article factors such as journal impact factor, field size, and field type in future study. Second, this study focused solely on investigating in the field of psychology, so our findings might be biased toward the field of psychology. Therefore, future research will involve other additional disciplines and examine differences among these disciplines. Third, the scope of this study was confined to tweets (or Twitter users) in English. In future study, we would look at tweets in other languages to generalize the findings of this study.
References
, Aisopos, F., Tzannetos, D., Violos, J., & Varvarigou, T. (2016). Using N-gram graphs for sentiment analysis: An extended study on Twitter. In , 2016 IEEE Second International Conference on Big Data Computing Service and Applications (BigDataService), (pp. 44-51). Oxford: IEEE., , Using N-gram graphs for sentiment analysis: An extended study on Twitter., In 2016 IEEE Second International Conference on Big Data Computing Service and Applications (BigDataService), (2016), Oxford, IEEE, 44, 51
, Alom, Z., Carminati, B., & Ferrari, E. (2018). Detecting spam accounts on Twitter. In , 2018 IEEE/ACM International Conference on Advances in Social Networks Analysis and Mining (ASONAM), (pp. 1191-1198). Barcelona: IEEE., , Detecting spam accounts on Twitter., In 2018 IEEE/ACM International Conference on Advances in Social Networks Analysis and Mining (ASONAM), (2018), Barcelona, IEEE, 1191, 1198
Twitter usage among college faculty is on the rise. () (Retrieved November 28, 2019) Bart, M. (2010). Twitter usage among college faculty is on the rise. Retrieved November 28, 2019 from https://www.facultyfocus.com/articles/edtech-news-and-trends/twitterusage-among-college-faculty-is-on-the-rise. , from https://www.facultyfocus.com/articles/edtech-news-and-trends/twitterusage-among-college-faculty-is-on-the-rise
, Boskin, M. J., & Lau, L. J. (1994). , The contributions of R&D to economic growth: Some issues and observations, . Paper presented at Joint American Enterprise Institute: Brookings Institution Conference on the Contribution of Research to the Economy and Society, Washington, DC, USA., , The contributions of R&D to economic growth: Some issues and observations., Paper presented at Joint American Enterprise Institute: Brookings Institution Conference on the Contribution of Research to the Economy and Society, (1994), Washington, DC, USA
, Mikolov, T., Grave, E., Bojanowski, P., Puhrsch, C., & Joulin, A. (2018). , Advances in pre-training distributed word representations, . Paper presented at the International Conference on Language Resources and Evaluation (LREC 2018), Miyazaki, Japan., , Advances in pre-training distributed word representations., Paper presented at the International Conference on Language Resources and Evaluation (LREC 2018), (2018), Miyazaki, Japan
, Suh, B., Hong, L., Pirolli, P., & Chi, E. H. (2010). Want to be retweeted? Large scale analytics on factors impacting retweet in Twitter network. In , 2010 IEEE Second International Conference on Social Computing, (pp. 177-184). Minneapolis, MN: IEEE., , Want to be retweeted? Large scale analytics on factors impacting retweet in Twitter network., In 2010 IEEE Second International Conference on Social Computing, (2010), Minneapolis, MN, IEEE, 177, 184
, Wang, J., Li, B., & Zeng, Y. (2017). XGBoost-based Android malware detection. In , 2017 13th International Conference on Computational Intelligence and Security (CIS), (pp. 268-272). Hong Kong: IEEE., , XGBoost-based Android malware detection., In 2017 13th International Conference on Computational Intelligence and Security (CIS), (2017), Hong Kong, IEEE, 268, 272
Empirical study of deep learning for text classification in legal document review. arXiv:1904.01723. (, , , ) ((2019)) Wei, F., Qin, H., Ye, S., & Zhao, H. (2019). Empirical study of deep learning for text classification in legal document review. arXiv:1904.01723. doi:10.1109/BigData.2018.8622157. , doi:10.1109/BigData.2018.8622157
, Weng, J., Lim, E. P., Jiang, J., & He, Q. (2010). TwitterRank: Finding topic-sensitive influential Twitterers. In , Proceedings of the Third ACM International Conference on Web Search & Data Mining, (pp. 261-270). New York: ACM., , TwitterRank: Finding topic-sensitive influential Twitterers., In Proceedings of the Third ACM International Conference on Web Search & Data Mining, (2010), New York, ACM, 261, 270
, Yao, L., Mao, C., & Luo, Y. (2018). Clinical text classification with rule-based features and knowledge-guided convolutional neural networks. In , 2018 IEEE International Conference on Healthcare Informatics Workshop (ICHI-W), (pp. 70-71). New York: IEEE., , Clinical text classification with rule-based features and knowledge-guided convolutional neural networks., In 2018 IEEE International Conference on Healthcare Informatics Workshop (ICHI-W), (2018), New York, IEEE, 70, 71
- Submission Date
- 2019-09-20
- Revised Date
- Accepted Date
- 2019-11-16
- 582Downloaded
- 1,851Viewed
- 0KCI Citations
- 0WOS Citations


