ISSN : 2287-9099
Analysis of Library Website Users’ Behavior to Optimize Virtual Information and Library Services

Abstract
The purpose of this work was to study library website users’ actions by tracking their behavior, determining popular content, and identifying browsing patterns and subsequent improvement of access to popular content. The study of behavior models and the use of web analytics has led to the emergence of solutions that improve the usability and functionality of the State Public Scientific-Technological Library of the Siberian Branch of the Russian Academy of Sciences (SPSTL SB RAS) website. These are: identifying user tasks as they are developed, conducting user testing to better understand the event. tracking data and collecting additional data to verify the effectiveness of the changes made. Examining data on the duration of the session and the number of visits will help determine the goals of user visits and develop new recommendations. Usability analysis and testing will make it possible to compare the data obtained using web analytics and the perception of the library site by the users themselves. Recommendations are offered to libraries on the use of data on the real behavior of the target audience of the library website to improve access to library resources and services, increase their relevance and improve information services.
- keywords
- study of website users, user behavior, web analytics, browsing patterns, library website, event tracking
1. INTRODUCTION
Like most of the websites of academic libraries, the State Public Scientific-Technological Library of the Siberian Branch of the Russian Academy of Sciences (SPSTL SB RAS) website is a center for digital distribution, a search portal for a variety of electronic resources and services, and the main gateway for virtual users. The library website is the main tool (mechanism) of virtual information services, and since it represents the library in the information environment, its development and support and use of state-of-the-art technologies is one of the most crucial tasks for specialists in the maintenance of the SPSTL SB RAS website.
The design and navigation ability of a library website is considered to be one of the main elements influencing its popularity and use. The website becomes more visible and accessible when a user-oriented model is adopted in its development and implementation. To make the website use easier, its navigation shall support users’ behaviors based on their navigation patterns. The main task of the management team is to create a customized library website that allows users to carry out their tasks quickly and efficiently. When the website was created, the user patterns were yet unknown. The menu and links on the main page were chosen by the librarians. To save user time and make website browsing easier, it is necessary to explore the user patterns. We can get an idea of user behavior by defining these patterns to understand which content is the most popular, and then improve the navigation through it.
Specialists involved in maintenance of the SPSTL SB RAS website are interested in using resources and services posted on it. So, it is necessary to analyze users’ behaviors on the website and study their browsing patterns. To do so, the SPSTL SB RAS specialists used Google Analytics and Yandex.Metrica web analytics tools. However, web analytics data does not show where users are going when they leave the library website. If they go to a domain that is not managed by the library, then the web tools will not show this data. For example, when users leave our website and go to licensed remote resources to which the library is subscribed, the web tools do not track it. There may be the impression that users simply left the website without finding anything necessary. According to Google Analytics reporting, the percentage of users leaving the website this way was about 50%.
Tracking user behavior using event tracking, the website management team of the SPSTL SB RAS made decisions that led to improved user interaction by moving the most popular resources to the main page and reducing the number of clicks needed to access them. In addition, the web team learned which subscription resources users are visiting most often.
The purpose of this study was to study the website user behavior using various tools and create recommendations on the use of data on library sites users’ behavior to improve access to library resources and services, increase their relevance, and improve information services.
2. BACKGROUND AND LITERATURE REVIEW
The importance of virtual information services for libraries is often mentioned in the published studies. The virtual environment provides interaction between the library and users, which “is becoming more and more complex, technologically equipped and mobile” (Yang & Dalal, 2015). Libraries are creating more resources and utilities for virtual information services, but at the same time these resources and utilities need to be optimized and promoted (Aharony, 2012; Redkina, 2014).
The researchers point out that the website navigation design will help optimize information support and improve access to resources and services. The goal of navigation design is to simulate user behavior to help them access the website resources and services (Vecchione, Brown, Allen, & Baschnagel, 2016). And, since libraries provide access to many services and resources, tracking the performance and understanding the user flow is critical to the success of library services (Yang & Perrin, 2014).
In recent years, a significant amount of research has been carried out aimed at studying user behavior. Researchers note that understanding how users act on websites will greatly facilitate the tasks of creating and maintaining websites. To improve virtual information services, the author considers it necessary to study the literature on user behavior in a virtual environment.
2.1. Study of an Individual Behavior in Virtual Space
Currently, scientists from psychological, computational, and engineering research areas have developed human-oriented behavioral informatics, characterized by methods for analyzing and coding human behavior. The publication of Belarusian scholars differentiates the concepts of “informational behavior,” “media behavior,” and “internet behavior,” discusses ways of studying the Internet behavior of individuals, and also presents the classification of Internet users (Esposito, Faundez-Zanuy, Morabito, & Pasero, 2019; Fablinova, 2015; Narayanan & Georgiou, 2013).
2.2. Behavior Patterns and Models
User behavior on websites is described by several models and patterns. The word pattern is used in various scientific disciplines and fields of activities. In psychology, a pattern refers to a specific set, pattern of behavioral reactions, or sequence of stereotypical actions; therefore, we can talk about patterns regarding any area where a person applies patterns (almost all of them). When users browse websites in searching for necessary information, they automatically apply a certain procedure. User behavior while browsing is described by the three most typical models: the F-pattern, the Gutenberg diagram, and the Z-pattern (Bradley, 2011; Gonçalves et al., 2013; Kotyak & Narizhnyi, 2016; Nielsen, 2006; Pernice, 2017; Pernice, Whitenton, & Nielsen, 2014).
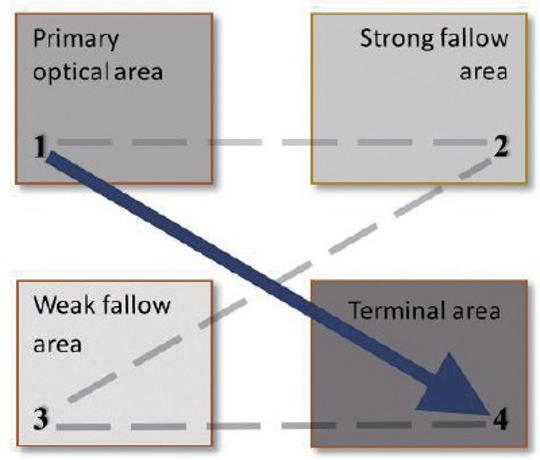
According to web design experts, the Gutenberg diagram is the pattern which best describes user behavior when browsing website pages. This pattern describes the model of user behavior when viewing information which they see on the screen. In further scrolling and going to the next pages, the model works according to the same principle (Fig. 1) (Kotyak & Narizhnyi, 2016).
Conditionally, the page is divided into 4 zones:
-
• Left upper: priority viewing area (primary optical area). This zone is the main user focus. This is where the most important information is placed—the logo and slogan. The text content is the first 2-3 words of the title.
-
• Top right: a well-viewed area, with a high potential for attracting attention (strong fallow area). After the priority viewing zone, the eyes horizontally move here. Attention has already been weakened, but is still quite concentrated—therefore, less important information is placed along the line of viewpoint movement and in the sector itself. If this is only text, then it is the entire title.
-
• Left bottom: minimum attention zone (weak fallow area). This is the least explored area—users do not particularly pay attention to the information posted here.
-
• Lower right: exit area, final area (terminal area). Here, the user makes a decision about making a target action, continuing to view or leave the website. Here it is recommended to place a call to action.
It is considered that user behavior is influenced by the habit of reading and studying text content from left to right (the user attention vector actually shifts diagonally from the priority viewing area to the exit area), as well as the natural gravity of reading (the glance instinctively shifts from top to bottom). At the same time, a study by Portuguese scientists found that visual patterns differ depending on the task to be performed (using search engines, online purchases, reviewing the website and information search), and not on the website where it is resolved (Pernice et al., 2014).
The vast majority of web users solve their problems as quickly as possible with minimal effort; they visit the website because they want to find a quick answer, and not to read a large text on the topic. If the website creators did not take any steps to direct the user to the most relevant, interesting, or useful information, users will find their own way (Rosenfeld, Morville, & Arango, 2015). In the absence of any signals that direct the viewpoint, they will choose the path of least resistance and most of the fixings will be near the place where they begin to read (which is usually the leftmost upper word on a text page).
A well-known and frequently cited study of user behavior patterns is the work of analysts from Booz-Allen & Hamilton and Nielsen//NetRatings (Rozanski Bollman, & Lipman, 2001). This study groups users by individual behavior at a certain point of time, and not by demography or psychography. This form of segmentation can be called an accident because it is based on what people do on the Internet in different cases. They found that four parameters were most significant in determining discrete behavior clusters:
-
• Session duration. Time that the user stays online.
-
• Page time. The average time a user spends on each page during a session.
-
• Category concentration. The percentage of time a user spends on websites belonging to the most visited category. For example, if at a 10-minute session, five minutes were spent on sports websites, three minutes on news websites and two minutes on entertainment websites, the concentration in the group will be 50 percent (category—sports websites).
-
• Website familiarity. The percentage of the total session time that a user spends on familiar websites identified as having been previously visited four or more times.
The study of click flow data, characteristics of the session of Internet users, revealed seven discrete segments based on the use of the Internet in various cases. A number of other studies show similar results (Choo, Detlor, & Turnbull, 2000; Kellar, Watters, & Shepherd, 2007; Morrison, Pirolli, & Card, 2001; Sellen, Murphy, & Shaw, 2002).
As a result of the study, seven types of behavior were identified:
-
• Quickies: a short duration of user sessions (about 1 minute); the average number of websites viewed is 1-2 (at the same time, the websites are familiar to the user, so it takes about 15 seconds to view one page);
-
• Just the Facts: average session duration is 9 minutes, and staying on the page does not exceed 30 seconds. Users search for specific information from well-known websites.
-
• Single Missions: the purpose of accessing the Internet is the solution to a specific issue or the search for specific information, the average session lasts 10 minutes, and visiting unfamiliar websites belonging to a category is typical. The stay duration on the page is 1.5 minutes;
-
• Do It Again: user session duration is about 14 minutes, there is a high duration of page viewing (2 minutes), and in 95% of cases, the time is spent on websites that have been visited at least four times. These cases are rarely associated with searches, because users know exactly where they want to go;
-
• Loitering: average session length is 33 minutes, there is a high page viewing time (2 minutes), and the main purpose of accessing the Internet is leisure, news, games, and other entertainment;
-
• Information Please: high duration of sessions (37 minutes); the goal is in-depth study of any information; searching is conducted on many websites (about 20) which as a rule are well-known to users; time spent on the website is one minute. Users usually navigate between related websites without applying a search engine;
-
• Surfing: maximum session duration compared to other behavior models (70 minutes), visiting a large number of websites (about 45). The time spent on the page lasts about a minute and information is extensive, but superficial and shallow. As a rule, the websites visited are online stores, online communities, and news websites (Rozanski et al., 2001). The results of this study are still relevant, as scientists and practitioners in the promotion of Internet resources use them. It can be concluded that the types of user behavior in the Internet environment have not changed (Fablinova, 2015; Lindley, Meek, Sellen, & Harper, 2012; Ortiz?Cordova & Jansen, 2012; Smith, Kukulska-Hulme, & Page, 2012; Wakeling, 2015; Wilson & Mukhina, 2012).
2.3. Applying of User Behavior Information to Improve Service
In publications on librarianship, modeling user behavior is viewed as an element of a personalized environment. Personalization is defined as the way information and services can be adapted to meet the unique and specific needs of an individual or community(Callan et al., 2003). A user model is a data structure that represents user behavior and captures human factors (Frias?Martinez, Chen, & Liu, 2007).
Researchers are studying user interaction with electronic content to create a system of recommendations. User behavior is monitored by several indicators, which are subsequently used to submit recommendations (He & Zhang, 2016; Núñez-Valdez, Quintana, Crespo, Isasi, & Herrera-Viedma, 2018; Xu , 2017; Yi, Chen, & Cong, 2018).
Specialists of Yandex (a Russian transnational company that owns the search engine of the same name, Internet portals, and web services in several countries) conducted a study of behavioral factors and concluded that an in-depth study of user experience helps significantly improve the current search system and the existing ranking model (Tolstikov, Shakhray, Gusev, & Serdyukov, 2014).
Researchers from Korea University, Seoul say that the analysis of cognitive and behavioral user information in a distributed environment is necessary to create an adaptive user interface. In their work, they developed a customizable UI/UX interface based on user cognitive response and behavioral information in a distributed environment (Ji, Yun, Lee, Kim, & Lim, 2017).
2.4. Web Analytics Use
Librarians use web analytics methods to evaluate the effectiveness of remote library services. They monitor user behavior using web analytics and transaction analysis. It is noted that these methods are promising to evaluate the effectiveness of various servicing points and planning a number of measures to enhance the user experience in remote library services (Tobias & Blair, 2015).
Libraries apply Google Analytics to help redesign their website. Fang (2007), the librarian from the Rutgers-Newark Law Library, used Google Analytics for this purpose. His goal was to analyze user behavior on the website. Fang (2007) analyzed usage statistics before and after library redesigns to determine the redesign effectiveness.
Many articles on library website evaluation consist of surveys and using Google Analytics to determine the top pages of content. Researchers at the Technical University of Texas point out that understanding user needs and behavior on library websites is crucial to make a successful library website. According to them, a proper assessment of the needs and behavior of regular visitors to an academic library is significant for the process of library website design (Barba, Cassidy, De Leon, & Williams, 2013).
Scientists point out that researchers use Google Analytics to study user behavior, website performance, and web traffic, allowing website administrators to study the online experience of their users and improve it (Clark, Nicholas, & Jamali, 2014; Clifton, 2012).
The ability of Google Analytics to track website use makes it a powerful tool for monitoring online behavior. The information provided by Google Analytics is used to answer questions regarding the website evaluation and library services use (Yang & Perrin, 2014).
In Russia, Yandex.Metrica analytical system is also used. This is a system similar to Google Analytics, but with additional functionality (WebVisor, link map, click map, scrolling map, form analytics). It is used for web analytics of any site, both commercial and non-profit organizations. The link map shows the statistics of clicks on links on the site, the click map shows statistics on clicks on the site, the scrolling map shows how the attention of site visitors is distributed in certain areas of the page, and form analytics shows how visitors to the site interact with the forms. Yandex.Metrica allows understanding of how users consume content on the library website: which words or areas attract their attention, what resources are in great demand, where the portions with the most click density are, and drawing of conclusions about how popular are the sections which the library itself considers important. At the same time, researchers note what web analytics metrics can show, what users do, but they usually do not show why users do it—and this is the task for analysts themselves to explain their behavior (Udartseva & Rykhtorova, 2018).
Researchers use Yandex.Metrica and Google Analytics web analytical systems to build custom models (Rykhtorova & Udartseva, 2018). Google Analytics event tracking can help determine the bounce rate, which is a metric often used to make decisions about library websites. Using the event function in Google Analytics is useful because knowledge of events creates an analytics environment where “iterative changes can be tracked in real time with minimal effort” (Loftus, 2012; Turner, 2010). Iterative changes are needed in an ever-changing library system, where services change regularly, and therefore websites are to be reorganized or redesigned.
The literature review in the work of researchers from the Boise State University showed that event tracking was not carefully studied in libraries. In the work, they showed the possibility of events tracking to increase retention, reduce the failure rate, and measure the actual drop-out from the library website (Vecchione et al., 2016).
Analysis of visitor actions allows determination of which pages are visited most often, where users go further, and so on. Understanding user behavior on the website provides an opportunity to improve library visitor servicing through the website and increase satisfaction.
This literature review has shown that quite a lot of research has been devoted to tracking user behavior. But the behavior of Russian library website users has not been carefully studied. This article presents a case study in which the application of browsing patterns and the implementation of event tracking led to improvements achieved through this technology and data analysis. Through identifying and researching these methods, the researcher has found a useful and successful methodology that any library can use on its website to effectively track user flow and improve virtual information services.
3. METHODS
The author used the results of other studies to explore human behavior when browsing the website pages. The behavior of SPSTL SB RAS website users was studied from January 1 to August 31, 2018. All data on the behavior of SPSTL SB RAS website users was obtained by the author from the Google Analytics and Yandex.Metrica reports. Web analytics tools allowed the library to identify users, view, and track user paths and behavior. Viewing a stream of users through web analytics tools is useful because it graphically displays the user path from the login page through different pages to the exit page. The website visitors were notified of the application of their user data.
To optimize the page structure of the SPSTL SB RAS website, it was decided to use the Gutenberg diagram, since to date it is considered the most complete and logical model, and it has been proven that users when browsing the website pages behave according to the corresponding pattern. To study user behavior when viewing the SPSTL website pages, WebVisor, one of the Yandex.Metrica tools, was used, which allows visually showing how users are browsing pages. This tool made it possible to verify that when browsing the pages of the SPSTL SB RAS website, the user viewpoint is shifted to four zones.
To get an idea of the purpose for which visitors come to the website, we used the results of a research by analysts from Booz-Allen & Hamilton and Nielsen//NetRatings. The data of visits to the SPSTL SB RAS website were analyzed. These data allowed identifying the main types of user behavior on the SPSTL SB RAS website.
To improve user browsing patterns, popular content has been identified. For this purpose, web analytics data from Google Analytics and Yandex.Metrica was used. Popular content was revealed by viewing the actions of all website users. Popular content can be defined as the content that is most frequently accessed. Links that are clicked less than 0.05% are considered unpopular content, whereas all clicks more than 1% are considered popular.
To solve the problem of tracking users, understanding whether they leave the website completely or follow links to subscription-based remote resources, audience segmentation was carried out distributing it into groups with the same attributes. In this case, the following signs were selected:
-
• Actions on the website: to study the visitor actions following links to remote resources
-
• Login page: to explore the use of integrated services for authors
To understand the use of all (7) websites of SPSTL SB RAS, all domains were included in the Google Analytics toolbar, and the tracking code was placed on all websites. This gave an idea of the use of all websites of the SPSTL SB RAS. But this solution did not give a complete picture of the user paths, since the library is subscribed to a large number of remote resources, and users follow links to them, which in the reports is shown as a session interruption. To solve the problems of the impossibility of tracking behavior outside the website, the SPSTL SB RAS specialists implemented the method which uses Google Analytics for event tracking. It means a way of counting, measuring, and indicating how many times each particular event has occurred. We used event tracking to measure user behavior outside the library main website and show to which resources users were going from the library website. Based on the recommendation of Google Analytics, a unique Java script was written. It searches for all external links and changes the html code of the page in the user browser, and when clicking on a link, Google Analytics was first called, and then the user goes to the link. Thus we track their paths, not losing users.
4. RESULTS
4.1. Optimization of the Web-Pages Structure of the SPSTL SB RAS Website
In this paper, we studied the behavior of SPSTL SB RAS website users through web analytics. WebVisor, a tool of YandexMetrica, allows the following: seeing how website visitors behave, analyzing usability, and finding errors in structure and design. Using Webvisor player, it is possible to see the exact repetition of all visitor actions on the website: mouse movements, clicks, page scrolling, keystrokes and filling in forms, and highlighting and copying text. WebVisor records the visitor actions at the web resource and allows viewing them as live video. Viewing records from WebVisor showed that users usually drive the mouse in a zigzag (Gutenberg diagram).
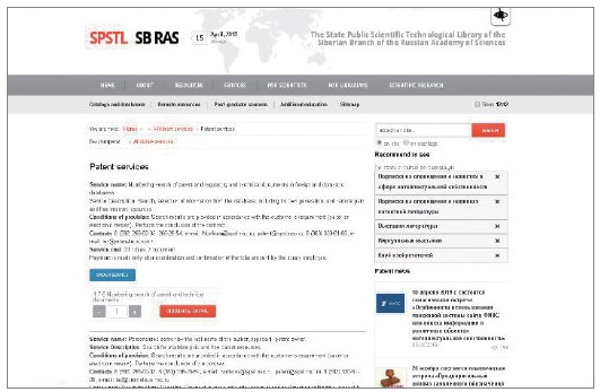
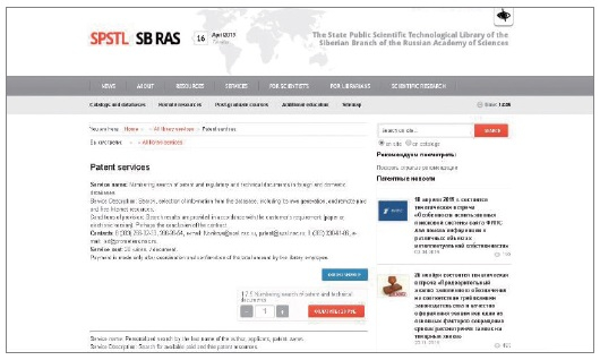
Using browsing pattern data made it possible to optimize the page structure of the SPSTL SB RAS website. The pages of the SPSTL SB RAS website with services for remote users contain a call to action: fill in the form, pay, or ask a question. It was necessary to draw user attention to the possibility of application online services and to encourage service payment through the website. In accordance with the studied browsing patterns, it was decided to place the payment and order buttons at the bottom right, in the exit and decision area, according to the Gutenberg diagram (Figs. 2 and 3). This change, we hope, will allow the user to immediately see all the possibilities of getting the service and make a decision. The online assistant window was also placed in the bottom right of the screen (Fig. 2).
4.2. The Mechanism of Recommendations on the SPSTL SB RAS Website
Further, we used data from the research by analysts at Booz-Allen & Hamilton and Nielsen//NetRatings. We have analyzed the data of visiting the SPSTL SB RAS website in accordance with the types of behavior described in Rozanski et al. (2001). These data gave an idea of the purpose for which visitors come to the website. These common behaviors can have important implications for library marketing tasks. By examining how the four session variables (session duration, page time, category concentration, and website familiarity) define different segments, we can identify behavioral models that can help in creating and posting content.
Analysis of website visits using Yandex.Metrica provides an opportunity to obtain data on the duration of sessions and the number of visits to identify the intended purpose of user visits. According to Yandex.Metrica reporting, the majority of SPSTL SB RAS website visitors come one time and spend 1.5 minutes there. Visitors with 2-3 visits are in second place where the average time on the website is about 3 minutes, and visitors with 4-7 visits take third place with time spent—4.5 minutes. Applied to the above, the main types of user behavior on the SPSTL SB RAS websites are Single Missions, Do It Again, and Loitering. If we summarize these results with the types of behavior proposed in the study (Kellar et al., 2007), we can conclude that users visit the SPSTL SB RAS website for information gathering, monitoring, and viewing. And this mode, according to the study authors, means that users tend to stay on one page and may be affected by various messages or recommendations.
These findings allowed us to optimize the page structure of the SPSTL SB RAS website for specific types of user tasks. So, in 2018, a recommendation mechanism was introduced on the SPSTL SB RAS website. When browsing pages related to patent topics, users were shown links to similar pages and sections of the website also related to patents. The analysis of Google Analytics data showed that after the implementation of the recommendation technology, users rather actively use them. The average number of transitions from the pages of patent subjects to other recommended pages is 40%, which indicates the efficiency of this technology (Shevchenko, 2019).
4.3. Library Resource Access Improvement
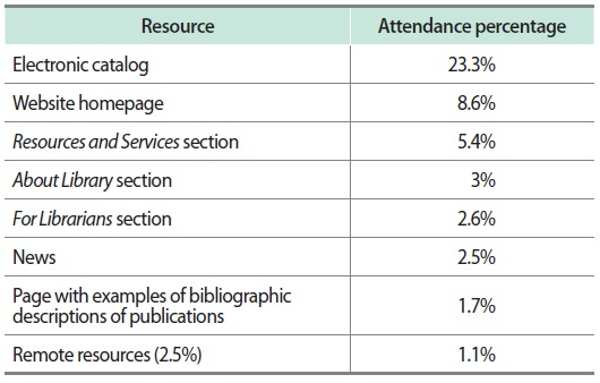
To improve access to library resources, it was necessary to identify the most popular of them. The analysis (carried out from January 1 to August 30, 2018) of page traffic according to Google Analytics showed the most popular resources of the SPSTL SB RAS website. The data on the most visited resources of the SPSTL SB RAS website are presented in Table 1, but they may be diverse for different libraries, depending on the audience of library users. On the SPSTL SB RAS website, the most demanded resources are: the electronic catalog (23.3%), the main page (8.6%), Resources and Services section (5.4%), About the Library section (3%), For Librarians (2.6%), news (2.5%), page with examples of bibliographic descriptions of publications 1.7%, and Remote Resources section (1.1%).
Table 1.
Most visited resources of the State Public Scientific-Technological Library of the Siberian Branch of the Russian Academy of Sciences (SPSTL SB RAS) website
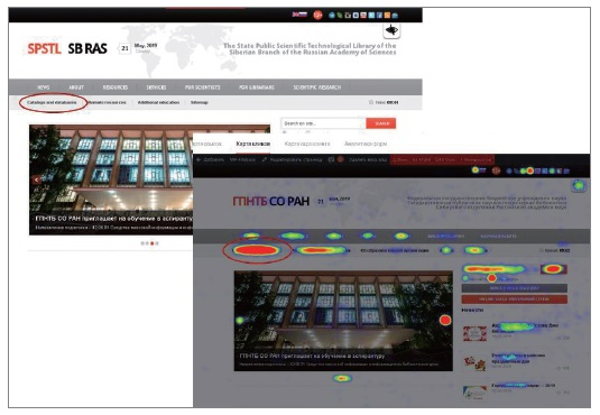
After analyzing the data and determining the most popular content, it was decided to make these resources more visible on the SPSTL SB RAS website. One of the most popular and sought-after resources is the SPSTL SB RAS electronic catalog, which as confirmed by YandexMetrica click map is a tool for measuring and displaying statistics on website clicks. The map displays clicks on all page elements, warm colors correspond to frequent clicks, and cold correspond—to rare clicks (Fig. 4).
Fig. 4.
Click map of the State Public Scientific-Technological Library of the Siberian Branch of the Russian Academy of Sciences (SPSTL SB RAS) website. Link to electronic catalog is highlighted.
Clicking on the link to the electronic catalog, the user enters the platform of the Integrated (developing) library information system (IRBIS) automated library information system with a large number of catalogs and databases (more than 60), which can be misleading. To avoid this, the Resources and Services section was reorganized and divided into two sections: Resources and Services. The Resources section included links to all catalogs of the SPSTL SB RAS database and remote access resources. Links are grouped by type composition: books, journals, abstracts, etc. Links from these sections lead directly to the books, journals, and author’s abstracts catalogs, and also to databases, which increased the usability of the electronic catalog and databases. Also, in the process of analyzing the most visited pages, it turned out that the website page containing examples of bibliographic descriptions of various publications is quite popular—1.7% of all visits, but it is very difficult to find from the main page. As a result, the page was placed at the second level of the website in the section Researcher Support.
4.4. Event Tracking to Analyze User Paths
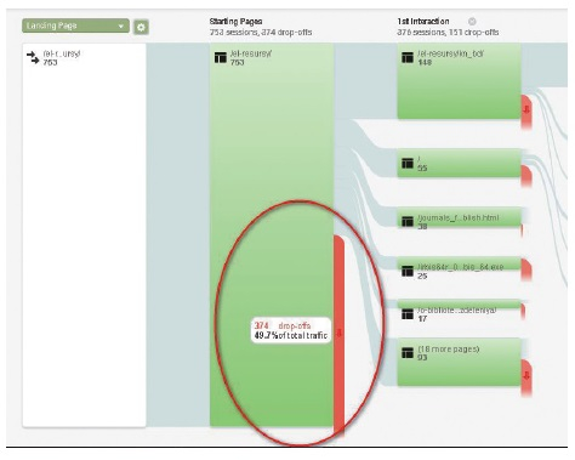
Identification of popular content helps establish the preferred paths used by the largest number of users. However, the user path report does not show where users move when they leave our website. If the user follows the link to a remote resource, in the report it looks like a session interruption, a user exit. In the “Remote Resources” section, links to subscription remote resources are grouped. As shown in Fig. 5, Google Analytics does not take into account how users accessed library resources in the Remote Resources section; we only see that they left the SPSTL SB RAS website. The report on the behavior map on the Remote Resources page shows that 49.7% of users left the page—374 interruptions out of 753 sessions (Fig. 5).
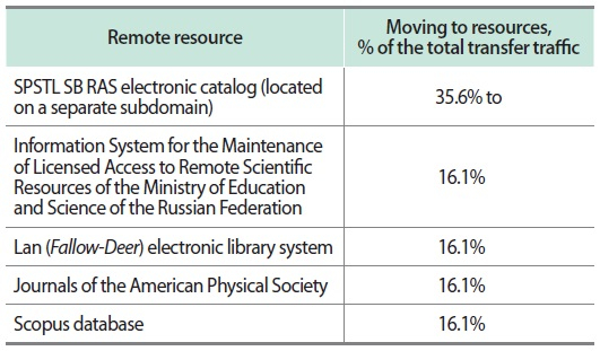
Google Analytics event tracking can help determine bounce rates. After implementing event tracking using Google Analytics, it became clear that users are not just leaving our website, but are switching over to subscription remote resources (Table 2).
Table 2.
Event map data on remote resources website page according to Google Analytics
SPSTL SB RAS, State Public Scientific-Technological Library of the Siberian Branch of the Russian Academy of Sciences.
The report on the events Switching to a Remote Resource showed that the most transitions are made to the SPSTL SB RAS electronic catalog, with the same percentage of transitions to Scopus database, journals of the American Physical Society, Lan (Fallow-Deer) electronic library system, and the Information System for the Maintenance of Licensed Access to Remote Scientific Resources of the Ministry of Education and Science of the Russian Federation.
Yandex.Metrica also allows tracking of events. To understand the demand for a new integrated service for authors helping to prepare texts for publication with the help of Yandex.Metrica, the Composite Purpose was created. When setting it up, several conditions were set that users shall meet in order for the goal to be considered achieved—page viewing with a service description, filling out the order form, and payment. This will give the opportunity to track all the way from the website visitor to the user who ordered this service. At the same time, we will receive detailed statistics on each step and see at which stage users most often leave the page, do not fill out the service order form, and do not make payment. This algorithm is useful to determine the ordering step where users may have problems.
The preliminary results of tracking a composite goal show that website users cover the entire chain before filling out the order form. Yandex.Metrica reporting shows that there were 240 page views of the Services for Authors page for the period from October 1 to December 31, 2018; 98 goals were achieved when choosing a particular service, and users completed an order form 10 times. There are not many service orders yet, which indicates the necessity to promote this service. A service promotion system is currently being developed: an advertising booklet is being prepared, a so-called “selling article” about this service is being written, and advertising information is being placed in the news feed of the website.
5. CONCLUSIONS, RECOMMENDATIONS, AND FUTURE RESEARCH
The literature review has shown that users behave differently depending on what they do on the Internet in different cases. By identifying behavioral patterns, librarians can improve their website. Event tracking is a great way to manage it. In addition to collecting data on website navigation paths, one can get data on the use of subscription content. The personnel of the Library Procurement Department use this data to assess which databases or other resources are worth saving and continuing to subscribe to, and which can be unsubscribed.
The web team of SPSTL SB RAS determined that the application of the results concerning user behavior and event tracking led to an improvement in the website usability and its functionality. The group used this data to make a small redesign of the website pages. Some decisions made by the maintenance web group of the SPSTL SB RAS website included: optimizing the structure of some pages of the SPSTL SB RAS website by placing order and service payment buttons in the required place in accordance with the viewing patterns; implementation of the recommendation mechanism on the patent topic pages; reorganization of the Resources and Services section to improve the use of electronic catalogs and databases; reordering links to remote resources; and studying of statistics on user habits to track the demand for services for authors in order to promote it. Any library can use this methodology to determine what content users prefer, what paths they use, and how much time they spend on the website to improve access to their popular content.
The author concludes that using web analytics reports and tracking events using web analytics systems will help determine key performance indicators based on frequently used content. The author recommends libraries to study the target audience of their websites and its behavior. A better understanding of what users want to find on the website will help specialists design a convenient and user-friendly website or make changes to an existing version. Using data from web analytics will make the process of collecting information about user behavior faster and more practical. The author recommends using Google Analytics event data to track the performance of library websites, which can help develop a comprehensive understanding of library website users. Use of data on user navigation paths will help assess the services’ relevance, and if necessary, promote and advertise them. Using data on real user behavior, library website developers will be able to effectively present library website resources and services to users, increase their relevance, and improve access by creating more direct paths and, accordingly, raise the level of information services. Any library collecting and analyzing data on user behavior on the library website will be able to improve its website and attract users to its content.
The website maintenance team of the SPSTL SB RAS has identified the following steps for further website improvement. These are: identification of user tasks as they are developed, conducting user testing to better understand event tracking data, and collecting additional data to verify the effectiveness of the changes made. It is also planned to use additional event tracking tags to understand how various resources are used. The study of data on session duration and the visit number will be continued to identify the goals of user visits and create new recommendations. It is also necessary to conduct a usability analysis and test to compare the data obtained using web analytics and the perception of the library website by the users themselves. This will form the basis of future research.
References
3 Design layouts: Gutenberg diagram, Z-pattern, and F-pattern. Vanseo Design () ((2011), Retrieved October 21, 2018) Bradley, S. (2011). 3 Design layouts: Gutenberg diagram, Z-pattern, and F-pattern. Vanseo Design. Retrieved October 21, 2018 from https://vanseodesign.com/webdesign/3-design-layouts/. , from https://vanseodesign.com/webdesign/3-design-layouts/
Personalisation and recommender systems in digital libraries (Joint NSFEU DELOS Working Group Report) (, , , , , , ) ((2003), Retrieved October 21, 2018) Callan, J., Smeaton, A., Beaulieu, M., Borlund, P., Brusilovsky, P., Chalmers, M., . . . Toms, E. (2003). Personalisation and recommender systems in digital libraries (Joint NSFEU DELOS Working Group Report). Retrieved October 21, 2018 from http://www.ercim.org/publication/wsproceedings/Delos-NSF/Personalisation.pdf. , from http://www.ercim.org/publication/wsproceedings/Delos-NSF/Personalisation.pdf
A human-centered behavioral informatics. In A. Esposito, M. Faundez-Zanuy, F. C. Morabito, & E. Pasero (Eds.), Quantifying and processing biomedical and behavioral signals (, , , ) ((2019)) Cham: Springer Esposito, A., Faundez-Zanuy, M., Morabito, F. C., & Pasero, E. (2019). A human-centered behavioral informatics. In A. Esposito, M. Faundez-Zanuy, F. C. Morabito, & E. Pasero (Eds.), Quantifying and processing biomedical and behavioral signals (pp. 3-8). Cham: Springer. , pp. 3-8
((2015)) Internet behavior as an object of study of social sciences. Sociological Miscellany, 6, 543-549 http://socio.bas-net.by/wp-content/uploads/2016/04/soc_alm6.pdf.
, Gonçalves, M., Rocha, T., Magalhães, L., Peres, E., Bessa, M., & Chalmers, A. (2013). Identifying different visual patterns in web users behaviour. , Proceedings of the 27th Spring Conference on Computer Graphics, (pp. 65-70). New York: ACM., , Identifying different visual patterns in web users behaviour., Proceedings of the 27th Spring Conference on Computer Graphics, (2013), New York, ACM, 65, 70
, He, B., & Zhang, H. Y. (2016). Research on personalized information recommendation of library. , Proceeding of the 2016 4th International Conference on Machinery, Materials and Computing Technology; Advances in Engineering Research, (pp. 1251-1254). Hangzhou: Atlantis Press., , Research on personalized information recommendation of library., Proceeding of the 2016 4th International Conference on Machinery, Materials and Computing Technology; Advances in Engineering Research, (2016), Hangzhou, Atlantis Press, 1251, 1254
How users see websites: Fand Z- patterns, Gutenberg diagram. (, ) ((2016), Retrieved December 22, 2018) Kotyak, E., & Narizhnyi, D. (2016). How users see websites: Fand Z- patterns, Gutenberg diagram. Retrieved December 22, 2018 from https://netology.ru/blog/users-site-patterns. , from https://netology.ru/blog/users-site-patterns
, Lindley, S. E., Meek, S., Sellen, A., & Harper, R. (2012). “It’s simply integral to what I do”: enquiries into how the web is weaved into everyday life. , Proceedings of the 21st international conference on World Wide Web, (pp. 1067-1076). Lyon: ACM., , “It’s simply integral to what I do”: enquiries into how the web is weaved into everyday life., Proceedings of the 21st international conference on World Wide Web, 2012, Lyon, ACM, 1067, 1076
, Morrison, J. B., Pirolli, P., & Card, S. K. (2001). A taxonomic analysis of what World Wide Web activities significantly impact people’s decisions and actions. , Proceedings of Extended Abstracts on Human Factors in Computing Systems, (pp. 163-164). Seattle: ACM., , A taxonomic analysis of what World Wide Web activities significantly impact people’s decisions and actions., Proceedings of Extended Abstracts on Human Factors in Computing Systems, (2001), Seattle, ACM, 163, 164
, ((2013)) Behavioral signal processing: Deriving human behavioral informatics from speech and language: computational techniques are presented to analyze and model expressed and perceived human behavior-variedly characterized as typical, atypical, distressed, and disordered-from speech and language cues and their applications in health, commerce, education, and beyond. Proceedings of the IEEE, 101(5), 1203-1233 .
F-Shaped pattern for reading web content (original study). () ((2006), Retrieved December 22, 2018) Nielsen, J. (2006). F-Shaped pattern for reading web content (original study). Retrieved December 22, 2018 from https://www.nngroup.com/articles/f-shaped-pattern-reading-webcontent-discovered/. , from https://www.nngroup.com/articles/f-shaped-pattern-reading-webcontent-discovered/
F-Shaped pattern of reading on the web: Misunderstood, but still relevant (even on mobile). () ((2017), Retrieved December 22, 2018) Pernice, K. (2017). F-Shaped pattern of reading on the web: Misunderstood, but still relevant (even on mobile). Retrieved December 22, 2018 from https://www.nngroup.com/articles/f-shaped-pattern-reading-web-content. , from https://www.nngroup.com/articles/f-shaped-pattern-reading-web-content
((2014)) The quality of online library services. Scientific and Technical Libraries, 8, 18-27 http://www.gpntb.ru/ntb/ntb/2014/8/ntb_8_2_2014.pdf.
, , ((2001)) Seize the occasion! The seven-segment system for online marketing. Strategy+business [24] https://www.strategy-business.com/article/19940?gko=d29c9.
, Sellen, A. J., Murphy, R., & Shaw, K. L. (2002). How knowledge workers use the web. , Proceedings of the SIGCHI Conference on Human Factors in Computing Systems, (pp. 227-234). Minneapolis: ACM., , How knowledge workers use the web., Proceedings of the SIGCHI Conference on Human Factors in Computing Systems, (2002), Minneapolis, ACM, 227, 234
((2019)) Technology of recommendations as a means of personalizing library websites. Information Resources of Russia, 2, 14-16 http://www.rosenergo.gov.ru/information_and_analytical_support/informatsionnie_resursi_rossii/informatsionnie_resursi_rossii_2_168__2019.
Educational use cases from a shared exploration of e-books and iPads. In: T. T., Goh, (Ed.), E-books and E-readers for E-learning (, , ) ((2012)) Wellington: Victoria Business School, Victoria University of Wellington Smith, M., Kukulska-Hulme, A., & Page, A. (2012). Educational use cases from a shared exploration of e-books and iPads. In: T. T., Goh, (Ed.), E-books and E-readers for E-learning (pp. 25-53). Wellington: Victoria Business School, Victoria University of Wellington. , pp. 25-53
How user behavior on the website may affect the ranking. Yandex research. (, , , ) ((2014), Retrieved December 22, 2018) Tolstikov, A., Shakhray, M., Gusev, G., & Serdyukov, P. (2014). How user behavior on the website may affect the ranking. Yandex research. Retrieved December 22, 2018 from https://siteclinic.ru/blog/web-analytics/analiz-povedeniyapolzovatelya-yandex. , from https://siteclinic.ru/blog/web-analytics/analiz-povedeniyapolzovatelya-yandex
Establishing user requirements for a recommender system in an online union catalogue: An investigation of WorldCat.org. () ((2015), Retrieved October 21, 2018) Wakeling, S. (2015). Establishing user requirements for a recommender system in an online union catalogue: An investigation of WorldCat.org. Retrieved October 21, 2018 from http://etheses.whiterose.ac.uk/9163/7/Simon%20Wakeling%20Final%20Thesis%20Submitted%202.pdf. , from http://etheses.whiterose.ac.uk/9163/7/Simon%20Wakeling%20Final%20Thesis%20Submitted%202.pdf
- Submission Date
- 2019-03-11
- Revised Date
- Accepted Date
- 2020-01-08
- Downloaded
- Viewed
- 0KCI Citations
- 0WOS Citations


