- P-ISSN2287-9099
- E-ISSN2287-4577
- SCOPUS, KCI
Topic Analysis of Scholarly Communication Research

Mikyeong Cha (Library and Information Science, Ewha Womans University, Seoul, Korea)

Abstract
This study aims to identify specific topics, trends, and structural characteristics of scholarly communication research, based on 1,435 articles published from 1970 to 2018 in the Scopus database through Latent Dirichlet Allocation topic modeling, serial analysis, and network analysis. Topic modeling, time series analysis, and network analysis were used to analyze specific topics, trends, and structures, respectively. The results were summarized into three sets as follows. First, the specific topics of scholarly communication research were nineteen in number, including research resource management and research data, and their research proportion is even. Second, as a result of the time series analysis, there are three upward trending topics: Topic 6: Open Access Publishing, Topic 7: Green Open Access, Topic 19: Informal Communication, and two downward trending topics: Topic 11: Researcher Network and Topic 12: Electronic Journal . Third, the network analysis results indicated that high mean profile association topics were related to the institution, and topics with high triangle betweenness centrality, such as Topic 14: Research Resource Management, shared the citation context. Also, through cluster analysis using parallel nearest neighbor clustering, six clusters connected with different concepts were identified.
- keywords
- scholarly communication, topic modeling, network analysis, topic analysis, text analysis, bibliometric analysis
1. INTRODUCTION
1.1. Background
Scholarly communication has always been considered a fundamental aspect of scientific research. The function could be found in scholarly communication, suggested De Solla Price (1963). He defined it as the connection among scholars, which increases one scholar’s awareness of the work by sharing ideas. It can be informal or formal, and more various tools are used for communication within the scholarship. By connecting scholars, scholarly communication has made scholars share and advance their ideas (De Solla Price, 1963; Klain-Gabbay & Shoham, 2018).
The advance of scholarly communication is required to function well in a modern society where technology development is accelerated. It is the reason why research on scholarly communication is essential. At this point, analyzing accumulated studies and reifying the subject area could offer logical information about the scholarly communication to future researchers. The objective of the study is identifying the topics of scholarly communication. More specifically, the study aims to answer the following questions:
-
What are the research topics studied in the scholarly communication area?
-
What is the trend of scholarly communication research?
-
What is the structural character of scholarly communication research?
Three methodologies were used in this study. Latent Dirichlet Allocation (LDA) topic modeling was performed on abstracts of 1,435 articles published from 1970 to 2018 in the Scopus database to find the specific topics. Time series analysis was used to find out the trends of topics. Network analysis was conducted to identify the structural characteristics of scholarly communication research. The results of this study serve as primary data for future scholarly communication research.
1.2. Literature Review
Previous studies, conducted with topic modeling to figure out the research topics, were referenced to construct the proper research processes. The studies were summarized as follows.
Park and Oh (2017) collected 1,027 papers published in two journals related to Korean records management and four journals related to library information science from 1997 to 2016. Then, they conducted LDA topic modeling and Hierarchical Dirichlet Process topic modeling. As a result, they identify ten critical topics, such as ‘electronic records,’ ‘National Archives,’ and ‘record information service.’
Jin and Song (2016) analyzed the titles and abstracts of the articles published in the top 20 journals of which impact factor was high for the past five years, according to the Information & Library Science subject in Journal Citation Reports (JCR) 2013. Through topic modeling, they identified 50 topics. Networks were created with these topics to classify interdisciplinarity using the average path length of the topic network. After that, they compared the topic networks among academic journals. Through this, it was identified that the text-based index is different from the citation information-based index.
Park and Song (2013) crawled web pages of the journals in library and information science (LIS) in Korea. As a result, 3,834 English abstracts were collected, dating from 1970 to 2012. Then they performed topic modeling. Through this, the topics of LIS were identified. Also, time series analysis was performed on them to identify hot topics and cold topics. Besides this, topic modeling was conducted for each journal to compare and analyze topics for each journal. Research to understand the research trend using topic modeling in other subject fields was also conducted.
Keshner et al. (2019) used topic modeling to analyze how the study of virtual reality (VR) to rehabilitation has been conducted. As a result, they found that the extracted topics of VR rehabilitation are distinguished from general science or engineering fields. In particular, the research areas of VR rehabilitation contained unique topics, such as telerehabilitation.
Amado et al. (2018) conducted a semi-automated text mining study to identify significant big data trends in the marketing field. Using Science Direct, 1,560 published papers from 2010 to 2015 related to big data in marketing were collected. The study found that the topics were categorized into the latest technology and the advantages of big data in marketing.
As a result of integrating these studies, three points were clarified. First, topic modeling was used to find the topics related not only to specific fields but also particular keywords. Second, the data for research could be collected from both journals and databases. Third, network analysis and time series analysis were frequently used to analyze the topics identified from the topic modeling. Based on the three points inferred from previous studies, LDA topic modeling was performed on the articles extracted from the database, and time series analysis and network analysis were performed based on those topics.
2. TOPIC ANALYSIS
2.1. Topic Modeling
A topic modeling algorithm is a statistical method that analyzes original texts to discover the themes that run through them. It assumes the literature as a mixture of various topics, and the topic is expressed as a distribution of several words. According to the topic modeling, when composing a document it is repeated in order to select one of the topics and then select a word among the chosen topic based on the proportion of the topics and words (Blei, 2012).
However, in a realistic situation, the distribution of topics in the articles and the distribution of words in the topic were sealed. Therefore, it is necessary to observe the word distribution of the existing literature and then estimate the topic’s word distribution. This is the reason that LDA is proposed (Blei, 2012; Song, 2017; Weingart, 2012).
LDA is a statistical model of document collections, and this statistical model reflects the intuition that documents exhibit the topics. Each document shows the topics in different proportions. Each word in each document is drawn from one of the topics, where the selected topic is chosen from the pre-document distribution over topics (Blei et al., 2003; Blei, 2012).
To perform topic modeling, the researcher must set the number of topics. In this study, coherence was used to select the number of topics. Coherence is assessing the consistency of the words in the topic (Newman et al., 2010). In other words, coherence measures the similarity of words in each topic by calculating how often they appear in similar contexts. It is based on the linguistic assumption that words with similar meanings often appear in similar contexts (Syed & Spruit, 2017). When the topic modeling is performed more accurately, the coherence is calculated more highly. Therefore, after repetition to change the number of the topics and see the value of coherence, the number of topics with the highest value of coherence was selected (Choi & Ko, 2019).
2.2. Network Analysis
Networks model various systems in the real world by expressing a person or an object as a node and the relationship between the nodes as a link. The network model could be used to analyze and understand various characteristics scientifically (Lee, 2012).
In LIS, research related to network analysis has been primarily carried out in two categories: the analysis of information users and study about the area of bibliographical science. The starting point of the two fields is the study of the “invisible college.” The invisible college means the interaction of scholars apart from each other for productive information exchange. Since then, with the advance of bibliometric analysis techniques, including co-citation analysis, network analysis has extended to the access and links through the publications. Also, bibliographical science has been interested in grasping the connection between documents with network analysis (Lee, 2006c; Zuccala, 2006).
Network analysis performs at various levels. In this research, network-level analysis and node-level analysis were performed. Besides this, centrality analysis was conducted to grasp the relational character of particular topics. Centrality is a concept that indicates how much closer a node is to the center than others. The centrality calculated for the node is not absolute value but relative value in a network. Since its introduction in the 1950s, various methods to measure centrality have been developed. It is necessary to perform centrality analysis by selecting an appropriate indicator among these various centrality indicators, depending on the network’s type and structural characteristics (Lee, 2012). In this study, the nearest neighbor centrality (NNC), centrality of mean profile association (Cmp), and triangle betweenness centrality (TBC) proposed by Lee (2006c) were used to prevent data loss during the conversion process.
The pathfinder network (PFNet) was used to describe the topic network in this study. The PFNet, which is one way to express a network, is a network created by removing an edge that violates a triangle inequality. The violation of triangular inequality means a direct edge is longer than an indirect path connected through several short edges. The PFNet is widely used to visualize knowledge networks that describe keywords or concepts in a research field (Lee, 2006a; Lee, 2012; Schvaneveldt, 1990).
3. METHODOLOGY
3.1. Data Extraction
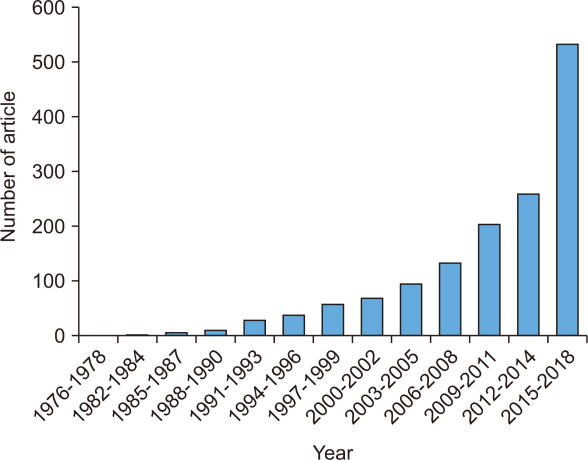
Since scholarly communication was discussed in various fields, data was collected from the database to search for articles from various subject areas. Among the databases, Scopus was selected because it contained the most articles related to scholarly communication. The retrieval term was “Scholarly Communication,” according to the LC (Library of Congress) subject heading. The retrieve was targeted on the title, abstract, keyword, and index search and conducted on the limited period from 1970 to 2018 when citation information was registered in Scopus for accurate time series analysis. As a result, authors, publication year, abstract, and author keywords data of the 1,552 articles were extracted. The abstracts were selected as data for text analysis because they contained more specific information than the author keywords did. Therefore, 96 articles without abstracts were deleted. Besides this, 21 documents not related to scholarly communication were deleted too. Finally, abstracts of 1,435 articles published from 1976 to 2018 were used to analyze the topics. The number of articles about scholarly communication, based on the extracted data, continues to increase as follows (Fig. 1).
The data for topic modeling could be various unstructured text data, and preprocessing is essential to analyze them more accurately (Feldman & Sanger, 2006). For this purpose, abbreviation unification was performed as the first step. For example, in the case of open access, ‘OA’ and ‘open access’ were used together. These terms were unified through changing abbreviations into full words. NLTK, an English natural language processing package, was used in other preprocessing steps. Tokenization and lemmatization were performed, and bigram and trigram were applied to reflect noun phrases in which two or more words were used as one word. After stemming, stop words such as articles were deleted. The words with a frequency of less than ten were removed. As a result of the preprocessing, a total of 6,920 words were extracted.
3.2. Topic Modeling
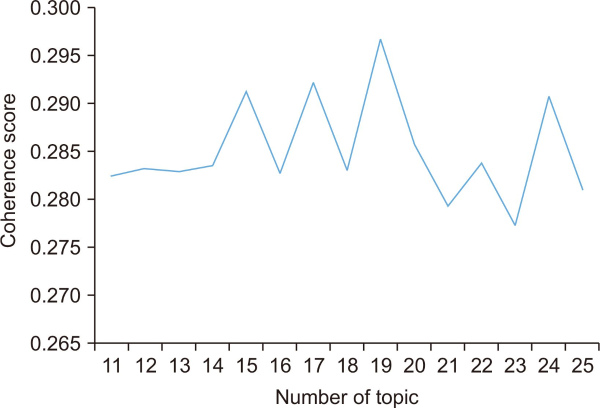
LDA topic modeling was performed using GENSIM, a Python package, and a corpus and dictionary were constructed on preprocessed data. Then the corpus was written based on term frequency-inverse document frequency (TF-IDF). In the topic modeling, the researchers should decide the number of topics. The coherence depending on the number of topics between 11 and 25 was calculated to select the number of topics. When the number of topics was nineteen, coherence was highest. As a result, nineteen was chosen as the number of topics (Fig. 2).
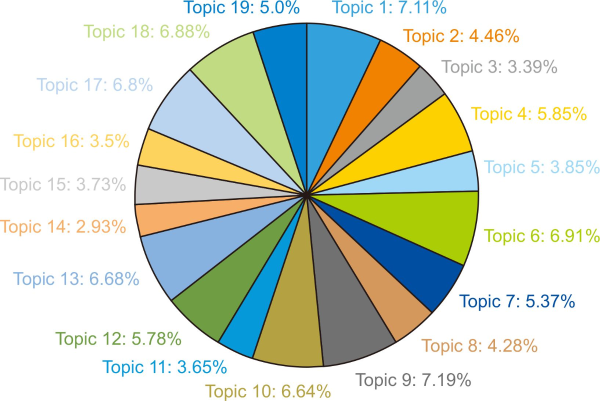
Seven representative words of the topics were extracted. The distribution of words in the topic and the ratio of the word’s frequency in each topic to the word’s total occurrence were considered to choose the words. The largest proportion of the topic was 7.11% (topic 1), and the smallest proportion of the topic was 2.93% (topic 14). The even distribution of the topics means researchers chose the topics evenly (Fig. 3).
Fig. 3
Topic proportion. The figures were rounded off to second decimal places. Topic 1, Academic Publication; Topic 2, University Library Service (ULS); Topic 3, Technology Element; Topic 4, Copyright; Topic 5, Online Information Search (OIS); Topic 6, Open Access Publishing (OA Publishing); Topic 7, Green Open Access (Green OA); Topic 8, Research Cooperation; Topic 9, Academic Infrastructure (Academic Infra); Topic 10, Digital Communication; Topic 11, Researcher Network; Topic 12, Electronic Journal (E-journal); Topic 13, Preservation; Topic 14, Research Resource Management (RRM); Topic 15, Institute Policy; Topic 16, Institutional Repository (IR); Topic 17, Research Data; Topic 18, Research Evaluation; Topic 19, Informal Communication.
3.3. Time Series Analysis
For the time series analysis, the published year of the articles was assigned to the topics based on the extracted document-topic distribution to determine the topic’s appearance period. Then the distribution of the topic in each document was summed up for each year. Based on this, the time of the first appearance was identified for each subject.
Among the collected articles, 12 articles were published from 1976 to 1988, and there were no documents published from 1976 to 1984. The whole period was divided into thirteen sections for time series analysis. Also, in the period sections, each topic’s appearance was divided by the sum of the all topics appearance and the value was used in because the number of articles increased over the years, affecting time serial analysis.
3.4. Network Analysis
The top 30 words in the topic (Appendix 1) and the term frequency (TF) were extracted, and the inverted topic frequency (ITF) was calculated, applying the concept of inverse document frequency (IDF). The topic×word matrix was calculated, and weight was given to words to identify particular topics using the ITF (Inverted Topic Frequency) value rather than the topic frequency (Jin & Song, 2016). The TfidfVectorizer module was used to make the matrix, the topic×word matrix was transformed to create the topic×topic (19*19) matrix, and the matrix was attached as in Appendix 2. Cosine similarity coefficients were calculated based on the topic×topic matrix, and the matrix was attached it as in Appendix 3. In this study, a PFNet was created using a cosine similarity matrix.
4. RESULT
4.1. The Result of Keyword Analysis
Before topic modeling, keywords analysis was conducted to understand scholarly communication research in an overview. The top 100 stemmed words based on the TF value and the TF-IDF value were visualized with the word cloud for more efficient analysis (Fig. 4).
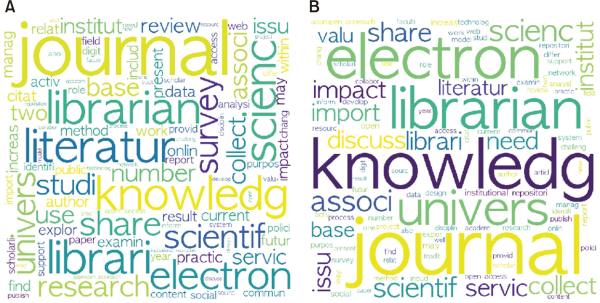
‘Electron*’ and ‘journal’ have high TF and TF-IDF values. It means that both words were used frequently both in one article and over the whole of scholarly communication research. In other words, the research indirectly and directly related to journals and electric resources was conducted frequently. It could be inferred that journal and electronic resources were the most influential academic resources in scholarly communication research.
Words referring to institutions such as ‘univers*,’ ‘institut*,’ ‘librari*,’ and ‘associ*’ were frequently used. We can infer that a large part of scholarly communication research is related to institutional research because those words referred to the institution deeply related to the scholarly communication. Besides this, ‘librari*’ and ‘librarian’ occupy a large proportion of both numbers. In the case of ‘librari*,’ TF-IDF value is less than TF value, whereas in the case of ‘librarian,’ TF value is less than TF-IDF value. This means that ‘librari*’ appears in more texts, while ‘librarian’ appears more frequently in a small number of texts. The research related to the librarian is distinguished from research related to the library. The research related to the librarian is more specifically focused on the librarian.
Many words with high TF value or TF-IDF value refer to academic research, such as ‘research,’ ‘studi*,’ ‘scienc*,’ and ‘scientifi*.’ Through this, we can confirm that scholarly communication research is being conducted under the definition. In the case of ‘knowledg*’ and ‘journal,’ both values were high, and words related to research resources such as ‘literatur*’ and ‘collect*’ were also appearing. Through this, we can figure out that discussions on research resources frequently occur in scholarly communication research.
Looking at the keywords, we observed that many kinds of research are about the institution, and among them, many studies are about the library. However, there is a limit to grasping the research topic only by analyzing keywords. It is difficult to identify what the keyword indicates. For example, ‘electron*’ could be interpreted to mean different topics depending on the word used together. If it is used with a subscription, it could indicate the topic related to the journal crisis; whereas, if it is used with management, it could be interpreted as digital management. Topic modeling was performed to find out more detailed topics in the next chapter to solve this ambiguity.
4.2. Result of Topic Modeling
As a result of LDA topic modeling, we found 19 topics and extracted representative words. Topics were interpreted and named based on the topic-word distribution to identify the significant words in the topics and the document-topic distribution to identify the document with a high proportion of the topic (Table 1).
Table 1
19 topics of scholarly communication research
| 1 Academic Publication |
2 University Library Service (ULS) |
3 Technology Element |
4 Copyright |
|---|---|---|---|
| journal publish policy sustain research open_access predatory_publish |
librarian/library faculty_member service resource profession study research/academic |
journal electron scientist database impact technology effect |
open_access copyright electronic publish embargo academy market |
| 5 Online Information Search (OIS) |
6 Open Access Publishing (OA Publishing) |
7 Green Open Access (Green OA) |
8 Research Cooperation |
| internet resource directory frailty web manage access |
open_access_journal open_access library citation article public publish |
open_access library institutional_repository policy manuscript article share |
co_authorship orcid web association publish seek sparc |
| 9 Academic Infrastructure (Academic Infra) |
1 0Digital Communication |
11 Researcher Network |
12 Electronic Journal (E-journal) |
| academic nation role model infrastructure patron public |
research information_literacy digit rebut provide tool link |
network communication ocid field peer_review subgroup reference |
electronic_journal internet publish measure impact technology system |
| 13 Preservation |
14 Research Resource Management (RRM) |
15 Institute Policy |
16 Institutional Repository (IR) |
| archive model risk research system librarian/archivist digit |
metadata journal crossref grey_literature paper policy collection |
research fiscal administration institutional_repository institute open_access mandate |
manage institutional_repository data preprint share policy role |
| 17 Research Data |
18 Research Evaluation |
19 Informal Communication |
|
| reuse data encoding masur research collect system |
reward_system journal factor evaluate model impact altmetric |
tweet/tweeter blog change web collaboration site distribution |
The nineteen specific topics of scholarly communication research were identified, and researchers evenly selected every topic. The identified topics are subdivided, detailed, and concrete. For example, Open Access (OA) topics were separated into two topics depending on the strategy: Topic 6: Open Access Publishing (OA Publishing) and Topic 7: Green Open Access (Green OA). This result would be useful when researchers want to specify their ideas and new researchers want to clarify what scholarly communication research is.
4.3. Result of Time Series Analysis
For the time series analysis of the topic identified through topic modeling, the article’s publishing year was assigned to the topic based on the extracted document-topic distribution to determine the topic’s appearance year. As the last part of preprocess for the analysis, the whole period was divided by three years to clarify overall trends of each topic and the distribution of each topic in the article was summed up. Overall, because the number of academic communication studies increased, all topics increased (Table 2).
Table 2
Trend of topic distribution
| Topic No. |
Year | |||||||||||||
|---|---|---|---|---|---|---|---|---|---|---|---|---|---|---|
| 1976 -1978 |
1982 -1984 |
1985 -1987 |
1988 -1990 |
1991 -1993 |
1994 -1996 |
1997 -1999 |
2000 -2002 |
2003 -2005 |
2006 -2008 |
2009 -2011 |
2012 -2014 |
2015 -2018 |
Total | |
| 1 | 0.88 | 1.18 | 1.70 | 3.96 | 1.36 | 3.51 | 6.07 | 8.43 | 12.32 | 18.07 | 32.39 | 89.87 | ||
| 2 | 0.87 | 0.88 | 2.62 | 0.64 | 0.93 | 2.97 | 2.30 | 3.56 | 11.45 | 7.07 | 23.42 | 56.71 | ||
| 3 | 0.72 | 0.86 | 3.53 | 4.11 | 2.06 | 0.02 | 1.22 | 3.86 | 8.32 | 8.76 | 9.66 | 43.12 | ||
| 4 | 0.86 | 0.88 | 3.47 | 2.89 | 2.77 | 4.67 | 6.88 | 14.82 | 15.57 | 22.41 | 75.22 | |||
| 5 | 0.01 | 2.28 | 2.85 | 4.03 | 1.66 | 4.78 | 4.21 | 10.34 | 8.49 | 13.55 | 52.20 | |||
| 6 | 0.15 | 0.01 | 0.98 | 0.69 | 1.25 | 2.72 | 5.87 | 5.65 | 16.20 | 17.56 | 29.53 | 80.61 | ||
| 7 | 0.01 | 0.02 | 0.01 | 1.84 | 3.02 | 5.52 | 5.29 | 8.41 | 14.26 | 28.84 | 67.22 | |||
| 8 | 0.86 | 0.02 | 2.13 | 2.08 | 3.43 | 3.35 | 8.17 | 3.14 | 8.36 | 21.99 | 53.53 | |||
| 9 | 0.87 | 0.01 | 1.91 | 1.26 | 8.51 | 4.96 | 8.03 | 7.11 | 11.58 | 16.63 | 30.05 | 90.92 | ||
| 10 | 0.83 | 1.95 | 2.59 | 2.05 | 2.78 | 4.14 | 11.15 | 11.05 | 12.12 | 34.42 | 83.08 | |||
| 11 | 0.87 | 1.46 | 0.87 | 2.25 | 2.22 | 1.61 | 4.13 | 5.58 | 9.13 | 17.53 | 45.65 | |||
| 12 | 0.86 | 0.82 | 2.74 | 2.29 | 4.14 | 4.49 | 3.83 | 6.23 | 8.38 | 7.71 | 31.73 | 73.22 | ||
| 13 | 0.85 | 0.01 | 3.78 | 2.25 | 2.91 | 5.78 | 8.04 | 5.68 | 11.96 | 12.78 | 30.41 | 84.45 | ||
| 14 | 0.01 | 0.90 | 0.63 | 1.41 | 3.41 | 1.96 | 4.04 | 5.04 | 8.03 | 11.21 | 36.64 | |||
| 15 | 0.01 | 1.44 | 0.84 | 1.59 | 2.43 | 2.43 | 2.51 | 8.46 | 8.86 | 18.12 | 46.69 | |||
| 16 | 0.58 | 0.02 | 0.61 | 1.46 | 0.04 | 2.90 | 3.63 | 5.65 | 6.82 | 22.14 | 43.85 | |||
| 17 | 0.85 | 0.01 | 0.86 | 0.46 | 5.01 | 5.56 | 9.36 | 11.30 | 7.64 | 13.38 | 31.47 | 85.90 | ||
| 18 | 0.87 | 0.86 | 0.88 | 0.02 | 2.49 | 3.83 | 1.53 | 6.14 | 8.73 | 9.19 | 18.68 | 34.61 | 87.83 | |
| 19 | 0.01 | 0.90 | 0.88 | 1.80 | 3.75 | 1.61 | 4.91 | 9.48 | 14.99 | 24.25 | 62.58 | |||
| Total | 0.87 | 2.47 | 4.44 | 8.72 | 28.01 | 33.04 | 51.40 | 57.04 | 83.82 | 115.50 | 179.01 | 227.26 | 467.76 | 1,259.33 |
Topic 1, Academic Publication; Topic 2, University Library Service (ULS); Topic 3, Technology Element; Topic 4, Copyright; Topic 5, Online Information Search (OIS); Topic 6, Open Access Publishing (OA Publishing); Topic 7, Green Open Access (Green OA); Topic 8, Research Cooperation; Topic 9, Academic Infrastructure (Academic Infra); Topic 10, Digital Communication; Topic 11, Researcher Network; Topic 12, Electronic Journal (E-journal); Topic 13, Preservation; Topic 14, Research Resource Management (RRM); Topic 15, Institute Policy; Topic 16, Institutional Repository (IR); Topic 17, Research Data; Topic 18, Research Evaluation; Topic 19, Informal Communication.
4.3.1. First Appearance of Each Topic
The earliest topic was Topic 18: Research Evaluation, which appeared alone in 1976. After then, there was no literature collected until 1982. Topic 3: Technology Element first appeared in 1983. In 1984, Topic 1: Academic Publication and Topic 2: University Library Service (ULS) first appeared together. Subsequently, in 1985, Topic 12: Electronic Journal (E-Journal) first appeared, and then, in 1986, Topic 6: OA Publishing first appeared. In 1987, Topic 9: Academic Infrastructure (Academic Infra), Topic 13: Preservation, and Topic 17: Research Data first appeared. In 1988, Topic 8: Research Cooperation first appeared, and in 1989, other topics such as Topic 4: Copyright and Topic 5: Online Information Search (OIS) were started.
In 1963, Science Citation Index (SCI) was published. Topic 18: Research Evaluation appeared in the 1970s when the ranking of influence by journals was also published. Besides this, electronic journals started in the late 1970s (Lancaster, 1995), and in the 1980s, the serial pricing crisis was raised as a big problem due to the continuous increase in subscription fees for printed journals (European Commission, 2019). In this context, the discussions on Topic 3: Technology Element, Topic 1: Academic Publication, Topic 2: ULS, and Topic 12: E-Journal were followed sequentially. Next, Topic 6: OA Publishing and Topic 7: Green OA, which included discussions on solutions to them, appeared (Table 3).
Table 3
First appearance and distribution of the topics
| Topic No. | Year | |||||||
|---|---|---|---|---|---|---|---|---|
| 1976 | 1983 | 1984 | 1985 | 1986 | 1987 | 1988 | 1989 | |
| 1 | 0.88 | 1.18 | ||||||
| 2 | 0.87 | 0.87 | 0.01 | |||||
| 3 | 0.72 | 0.01 | ||||||
| 4 | 0.86 | |||||||
| 5 | 0.01 | |||||||
| 6 | 0.15 | 0.01 | ||||||
| 7 | 0.01 | |||||||
| 8 | 0.85 | 0.01 | ||||||
| 9 | 0.87 | 0.01 | ||||||
| 10 | 0.83 | |||||||
| 11 | 0.01 | |||||||
| 12 | 0.86 | 0.82 | ||||||
| 13 | 0.85 | 0.01 | ||||||
| 14 | 0.01 | |||||||
| 15 | 0.01 | |||||||
| 16 | 0.58 | |||||||
| 17 | 0.85 | 0.01 | ||||||
| 18 | 0.87 | 0.86 | 0.88 | |||||
| 19 | 0.01 | |||||||
| Total | 0.87 | 0.72 | 1.75 | 0.86 | 1.01 | 2.57 | 1.72 | 5.28 |
Topic 1, Academic Publication; Topic 2, University Library Service (ULS); Topic 3, Technology Element; Topic 4, Copyright; Topic 5, Online Information Search (OIS); Topic 6, Open Access Publishing (OA Publishing); Topic 7, Green Open Access (Green OA); Topic 8, Research Cooperation; Topic 9, Academic Infrastructure (Academic Infra); Topic 10, Digital Communication; Topic 11, Researcher Network; Topic 12, Electronic Journal (E-journal); Topic 13, Preservation; Topic 14, Research Resource Management (RRM); Topic 15, Institute Policy; Topic 16, Institutional Repository (IR); Topic 17, Research Data; Topic 18, Research Evaluation; Topic 19, Informal Communication.
The topics related to technology appear in the order of Topic 3: Technology Element, Topic 5: OIS, and Topic 10: Digital Communication. Starting with Topic 3: Technology Element, which is related to the impact of science and technology, the focus spread to Topic 5: OIS, which focuses on retrieving and searching for online information. Then, Topic 10: Digital Communication appeared, which focuses on the whole digital-based communication process. It means that the scholarly communication research topics related to technology became more specified with the advance of technology.
4.3.2. Upward Topics and Downward Topics
The amount of scholarly communication research has increased rapidly since 2014, which caused the increase of the topics’ distribution. In consideration of this, each topic’s distribution was calculated by dividing each topic’s distribution by the sum of distribution in the year. By analyzing this, three upward topics and two downward topics were identified among the topics. The three upward topics were Topic 6: OA Publishing, Topic 7: Green OA, and Topic 19: Informal Communication. The two downward topics were Topic 11: Researcher Network and Topic 12: E-Journal (Fig. 5).
Fig. 5
Upward topics. Topic 6, Open Access Publishing (OA Publishing); Topic 7, Green Open Access (Green OA); Topic 19, Informal Communication.
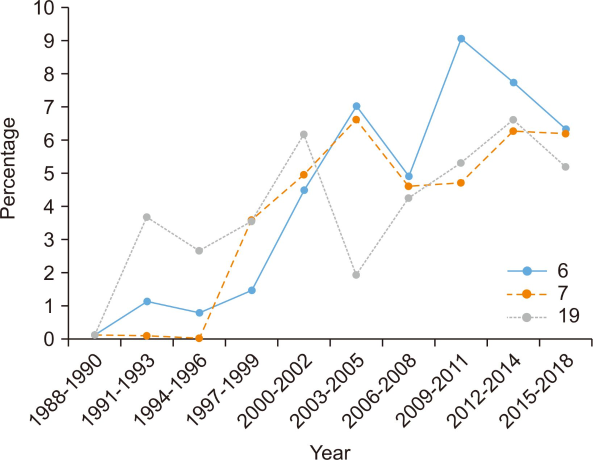
OA publishing is a strategy that allows everyone to access articles simultaneously as they are published (European Commission, 2019). Topic 6: OA Publishing increased since the Budapest Declaration in 2002 and rapidly increased in the early 2010s when Biomed Central developed the Article Process Cost (APC) model (European Commission, 2019).
Green OA, topic 7, is an OA strategy where researchers deposit their articles in the repository. Topic 7: Green OA was studied in a small proportion and the rate started to rise earlier than Topic 6: OA Publishing. It means that Green OA is discussed by scholars as a traditional OA strategy. The upward trend of both OA topics shows that more researchers are getting interested in OA and OA is becoming more important in scholarly communication.
In the comparison of Topic 6: OA Publishing and Topic 7: Green OA, they increased or decreased in the same period before 2012. However, there is a difference between 2012-2014 and 2015-2018. Topic 7: Green OA increased, while Topic 6: OA Publishing decreased. In that period, a national level OA policy started in various countries, such as Spain (Cha et al., 2017). The policy is deeply related to Green OA in that the researcher is obligated to open the articles to the public within a specific period. The difference in the fluctuations between Topic 6: OA Publishing and Topic 7: Green OA is because of the policy trend. Although Topic 6: OA Publishing decreased in the corresponding section, the percentage of research on topic 7 was 6.31%, similar to the 6.17% of topic 6.
Informal communication, topic 19, is another one of the types of scholarly communication. It is a personal and social communication method that includes sharing opinions through face-to-face discussion (Garvey, 1979; Mukherjee, 2009). As the development of the Internet affected scholarly communication in general, scholarly communication was actively conducted on the Internet in the 1990s (Barjak, 2006). In the 21st century, informal communication was advanced based on the development of the platform (Van Noorden, 2014). Topic 19: Informal Communication also increased significantly in the 1990s and is increasing except for the 2003-2005 section, when discussions of OA began to occur. It means research about informal communication has become more focused, following the advance of technology.
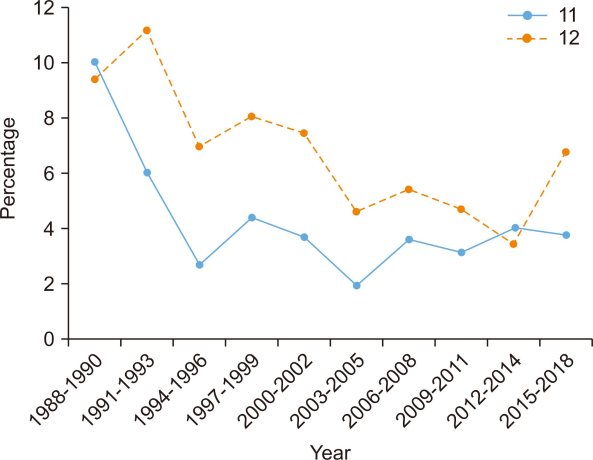
Topic 11: Researcher Networks accounted for 10% of the total research in 1988-1990 but since then has declined. Since 2006, when social media such as Twitter were widespread (Barjak, 2006), research on researchers’ networks has increased a little. It occupied only 3.75% in 2015-2018.
Topic 12: E-Journal occupied 9.36% in 1988-1990 and 11.17% in 1991-1993. However, since then it has shown a downward trend. In the early 1990s, large publishing companies such as Elsevier began to develop pricing models for digital publishing. Also, between 1990 and 1993, projects to make electronic journals online accessible were implemented (Lancaster, 1995). Later, as electronic journals became popular, they have replaced print journals in many libraries since 1996 (European Commission, 2019). Because the electronic journal format became common and popularized, the number of studies on the electronic journal decreased. However, research related to electronic journals continued to progress along with subscription issues, and the proportion of Topic 12: E-Journal increased during 2015-2018 when they started to develop an OA policy. However, the proportion in 2015-2018, 6.78%, is less than 11.17%, which is the highest proportion between 1991 and 1993 (Fig. 6).
The results of time series analysis infer that scholarly communication research changed following the advance of scholarly communication. According to the analysis of the first appearance of the topic, the topics related to technology became more specified, following various technological advances. More countries try to spread OA and both of two topics, Topic 6: OA Publishing and Topic 7: Green OA, the most closely related to OA, show an upward trend. It means OA gets more meaningful for both research and scholarly communication in this era. Besides this, many topics, such as Topic 3: Technology Element, were neutral. This infers that researchers focus on various aspects of scholarly communication constantly.
4.4. Result of Network Analysis
The top 30 words in each topic and the TF of each word were extracted. Then the Inverted Topic Frequency was calculated applying the concept of Inverted Document Frequency. The topic×word matrix was transformed to create the topic×topic (19*19) matrix. Cosine similarity coefficients were calculated based on the topic×topic matrix. The cosine matrix was used as the input value and a PFNet was created by using the pathfinder algorithm with r=∞ and q=n-1 through WNET ver. 0.4 program (Lee, 2013, 2014). NodeXL was used to visualize the network. The node’s size was the distribution of the topic, and the thickness of the link was the cosine similarity between the two topics in the network (Fig. 7).
4.4.1. Centrality of Topics
Three centrality values were identified in the topic network of scholarly communication research. First, the topics with high global centrality are broadly linked to topics across the field of scholarly communication research. Second, mediation centrality is a concept that measures how much one node (topic) performs an intermediary or bridge role in constructing a network with another node (topic). Lastly, high regional centrality topics are influential topics within the cluster (Lee, 2012).
Because the PFNet using cosine similarity is a weighted network, the centrality measures proposed by Lee (2006c) were used. In order to grasp the mediation centrality of the topics, TBC was used. The TBC can be used as both regional centrality and global centrality depending on the measurement range. In this study, since the number of nodes (topic) is only nineteen, the value was calculated globally.
Cmp was used to analyze the global centrality of the topics. Cmp considers patterns with high and low associations with other nodes. It is a value obtained by averaging the profile association and measuring the similarity between profile vectors by the Pearson correlation coefficient (Table 4).
Table 4
Mean profile association (Cmp) and triangle betweenness centrality (TBC) of each topic
| Topic No. | Topic | Cmp (-1 to 1) | TBC | rTBC (0 to 1) |
|---|---|---|---|---|
| 1 | Academic Publication | 0.07526 | 58 | 0.37908 |
| 2 | University Library Service (ULS) | -0.09105 | 50 | 0.32680 |
| 3 | Technology Element | -0.08386 | 48 | 0.31373 |
| 4 | Copyright | 0.01873 | 24 | 0.15686 |
| 5 | Online Information Search (OIS) | 0.06370 | 58 | 0.37908 |
| 6 | Open Access Publishing (OA Publishing) | -0.00257 | 25 | 0.16340 |
| 7 | Green Open Access (Green OA) | -0.05637 | 16 | 0.10458 |
| 8 | Research Cooperation | 0.06743 | 66 | 0.43137 |
| 9 | Academic Infrastructure (Academic Infra) | 0.01427 | 43 | 0.28105 |
| 10 | Digital Communication | -0.00717 | 25 | 0.16340 |
| 11 | Researcher Network | 0.09214 | 59 | 0.38562 |
| 12 | Electronic Journal | 0.06725 | 61 | 0.39869 |
| 13 | Preservation | 0.09892 | 55 | 0.35948 |
| 14 | Research Resource Management (RRM) | 0.09416 | 80 | 0.52288 |
| 15 | Institute Policy | 0.13389 | 69 | 0.45098 |
| 16 | Institutional Repository (IR) | 0.12997 | 57 | 0.37255 |
| 17 | Research Data | -0.03695 | 40 | 0.26144 |
| 18 | Research Evaluation | 0.10675 | 59 | 0.38562 |
| 19 | Informal Communication | 0.12846 | 76 | 0.49673 |
If the node is located in the middle of the network and the correlation value with other nodes is low, the mean correlation could appear low. In this case, the centrality can be identified using the Cmp. The nodes with high Cmp are located in the center of the network, while the nodes with low Cmp are located in the network’s surrounding area. The TBC represents the degree to which one node mediates other nodes, and the value is normalized to 0 to 1 (rTBC). Table 5 shows the top 5 nodes based on each centrality value.
Table 5
Top five nodes with centrality of mean profile association (Cmp) and highest triangle betweenness centrality (TBC)
| Topic No. | Topic | Cmp (-1 to 1) | Topic No. | Topic | TBC | rTBC (0 to 1) |
|---|---|---|---|---|---|---|
| 15 | Institute Policy | 0.13389 | 14 | Research Resource Management (RRM) | 80 | 0.52288 |
| 16 | Institutional Repository (IR) | 0.12997 | 19 | Informal Communication | 76 | 0.49673 |
| 19 | Informal Communication | 0.12846 | 15 | Institute Policy | 69 | 0.45098 |
| 18 | Research Evaluation | 0.10675 | 8 | Research Cooperation | 66 | 0.43137 |
| 13 | Preservation | 0.09892 | 12 | Electronic Journal (E-Journal) | 61 | 0.39869 |
The topics with high Cmp and TBC were Topic 15: Institute Policy, and Topic 19: Informal Communication. It means that Topic 15: Institute Policy and Topic 19: Informal Communication were located in the center of the network, and mediated other topics well. Also, they include ‘link,’ ‘internet,’ ‘digit*,’ ‘data,’ and ‘inform*.’ It means that the two topics, which are located at the center of the topic network and function as a mediator, share the context of digital information.
The top five topics with high Cmp are Topic 15: Institute Policy, Topic 16: Institutional Repository (IR), Topic 19: Informal Communication, Topic 18: Research Evaluation, and Topic 13: Preservation. They all included ‘academ*,’ ‘research,’ ‘data,’ and ‘articl*’. Through this, it is inferred that the top five topics at the center of the topic network were studies of the research outcomes.
Topics with a high Cmp, including Topic 14: Research Resource Management (RRM) with the sixth highest Cmp, are highly related to research institution, except Topic 19: Informal Communication. Research evaluation is a method to measure universities’ or research institutes’ rank, and it is related to the compensation of researchers provided by institutions. Preservation and resource management are essential functions of institutional repositories. It means the topics related to the institute are relatively located on the middle of the scholarly communication research network.
The top five topics with normalized TBC were Topic 14: RRM, Topic 19: Informal Communication, Topic 15: Institute Policy, Topic 8: Research Cooperation, and Topic 12: E-Journal. They shared ‘citat*.’ Also, the sixth highest TBC topic was Topic 18: Research Evaluation. It could be said that topics about citation are instrumental in mediating other topics.
The NNC was used to analyze the regional centrality of the topics. NNC is calculated by analyzing how much the node is considered the nearest neighbor by other nodes. The NNC was used to analyze the characteristics of topics in each cluster.
4.4.2. Cluster of Topics
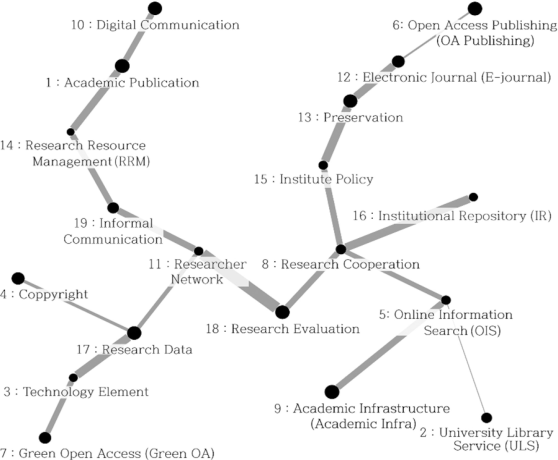
In analysis of the centrality of a few core nodes, the interpretation is not straightforward because individual nodes may be multifaceted. In this case, cluster analysis can be used to increase the discrimination of the subject analysis, because the common subjects of several nodes in the cluster are extracted, and more specific subjects are identified (Lee, 2006b). In this study, the parallel nearest neighbor clustering technique (PNNC) of Lee (2006b) was applied to extract the cluster from the topic network of scholarly communication research. PNNC analysis was performed through WNET ver 0.4, which was used to apply the Pathfinder algorithm. As a result, six clusters were identified, and the clusters are visualized with different colors. The node size in each cluster was decided depending on the NNC value (Fig. 8).
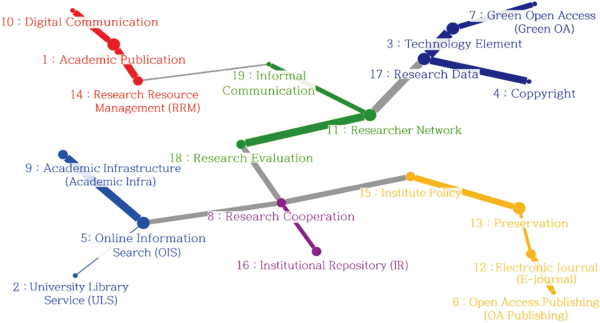
Table 6 summarizes the nearest node of each node belonging cluster and the relative NNC (rNNC, 0 to 1), which is the normalized NNC between 0 and 1.
Table 6
Nearest neighbor centrality of topics in six clusters
| Cluster | Topic | rNNC (0 to 1) | Nearest neighbor | ||
|---|---|---|---|---|---|
| 1 | 1 | Academic Publication | 0.11111 | 14 | Research Resource Management (RRM) |
| 10 | Digital Communication | 0 | 1 | Academic Publication | |
| 14 | Research Resource Management (RRM) | 0.05556 | 1 | Academic Publication | |
| 2 | 2 | University Library Service (ULS) | 0 | 5 | Online Information Search (OIS) |
| 5 | Online Information Search (OIS) | 0.11111 | 9 | Academic Infrastructure (Academic Infra) | |
| 9 | Academic Infrastructure (Academic Infra) | 0.05556 | 5 | Online Information Search (OIS) | |
| 3 | 3 | Technology Element | 0.11111 | 17 | Research Data |
| 4 | Copyright | 0 | 17 | Research Data | |
| 7 | Green Open Access (Green OA) | 0 | 3 | Technology Element | |
| 17 | Research Data | 0.11111 | 3 | Technology Element | |
| 4 | 6 | Open Access Publishing (OA Publishing) | 0 | 12 | Electronic Journal (E-Journal) |
| 12 | Electronic Journal (E-Journal) | 0.05556 | 13 | Preservation | |
| 13 | Preservation | 0.11111 | 15 | Institute Policy | |
| 15 | Institute Policy | 0.05556 | 13 | Preservation | |
| 5 | 8 | Research Cooperation | 0.05556 | 16 | Institutional Repository (IR) |
| 16 | Institutional Repository (IR) | 0.05556 | 8 | Research Cooperation | |
| 6 | 11 | Researcher Network | 0.11111 | 18 | Research Evaluation |
| 18 | Research Evaluation | 0.05556 | 11 | Researcher Network | |
| 19 | Informal Communication | 0 | 11 | Researcher Network | |
Cluster 1 consists of Topic 1: Academic Publication, Topic 10: Digital Communication, and Topic 14: RRM. Topic 1: Academic Publication displays the highest rNNC. The words ‘inform*,’ ‘journal,’ ‘academ*,’ and ‘use’ are included in all three subjects. Also, three topics shared the word ‘provid*’ or ‘servic*.’ This means the three topics share the context of information supply.
Cluster 2 is composed of Topic 2: ULS, Topic 5: OIS, and Topic 9: Academic Infra. Topic 5: OIS displays the highest rNNC. All three subjects share the words ‘research’ and ‘journal,’ ‘articl*,’ ‘data,’ and ‘librari*.’ Also, they include ‘support’ or ‘servic*’. This means that topics in cluster 2 linked to each other in the point of research support. Topic 5: OIS displays the largest rNNC in cluster 2 and the sixth lowest TBC. Both the TBC and Cmp of Topic 2: ULS and Topic 9: Academic Infra belong to the lower level. The character of the centrality of topics in cluster 2 shows that the topics of cluster 2 are independent.
Cluster 3 contains Topic 3: Technology Element, Topic 4: Copyright, Topic 7: Green OA, and Topic 17: Research Data. They share ‘academ*,’ ‘data,’ ‘journal,’ and ‘open_access.’ More than one topics include ‘elecron*’ or ‘technolog*.’ This means that the topics are related in the context of science and technology. The topics of cluster 3 are independent among all academic communication research topics in that they have a lower global centrality. Topic 3: Technology Element and Topic 17: Research Data are the closest neighbors to each other, so the connection between the two topics is strong. It shows that studies about the research data and studies about the technical elements are related to each other.
Cluster 4 includes Topic 6: OA Publishing, Topic 12: E-Journal, Topic 13: Preservation, and Topic 15: Institute Policy. Topics of cluster 4 share ‘data,’ ‘academ*,’ and ‘publish.’ They include ‘manag*’ or ‘access.’ This infers that topics of cluster 4 are linked with the context of research management. Topic 13: Preservation is the node with the highest rNNC and the fifth highest Cmp. In that sense, it is located at the center of the whole network and mediates the topics in the cluster. Topic 12: E-Journal has the fifth-highest TBC, which significantly functions as mediation in the whole network, while the regional centrality is lower than for Topic 13: Preservation. Topic 6: OA Publishing has lower TBC and rNNC. This means that Topic 6: OA Publishing is independent. Topic 15: Institute Policy displays the highest Cmp and the third highest TBC, and the second lowest rNNC. In that sense, Topic 15: Institute Policy locates in the middle of the whole network and mediates the topics at the global level rather than the regional level.
Cluster 5 consists of Topic 8: Research Cooperation, and Topic 16: IR. They share ‘system’ and ‘model’ and link to each other with the system context. Topic 8: Research Cooperation has the fourth highest TBC, and Topic 16: IR has the second highest Cmp and closest node. In cluster 5, the topic with significant mediation values and the topic located at the center are strongly linked to each other with the system context.
Group 6 includes Topic 11: Researcher Networks, Topic 18: Research Evaluation, and Topic 19: Informal Communication. All three topics include ‘academ*’ and ‘review,’ or ‘peer_review,’ and they include ‘scientist’ or ‘author,’ meaning the topics linked in the academic exchange context. Topic 11: Researcher Networks has the highest rNNC and lower TBC. Although the role of mediator at the global level is small, it is deeply related to the other topics within the cluster. On the other hand, Topic 19: Informal Communication has high TBC and Cmp, but the rNNC of topic 19 is 0. It means that Topic 19: Informal Communication has a significant role in mediating the global level, but the connection is weak within the cluster.
As a result of the network analysis, high ranked topics were different depending on the centralities. Through this, the locational characteristics and mediation weight of the topic in the topic network were identified. The words shared by all topics were ‘academ*,’ ‘journal,’ and ‘data.’ These were words related to research resources. It means that all scholarly communication research topics share the context of research resources as shown in the definition.
5. CONCLUSIONS AND IMPLICATIONS
This study analyses scholarly communication research with informatics approaches. It identified scholarly communication research topics based on the articles published from 1970 to 2008 in the Scopus database and figured out research-inflected scholarly communication issues such as OA. Also, the topics shared different contexts. The results are summarized as follows.
First, LDA topic modeling identified nineteen scholarly communication research topics, including research resource management and research data. The proportion of topics were even. The topics were detailed and subdivided. It means that researchers have specified the topics of research over time. Simultaneously, the even proportion of the topics means they have conducted the study broadly and evenly.
Second, time series analysis found the order of topics’ first appearance and three upward topics and two downward topics. It infers that more and more various topics are being developed, following the advance of technology, and the trend of the topics reflects scholarly communication issues such as OA. Fourteen neutral topics indicate that researchers continue to focus on various aspects of scholarly communication.
Third, network analysis figured out the structural characteristic of scholarly communication research. Topics with high Cmp are related to the institution, and high TBC topics share the citation context. It indicates the topics related to the institution are located in the center of the topic network, and topic related to citation mediates other topics closely. Besides this, all topics are related to the academic resources, and six clusters figured by PNNC shared distinguished contexts. This verified that the research is focused on the academic resources under the definition of scholarly communication and, at the same time, each of them is conducted on a different aspect.
As observed in its various concepts, scholarly communication contains broad issues related to the research society. This could cause ambiguity when researchers understand scholarly communication and start new research about it. In that sense, topics of scholarly communication research, their trend, and structural characteristics identified through this research are helpful in order to understand what scholarly communication is and how researchers studied it. The topics were detailed, and they became more varied over time. Even though there was limited research data because very few articles were published from 1976 to 1988 at the early stage of the research, the characteristics of scholarly communication topics derived can be used as data for researchers to find a new theme in the future.
REFERENCES
, (2018) Scholarly communication and the academic library: Perceptions and recent developments https://www.intechopen.com/books/a-complex-systems-perspective-of-communication-from-cells-to-societies/scholarly-communication-and-the-academic-library-perceptions-and-recent-developments
(1995) The evolution of electronic publishing Library Trends, 43(4), 518-527 https://www.ideals.illinois.edu/bitstream/handle/2142/7981/librarytrendsv43i4c_opt.pdf.
(2012) Topic modeling for humanists: A guided tour http://www.scottbot.net/HIAL/index.html@p=19113.html
- Submission Date
- 2020-11-24
- Revised Date
- 2021-04-24
- Accepted Date
- 2021-04-28
- 649Downloaded
- 1,465Viewed
- 0KCI Citations
- 0WOS Citations