Analysis on Literature Review of Internet of Things Adoption Among the Consumer at the Individual Level

Mohd Heikal Husin (School of Computer Sciences, Universiti Sains Malaysia, 11800 USM Penang, Malaysia)

Mohd Najwadi Yusoff (School of Computer Sciences, Universiti Sains Malaysia, 11800 USM Penang, Malaysia)

Abstract
The research in the literature review on Internet of Things (IoT) adoption from an individual consumer viewpoint is minimal and has not yet been fully investigated. Therefore, the objectives of this study are to analyze the growth of IoT in recent years and to conduct a weight analysis of the factors that affect acceptance intentions and real usage of IoT-enabled services. For the review, we analyzed 87 publications from 13 conferences and 54 journals published during the period 2014-2020 about consumer adoption of IoT. Following the study, we discovered an unprecedented increase in the number of articles published in the last seven years, which points to an emerging area with an enormous prospect. Furthermore, the weight analysis outcome was associated with the diagrammatic representation in this study. After that, this research developed a generalized consumer IoT adoption model based on the 12 best predictors derived from frequency count and weight analysis, which had the highest predictive power for calculating IoT adoption. This paper further acknowledges the study’s theoretical and practical contributions, as well as its shortcomings, and proposes further research directions for future researchers.
- keywords
- diagrammatic representation, individual-level, internet of things, systematic literature review, weight analysis
1. INTRODUCTION
The number of Internet of Things (IoT) devices is rapidly increasing (Saleem et al., 2018). Almolhis et al. (2020) backed up this conclusion, adding that the rapid rise of IoT technology has the potential to affect all aspects of human life. Essentially, the manufacturing and industrial sectors are driving this IoT expansion. Nonetheless, the growth from a research standpoint has not been widely explored. The number of publications on IoT is rising, according to Kotha and Gupta (2018). They did not, however, present any proof to back up their assertion. On the other side, if this fast expansion is not adequately addressed, IoT might pose issues in terms of interoperability, communication, data processing, integration, security, and privacy (Saleem et al., 2018). Even though research in IoT-related domains began in 2008 throughout the world, the rise was seen after 2013 in numerous high-quality journals listed on the Web of Science, Scopus, and other databases (Mącik, 2017). As a result, in order to examine current developments, the research needs to look at publications published after 2013.
Nonetheless, research on individual consumers’ perceptions about IoT adoption is currently lacking in the IoT literature, which focuses more on the technology aspect (AlHogail, 2018). Understanding customer acceptability has become a must for bringing IoT solutions into everyday life. Because the IoT is still in its early phases, only a small amount of interest has been paid from the standpoint of individual consumers (Lee & Shin, 2019). Individual acceptability, according to Kim and Kim (2016), is one of the barriers to IoT technology innovation that must be addressed. This argument is backed up by Hsu and Lin (2018), who have also pointed out that influencing factors of IoT applications and services have received little attention. On the other hand, deciding whether to go with a generic or specific model is always a challenging issue (Fahmideh et al., 2020). In any case, a generic model is required to be developed in the IoT domain which will not be customized to any specific application. This generic paradigm, according to Attali et al. (2010), has major implications for acceptance since it allows for more meaningful interpretation. These models are also adaptable and transferable to other particular applications (Fahmideh et al., 2020; Rothgangel & Riegel, 2021).
Apart from this, according to Brous et al. (2017), despite the obvious prospects and optimism, IoT adoption remains low. Karahoca et al. (2018) have further added that the determination of influencing factors is vital to increasing consumer IoT adoption. In contrast, a systematic literature review (SLR) study is necessary to determine the influencing factors (George et al., 2016; Meng et al., 2021; Thuan et al., 2016). Notably, an SLR study provides a globally standard, accurate, and consistent literature review (Crocetti, 2016). Therefore, the purpose of this SLR is to enhance consumer IoT adoption by addressing the research gaps discussed above. On the other hand, the reason for performing weight analysis is that the weights represent an independent variable’s predictive power (Jeyaraj et al., 2006). Moreover, weight estimation and meta-analysis have a closer relationship, since the larger the weight of an independent variable, the more likely it is to be significant when conducting a quantitative investigation (Rana et al., 2015). Therefore, this study’s objectives are as follows:
-
To explore the growth of IoT among the consumer at the individual level during the period 2014-2020
-
To perform the weight evaluation of the variables that influence the adoption intention and actual usage of IoT applications
-
To develop a generic IoT adoption model derived from weight analysis
Thus, the rest of the sections of this article are organized as follows: Section 2 contains the fundamental information related to IoT adoption, weight, and their relationships. The methodology is outlined in Section 3 along with the entire review procedure. Following that, in Section 4 the study’s findings are presented. Subsequently in Section 5, there is a discussion of the study findings. A conclusion remark, as well as the implications of this study withthe study’s weaknesses and some ideas for future research, is included in the last section.
2. THEORETICAL BACKGROUND
To have a complete awareness of the target region, the following issues will be investigated. To be specific, in this section five topics will be discussed. A brief overview of IoT and its global acceptance will be explored first. Afterward, the weight calculation process will be briefly explained. Next, the relationships between IoT adoption and weight calculation will be depicted. Finally, review studies of IoT adoption will be explored.
2.1. Overview of IoT
IoT was initially formed using the idea of pervasive computing proposed by Mark Weiser in 1991. Later on in 1999, Kevin Ashton first proposed IoT as a means of communication through RFID tags. Now, IoT is based on these two ideas to connect and create communication among every living and dead object (Chin et al., 2019). In the last 20 years, the application of IoT has become versatile and used in different sectors. Further, the definitions are noticed to vary in many papers based on the applications or topic of interest since no standard definition has been established yet (Sidek & Ali, 2019). However, according to Gubbi et al. (2013), such things are considered the dynamic participants in industry, knowledge, and social systems in which they can engage and connect. These IoT devices share data and information with their surroundings when autonomously responding to and shaping physical world activities by operating processes that cause acts and build resources with or without uninterrupted human interference. Later on, Saint and Garba (2016) argued that IoT is a digital network for the information association that allows progressive services through communicating with virtual and real entities based on current and emerging information and communication technologies.
2.2. Global Acceptance of IoT
In 2011, the number of IoT devices surpassed 7 billion global populations worldwide (Chatterjee & Kar, 2018). According to Gupta and Gupta (2016), the number of connected devices was 0.08 per person in 2003 and it became 6.58 in 2020, approximately. Interestingly, the number of IoT devices is observed to vary in different studies, which became approximately 24 billion (Gubbi et al., 2013), 28 billion (Chatterjee & Kar, 2018), and 40.9 billion (Harnessing the Internet of Things for Global Development, 2016) in 2020. Besides this, the market value of IoT hardware and applications was found as USD$10 billion and USD$70 billion in 2015 (Harnessing the Internet of Things for Global Development, 2016). Furthermore, IoT was rated as the most anticipated technology as per the Gartner hype cycle in the year 2014-2015, and still the domination over other technologies continues (Yasumoto et al., 2016).
Moreover, many IoT-based projects have been running worldwide, and only a few of them are as follows. First, we can name some of the IoT projects run by the EU such as IoT-A, Butler, IoT.est, RELYonIT, and IoT6 (Gazis et al., 2015). Second, the UK has funded an IoT innovation project worth £5 million (Li et al., 2015). Third, Japan has introduced “u-Japan x ICT” and “I plan” to implement IoT for all aspects of everyday life (Li et al., 2015). Fourth, Rwanda, Nigeria, Kenya, and South Africa are among the African countries that have already incorporated IoT into their national development plans (Saint & Garba, 2016). Last, worldwide recognized companies including IBM, Intel, Cisco, Qualcomm, Samsung, Microsoft, Facebook, HP, Amazon, Huawei, SAP, and Google are also involved intensively in this IoT evolution (Economides, 2017). Therefore, it is evident that many developed and developing countries along with organizations have realized the importance of IoT and have initiated several IoT-based projects for national and global development.
2.3. Overview of Weight
The weight can be defined as a predictive strength of an independent variable (Jeyaraj et al., 2006). It is determined by dividing the number of significant relationships by the total number of relationships. When we assign weight to a variable, that variable is assumed to be a weighted variable. To evaluate the weight, first we have to find out how many times a certain link between constructs has been studied, and then determine how many of these correlations are significant. The weight significance of a link between the constructs is calculated by dividing the second data value by the first. The value of weight ‘1’ designates that the association between two constructs is significant in all papers whereas ‘0’ specifies the association to be non-significant in all evaluated papers (Jeyaraj et al., 2006; Rana et al., 2015). Moreover, Jeyaraj et al. (2006) have divided the exogenous variables into two types, well-utilized (WUT) and experimental (EXPR). ‘Well-utilized’ is a variable that is evaluated five times or more during review and experimental variables are those measured less than five times. Some of the well-utilized variables are known as best-predictors (BPR) when their weight value is 0.8 or above. On the other hand, some of the experimental variables can be called promising predictors (PROM) when their weight value is 1. Notably, we will try to find the best predictors in this study to develop a new generalized IoT adoption model. Additionally, we will find promising predictors for further studies. Importantly, we cannot just declare the best predictor based on their weight values rather these values have to be well-utilized.
2.4. Relationships Between Weight and IoT Adoption
The concept of weight has been inherited from Jeyaraj et al. (2006) and Rana et al. (2015). In fact, an independent variable’s predictive capacity in a particular relationship is assessed using this method (Jeyaraj et al., 2006). Researchers should identify convincing reasons to utilize such predictors within the model, according to Jeyaraj et al. (2006). On the other hand, IoT is now one of the most innovative and promising technologies. However, the IoT is arguably in its process of adoption (Basaure et al., 2020). Page et al. (2018) agree with this assertion, adding that consumer demand for IoT services is far lower than expected. As a result, if the influencing elements impacting consumer acceptance are not extensively identified, IoT technology will be neglected and advancement will be unsuccessful (Alkawsi & Ali, 2018). To improve adoption, it is crucial to understand customer approval and identify the elements that influence user adoption of IoT. This viewpoint is shared by Gao and Bai (2014), who urge greater study into the factors that influence individualconsumer acceptability of IoT devices.
Hence, we need to find out the factors that can assist people to adopt IoT-enabled services. Many researchers have used several theories and external variables in different IoT domains. However, the performances of these variables are seen to fluctuate based on the types of domains and applications. To illustrate, the relationships between the dependent and independent variables are not always significant in different IoT applications. Consequently, these independent variables cannot always perform as an efficient predictor of the dependent variables. Thus, the performance of each variable needs to be valued based on its performance. On the other hand, highly weighted variables (0.8 and above) have a high probability to become efficient predictors and their relationships can become significant as well. Rana et al. (2015) have also suggested assigning the weight to each variable so that their previous performance can be understood and their stability within the model can be confirmed. Consequently, this weight analysis can assist to find out effective factors that influence IoT adoption. Moreover, this analysis may be used as a reference for future constructs and can be further studied to show their performances (Rana et al., 2015).
2.5. Literature Review of IoT Adoption
The IoT has already gained interest from academicians, analysts, entrepreneurs, and practitioners due to its high potential (Suppatvech et al., 2019). Several review studies have been conducted to examine the notion of IoT in various fields. To illustrate, the majority of the review papers have focused on the adoption of IoT technology by organizations (Brous et al., 2020; Carcary et al., 2018). In addition, some of these papers reviewed particular IoT-supported applications and services. We can take cyber security (Lee, 2020), healthcare (Shah & Chircu, 2018), smart homes (Stojkoska & Trivodaliev, 2017), blockchain (Wang et al., 2019), education (Dominguez & Ochoa, 2017), and security (Ammar et al., 2018) for example. However, studies related to the literature review of IoT adoption targeted to individual consumers are limited and have not been extensively explored (Alkawsi & Ali, 2018). Only a few numbers of studies are identified to review the consumer adoption of IoT technologies (Al-Momani et al., 2019; Almomani & Rahman, 2022). These review studies, on the other hand, did not contain a weight analysis or recommend any factor that may aid in IoT adoption.
3. METHODOLOGY
In this study, the following steps (see Fig. 1) were followed as directed by Kitchenham and Charters (2007) and Ain et al. (2019). This study began by stating the research objectives and was completed with a discussion of the findings. In between, databases were selected, articles were searched, papers were filtered based on inclusion criteria, data were extracted from those papers, and results were demonstrated.
Since the context of this study fits our research, Alkawsi and Ali (2018) were followed to identify the literature databases for this investigation. In addition, these databases provide access to prestigious journals as well as high-quality andpeer-reviewed conference papers. Hence, the exploration was performed on five databases, ScienceDirect, Scopus, Google Scholar, IEEE Explore, and Taylor & Francis from August 5 to September 30, 2020. Our search was initiated for the papers associated with IoT adoption. Afterward, the following phrases and keywords were utilized: “IoT adoption,” “IoT adoption intention,” “IoT adoption behavior,” “Consumer IoT adoption,” “Consumer IoT model,” and “IoT adoption model,” in all possible permutations and combinations. Also, another keyword, “acceptance,” replaced the word “adoption” in all cases. In order to address the three research objectives, the following inclusion parameter in Table 1 was followed. It is worth mentioning that based on these parameters, the articles were collected from the above-mentioned five databases.
Table 1
Inclusion parameters
| No. | Inclusion | Exclusion |
|---|---|---|
| 1 | Studied within the IoT domain | Studied outside of the IoT domain |
| 2 | Articles that were published between 2014 and 2020 | Articles that were published before 2014 |
| 3 | Articles that were written in English | Articles that were written in other languages |
| 4 | Only conference papers and journals | White papers, books, book chapters, editorials, review papers, etc. |
| 5 | Adoption or acceptance of IoT applications | Technical implementation of IoT-related applications i.e., algorithms, prototype development, etc. |
| 6 | Only the quantitative, full length, empirically verified articles from structured equation modeling | Only pilot test, pre-test, conceptual models, technical models without structured equation modeling |
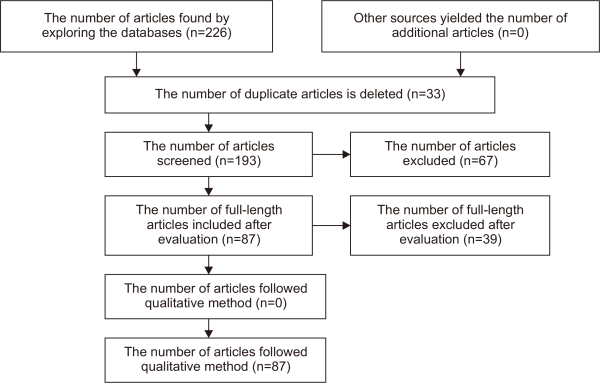
All of the articles chosen for this study were empirically evaluated in the IoT area using a quantitative approach. General context materials, technical papers, articles written in languages other than English, articles focusing on the organizational viewpoint, periodical articles, etc. were filtered out. Afterward, based on the recommendations of Suppatvech et al. (2019), the 226 downloaded papers from the above-mentioned databases were screened in these three stages (see Fig. 2). Through these steps, duplicate articles were removed from the downloaded articles. Next, these papers were screened through the support of paper title, abstract, and full text.
Here, ‘n’ denotes the number of articles that were accepted after each stage. At the accomplishment of screening, 87 papers were selected for SLR from 13 conferences and 54 journals. The flow diagram can be found in Fig. 3. This flow diagram demonstrates the procedure of how the 87 articles were selected for analysis from the initial discovery of 226 articles. This diagram further explores how the desired articles were confirmed after each step of selection.
Finally, this study followed two types of analysis procedures. These are descriptive exploration as advised by Suppatvech et al. (2019), and weight evaluation as suggested by Jeyaraj et al. (2006). To illustrate, the descriptive analysis focused on the classification of papers according to the name of authors, their countries, publication year, journals, sample type, dependent variables, independent variables, etc. On the other hand, weight evaluation of the variables was performed using the procedure explained in Section 2.3. In order to perform these analyzing procedures, data were extracted from the 87 papers using an Excel worksheet. Afterward, the frequency of the variables from different theories and models was counted. Notably, the figures and tables of the next section were achieved based on the data extracted from this Excel worksheet. The fields used in the Excel worksheet are shown in Table 2.
4. RESULTS
Interesting insights into publishing patterns were found in the quantitative review of the articles.
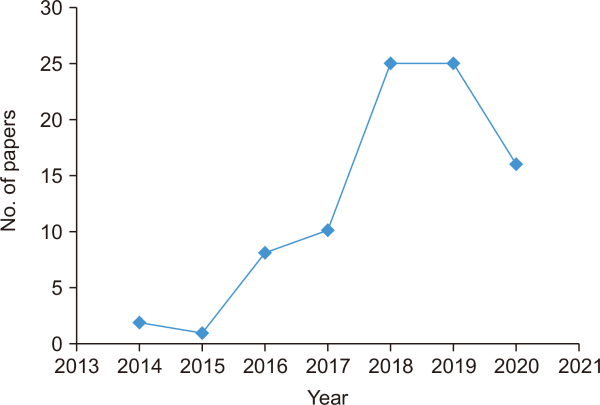
The upsurge in the number of articles published during 2015-2018 is shown in Fig. 4. The highest number of papers is found during these two years 2018 and 2019, which accumulates 57.47% of total papers. However, no accurate picture is observed for 2020 from the graph since paper searching activities were completed at the end of September 2020 and no paper in 2020 has been contributed yet by the conferences. However, we can observe a more narrative picture in the distribution of journals across these years in the following table (see Table 3).
Table 3
List of journals and conferences with sharing of articles across the years
| No. | Sources | 2014 | 2015 | 2016 | 2017 | 2018 | 2019 | 2020 | Frequency |
|---|---|---|---|---|---|---|---|---|---|
| 1 | Telematics and Informatics | 1 | 1 | 2 | 1 | 5 | |||
| 2 | Technological Forecasting & Social Change | 1 | 3 | 4 | |||||
| 3 | Behaviour & information technology | 3 | 1 | 4 | |||||
| 4 | Computers & Security | 1 | 1 | 1 | 3 | ||||
| 5 | International Journal of Information Management | 1 | 1 | 2 | |||||
| 6 | Kybernetes | 1 | 1 | 2 | |||||
| 7 | International Journal of Environmental Research and Public Health | 2 | 2 | ||||||
| 8 | IEEE Internet of Things Journal | 1 | 1 | 2 | |||||
| 9 | Technology in Society | 1 | 1 | 2 | |||||
| 10 | Computers in Human Behavior | 1 | 1 | 2 | |||||
| 11 | IEEE Access | 1 | 1 | 2 | |||||
| 12 | Journal of Computer Information Systems | 1 | 1 | 2 | |||||
| 13 | Journal of enabling technologies | 1 | 1 | ||||||
| 14 | Informatics | 1 | 1 | ||||||
| 15 | International Journal of Human-Computer Interaction | 1 | 1 | ||||||
| 16 | Cogent Business & Management | 1 | 1 | ||||||
| 17 | Journal of Business & Industrial Marketing | 1 | 1 | ||||||
| 18 | International Journal of Electrical and Computer Engineering | 1 | 1 | ||||||
| 19 | Journal of Sensors | 1 | 1 | ||||||
| 20 | Sustainability | 1 | 1 | ||||||
| 21 | Technologies | 1 | 1 | ||||||
| 22 | Government Information Quarterly | 1 | 1 | ||||||
| 23 | Journal of Enterprise Information management | 1 | 1 | ||||||
| 24 | Journal of King Saud University - Computer and Information Sciences | 1 | 1 | ||||||
| 25 | Journal of Organizational and End User Computing | 1 | 1 | ||||||
| 26 | International Journal of Innovation | 1 | 1 | ||||||
| 27 | Total Quality Management | 1 | 1 | ||||||
| 28 | Library Hi Tech | 1 | 1 | ||||||
| 29 | Journal of Retailing and Consumer Services | 1 | 1 | ||||||
| 30 | Asia Pacific Journal of Marketing and Logistics | 1 | 1 | ||||||
| 31 | Organizacija | 1 | 1 | ||||||
| 32 | Istanbul Gelisim University Journal of Social Sciences | 1 | 1 | ||||||
| 33 | Information Technology & People | 1 | 1 | ||||||
| 34 | Science & Technology | 1 | 1 | ||||||
| 35 | International Journal of Advanced Computer Science and Applications | 1 | 1 | ||||||
| 36 | International Journal of Social Sciences | 1 | 1 | ||||||
| 37 | Engineering, Technology & Applied Science Research | 1 | 1 | ||||||
| 38 | International Review of Management and Business Research | 1 | 1 | ||||||
| 39 | Journal of High Technology Management Research | 1 | 1 | ||||||
| 40 | International Journal of Production Research | 1 | 1 | ||||||
| 41 | Journal of Biomedical Informatics | 1 | 1 | ||||||
| 42 | Industrial Management & Data Systems | 1 | 1 | ||||||
| 43 | Information Technology & Tourism | 1 | 1 | ||||||
| 44 | Journal of Theoretical and Applied Information Technology | 1 | 1 | ||||||
| 45 | International Journal of Recent Technology and Engineering | 1 | 1 | ||||||
| 46 | Tecnología. Glosas de Innovación Aplicadas a la Pyme | 1 | 1 | ||||||
| 47 | International Journal of Sports Marketing and Sponsorship | 1 | 1 | ||||||
| 48 | Future Internet | 1 | 1 | ||||||
| 49 | International Journal of Engineering and Technology Innovation | 1 | 1 | ||||||
| 50 | International Journal of Production Economics | 1 | 1 | ||||||
| 51 | Alexandria Engineering Journal | 1 | 1 | ||||||
| 52 | Economic and Environmental Studies | 1 | 1 | ||||||
| 53 | Journal of Destination Marketing & Management | 1 | 1 | ||||||
| 54 | Asia Pacific Journal of Tourism Research | 1 | 1 | ||||||
| 55 | ITS Kyoto 2017, conference | 1 | 1 | ||||||
| 56 | PACIS 2016, conference | 1 | 1 | ||||||
| 57 | ECIS2018, conference | 1 | 1 | ||||||
| 58 | SIGITE 2018, conference | 1 | 1 | ||||||
| 59 | ICSEC 2016, conference | 1 | 1 | ||||||
| 60 | TEMSCON 2019, conference | 1 | 1 | ||||||
| 61 | CAST 2017, conference | 1 | 1 | ||||||
| 62 | ICBE 2019, conference | 1 | 1 | ||||||
| 63 | ICC 2017, conference | 1 | 1 | ||||||
| 64 | ICMI 2017, conference | 1 | 1 | ||||||
| 65 | ICIS 2018, conference | 1 | 1 | ||||||
| 66 | ICSECS 2019, conference | 1 | 1 | ||||||
| 67 | KMO 2019, conference | 1 | 1 | ||||||
| Total | 54 journals and 13 conference papers | 2 | 1 | 8 | 10 | 25 | 25 | 16 | 87 |
A total of 87 articles are distributed in 54 journals and 13 conference papers. As is seen from Table 3, all of the 13 conferences and the majority of the journals only have one paper. Importantly, the top four contributing journals are Telematics and Informatics (5 papers), Technological Forecasting & Social Change (4), Behaviour & Information Technology (4 papers), and Computers & Security (3 papers). In addition, the top 12 journals in this list have provided 32 articles, which are 36.78% of the total papers. Interestingly, no paper in 2020 is contributed yet by the conferences. In addition, we have found several theories and models in those journals and conference papers (see Fig. 5).
Fig. 5
List of theories/models. ISS: information systems success model, IDT: innovation diffusion theory, TRA: theory of reasoned action, TPB: theory of planned behavior, PMT: protection motivation theory, UTAUT: unified theory of acceptance and use of technology, VAM: value-based adoption model, TAM: technology acceptance model, HBM: health belief model, PAM: post-acceptance model, ECT: expected confirmation theory, CPM: communication privacy management, PCT: privacy calculus theory, BRT: behavioral reasoning theory, APCO: antecedents-privacy concerns-outcomes.
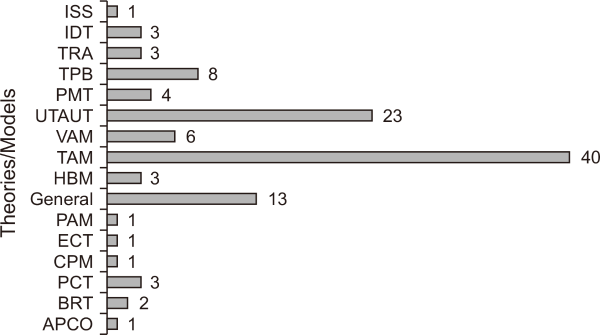
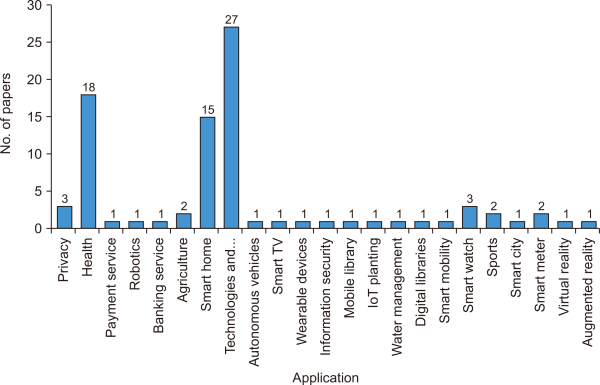
All the articles were categorized according to established theories and models. Notably, the extensions of models like the technology acceptance model 2 (TAM 2), technology acceptance model 3 (TAM 3), unified theory of acceptance, and use of technology 2 (UTAUT 2) were a part of the regular technology acceptance model (TAM) and unified theory of acceptance and use of technology (UTAUT) models. Further, 11.5% of articles were categorized under the ‘general’ category that did not belong to any specific theory or model but rather inherited constructs from different studies. Notably, some of the papers proposed conceptual models by integrating multiple theories. As a result, the number of the following theories exceeds the number of collected papers. TAM (40 papers) is the most widely used model in the checked articles, whereas the UTAUT (23 papers) and theory of planned behavior (TPB) (8 papers) come next. These top three theories have contributed to 62.83% of the total papers. Further, all these articles were categorized into 23 types of different technologies and services of IoT (see Fig. 6).
Most journals (31.03%) follow general technologies and services, where these technologies and services do not specify any specific applications, rather IoT technology and services in general. Smart homes (17.24%) and health (20.68%), on the other hand, are the most popular specific technologies and services, respectively. However, most of the applications (15 out of 23) have been used only once in these papers. According to our findings, the top five contributing countries are South Korea, Malaysia, China, India, and the USA, which have contributed 42.85% of the total amount of papers.
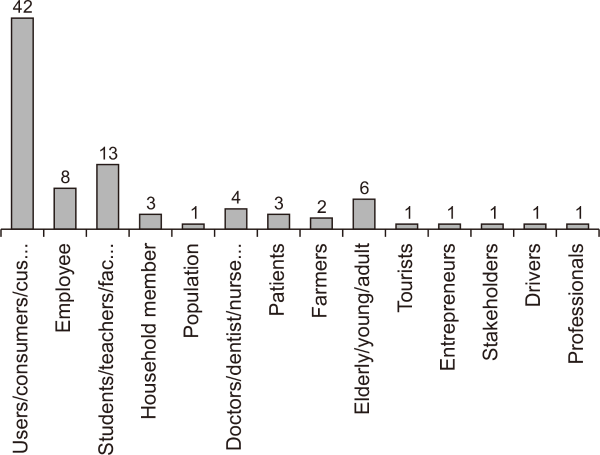
Moreover, a total of 246 authors contributed to developing 87 IoT-related papers with an average of 2.827 or almost three authors per paper. Only 14 authors contributed more than one paper whereas 232 authors contributed only once. Nonetheless, these 246 authors have utilized 14 different types of samples in their studies (see Fig. 7). A maximum of papers (48.27%) have utilized consumers as the sampling type, followed by students (14.94%). Notably, students, teachers, faculty members, and university staff are considered the same sampling type.
We have identified several theories and models utilized in the IoT domain in Fig. 5. In general, these theories and models were developed based on the combination of dependent-independent variables and their relationships. Examples of dependent variables can be Intention, Behavior, and Attitude, which were also the focus variables of this study, and independent variables performed as the influencing factors of these focus variables. As for explanation, the Trust variable acted as a predictor of Intention in 11 papers where the relationship of Trust-Intention was significant nine times. Therefore, Trust gained the weight value of 0.82 and can be categorized both as WUT and BPR (see Appendix). Importantly, in order to perform the weight analysis, we have to count the frequency of these independent variables first.
Therefore, we have counted the frequency of independent variables which were used in different theories and models in these papers (see Table 4). Our analysis has found 165 exogenous variables in different models and theories of IoT papers. Based on the occurrences, the top five variables are Perceived usefulness (48 times), Perceived ease of use (38 times), Attitude (33 times), Social influence (24 times), and Performance expectancy (18 times), which are part of TAM and UTAUT. Apart from the established models, Trust (17 times), Risk (16 times), and Privacy (16 times) are highly used.
Table 4
List of variables with frequency
| No. | Variable | Short form | Count | No. | Variable | Short form | Count |
|---|---|---|---|---|---|---|---|
| 1 | Perceived usefulness | PU | 48 | 84 | Perceived expectancy | PEXP | 1 |
| 2 | Perceived ease of use | PEOU | 38 | 85 | Product-related factors | PRF | 1 |
| 3 | Attitude | ATT | 33 | 86 | Social inf-related factor | SIF | 1 |
| 4 | Social influence | SI | 24 | 87 | Security-related factors | SECF | 1 |
| 5 | Performance expectancy | PE | 18 | 88 | Functionality & reliabil. | FAR | 1 |
| 6 | Trust | TRU | 17 | 89 | Helpfulness | HELP | 1 |
| 7 | Risk | RIS | 16 | 90 | Social network | SOCN | 1 |
| 8 | Privacy | PRI | 16 | 91 | Community interest | CINT | 1 |
| 9 | Facilitating condition | FC | 16 | 92 | Tech. min. ind. | TMI | 1 |
| 10 | Enjoyment | ENJOY | 14 | 93 | Perceived safety | PSAFE | 1 |
| 11 | Effort expectancy | EE | 14 | 94 | Efficiencies | EFFIC | 1 |
| 12 | Subjective norm (social norm) | SN | 13 | 95 | Per. pers and soci. ben. | PASB | 1 |
| 13 | Cost (response) | COST | 12 | 96 | Network quality | NETQ | 1 |
| 14 | Self-efficacy | SE | 10 | 97 | Lack of sub-services | LSS | 1 |
| 15 | Innovativeness | INNOV | 9 | 98 | Alternatives | ALTER | 1 |
| 16 | Perceived behavioral control | PBC | 9 | 99 | Empowerment | EMPOW | 1 |
| 17 | Compatibility | COMP | 8 | 100 | Social support | SSUP | 1 |
| 18 | Perceived value | PVAL | 8 | 101 | Perceived susceptibility | PSUS | 1 |
| 19 | Perceived Security | PSEC | 7 | 102 | Information carrier char | ICC | 1 |
| 20 | Habits | HAB | 7 | 103 | Observability | OBSRV | 1 |
| 21 | Convenience | CONV | 6 | 104 | Reference group infl. | RGI | 1 |
| 22 | Satisfaction | SATF | 6 | 105 | Health belief | HB | 1 |
| 23 | Awareness | AWARE | 6 | 106 | Image | IMG | 1 |
| 24 | Perceived benefits | PBEN | 5 | 107 | Perceived sacrifice | PSAC | 1 |
| 25 | Knowledge | KNO | 5 | 108 | Innovation resistance | INNOVR | 1 |
| 26 | Perceived severity | PS | 5 | 109 | Recommendation | RECOM | 1 |
| 27 | Perceived connectedness | CONTD | 5 | 110 | Socialising | SOC | 1 |
| 28 | Price value | PRVAL | 5 | 111 | Threat appraisal | TA | 1 |
| 29 | Service quality | SERVQ | 4 | 112 | Experience & involve. | EXPNINV | 1 |
| 30 | Perceived vulnerability | PV | 4 | 113 | Organizational policies | ORGP | 1 |
| 31 | Perceived Fee | PFEE | 4 | 114 | Inf. Environ. quality | INFOENQ | 1 |
| 32 | Perceived technicality | PTECH | 4 | 115 | People initiative | PEOI | 1 |
| 33 | Hedonic motivation | HEDM | 4 | 116 | Participation | PARTIC | 1 |
| 34 | Openness | OPEN | 3 | 117 | Training | TRAIN | 1 |
| 35 | Collectivism | COL | 3 | 118 | System quality | SYSQ | 1 |
| 36 | Perceived controllability | PCTRL | 3 | 119 | Affinity | AFFIN | 1 |
| 37 | Information quality | INFOQ | 3 | 120 | Technology readiness | TREADY | 1 |
| 38 | Advantage | ADV | 2 | 121 | Superior functionality | SFUNC | 1 |
| 39 | Availability | AVAIL | 2 | 122 | Perceived adaptiveness | PADAPT | 1 |
| 40 | Power distance | PD | 2 | 123 | Store reputation | SREPUT | 1 |
| 41 | Masculinity | MASC | 2 | 124 | IoT skills | ISKILL | 1 |
| 42 | Uncertainty Avoidance | UA | 2 | 125 | Mobile skill | MSKILL | 1 |
| 43 | Agreeableness | AGREE | 2 | 126 | Social skill | SSKILL | 1 |
| 44 | Extraversion | EXTRA | 2 | 127 | Creative skill | CSKILL | 1 |
| 45 | Conscientiousness | CONS | 2 | 128 | Inf. navigation skill | NSKILL | 1 |
| 46 | Neuroticism | NEURO | 2 | 129 | Health concerns | HC | 1 |
| 47 | Improper access | IACC | 2 | 130 | Perceived confidence | CONFID | 1 |
| 48 | Perceived Utility | PUTI | 2 | 131 | Perceived intelligence | INTLG | 1 |
| 49 | Perceived Usability | PUSE | 2 | 132 | Cognitive experience | CEXP | 1 |
| 50 | Perceived barriers | PBAR | 2 | 133 | Affect experience | AEXP | 1 |
| 51 | Trialability | TRIAL | 2 | 134 | Ext organization var. | EOV | 1 |
| 52 | Information Accuracy | IACC | 2 | 135 | Int. organization var. | IOV | 1 |
| 53 | Response efficacy | RE | 2 | 136 | Digital dexterity | DDEX | 1 |
| 54 | Privacy and security | PRINSEC | 2 | 137 | National cultures | NCUL | 1 |
| 55 | Word of Mouth | WOM | 2 | 138 | Per. self-expressiveness | EXPR | 1 |
| 56 | Intrusiveness | INTRUS | 2 | 139 | Vanity | VAN | 1 |
| 57 | Mobility | MOB | 2 | 140 | Uniqueness | UNIQ | 1 |
| 58 | Credibility | CREDI | 2 | 141 | Affective quality | AFFEQ | 1 |
| 59 | Automation | AUTOM | 2 | 142 | Autonomy | AUTO | 1 |
| 60 | Scope of sharing | SOS | 1 | 143 | Affordability | AFFORD | 1 |
| 61 | Visualization | VIS | 1 | 144 | Self-capability | SCAP | 1 |
| 62 | Reason for | RSNF | 1 | 145 | Experience | EXP | 1 |
| 63 | Reason against | RSNA | 1 | 146 | Past behavior | PBV | 1 |
| 64 | Ubiquitous | UBIQ | 1 | 147 | Interoperability | IOPR | 1 |
| 65 | Usage barrier | UBAR | 1 | 148 | Hedonic innovativeness | HINNOV | 1 |
| 66 | Traditional barrier | TBAR | 1 | 149 | Cognitive innovative | CINNOV | 1 |
| 67 | Tracking | TRAC | 1 | 150 | Functional innovative | FINNOV | 1 |
| 68 | Rescue value | RVAL | 1 | 151 | Social innovativeness | SINNOV | 1 |
| 69 | Service Security | SSEC | 1 | 152 | Perceived gamification | PGAM | 1 |
| 70 | Platform Security | PLSEC | 1 | 153 | Hindering condition | HINDC | 1 |
| 71 | Network Security | NSEC | 1 | 154 | Individual factors | INDF | 1 |
| 72 | Device Security | DSEC | 1 | 155 | Health | HLTH | 1 |
| 73 | Confirmation | CONFM | 1 | 156 | Sustainability | SUST | 1 |
| 74 | Anthropomorphism | ANTHRO | 1 | 157 | Trust in technology | TRUT | 1 |
| 75 | Technophobia | TECHB | 1 | 158 | Trust in Government | TRUG | 1 |
| 76 | Personalization | PERSON | 1 | 159 | Eco-Effective Feedback | EEF | 1 |
| 77 | Long-term orientation | LTO | 1 | 160 | Perceived immersion | PIMM | 1 |
| 78 | Facilitated appropriation | FACA | 1 | 161 | Perceived complexity | PCOMX | 1 |
| 79 | Perceived reliability | PREL | 1 | 162 | Sensation-seeking | SSEEK | 1 |
| 80 | Errors | ERRR | 1 | 163 | Per. captivating inputs | PCAPI | 1 |
| 81 | Secondary Use | SUSE | 1 | 164 | Tech and legal concern | TLC | 1 |
| 82 | Ethics | ETHIC | 1 | 165 | Consistency | CONSS | 1 |
| 83 | Network Externality | PEXT | 1 |
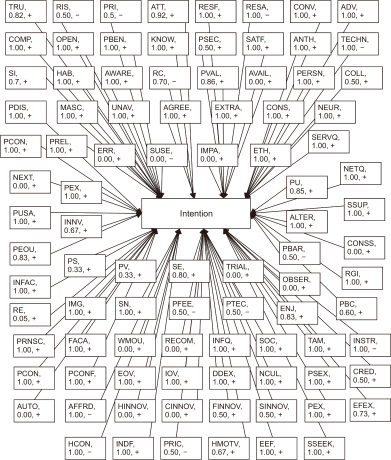
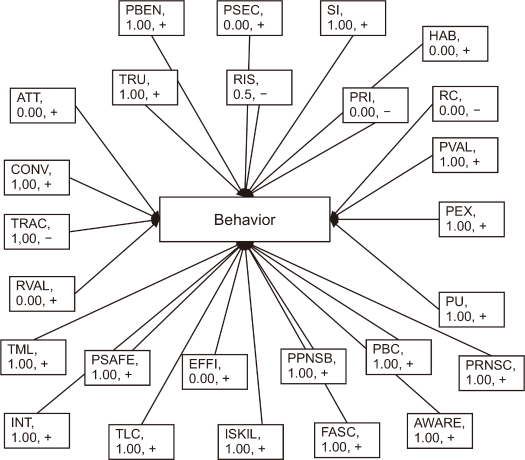
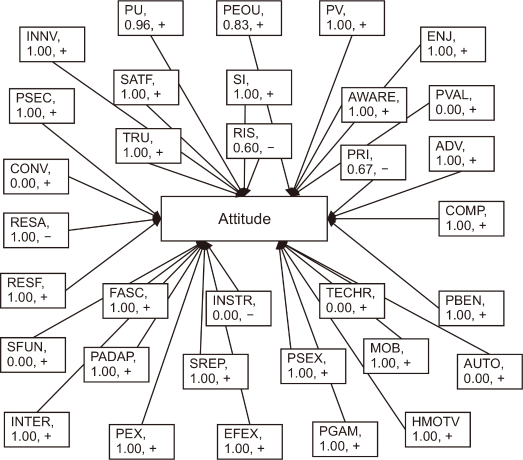
Further, we have evaluated the weight of each predictor variable. We have three dependent variables: Attitude, Intention, and Behavior. The anticipation or present observations of behavioral advantages and negatives are referred to as Attitudes (Rodríguez-Calvillo et al., 2011). In contrast, the degree to which an individual has formed a conscious strategy to undertake or not perform certain prospective actions is defined as Intention. Finally, the user’s self-reported frequency and amount of technology use are characterized as Behavior (Amelia & Ronald, 2017). Notably, Attitude determines Intention, and Intention predicts Actual usage or Behavior, according to the TRA, TAM, and TPB models (Olushola & Abiola, 2017). Furthermore, according to Rayat (2018), a diagrammatically represented figure is meant to provide a graphical demonstration of quantitative facts to develop the concept more comprehensively. In addition, this diagram can also be utilized to evaluate the weight of variables to finalize their overall outcome (Rana et al., 2015). As a result, following Rana et al. (2015), all the significant and non-significant associations are diagrammatically displayed in Figs. 8, 9, and 10, along with their weight values and type of relations (either negative or positive). It is worth mentioning that the weight values of each variable directed towards Intention, Behavior, and Attitude are included in the Appendix in the form of tables, where the calculation procedure has been previously described in Section 2.3. In addition, the above-mentioned figures (Figs. 8Fig. 9-10) have extracted the outcomes of these tables accordingly.
A total of 94 variables are observed to have direct relationships with Intention where 12, 18, 49, and 76 of them are BPR, WUT, PROM, and EXPR, respectively (see Fig. 8). The top seven occurred variables are Attitude (37 times), Perceived usefulness (34 times), Social influence (20 times), Perceived ease of use (18 times), Performance expectancy (15 times), Effort expectancy (15 times), and Subjective norm (14 times). On the other hand, a total of 26 variables have direct relationships with Behavior where 1, 1, 17, and 25 of them are BPR, WUT, PROM, and EXPR, respectively (see Fig. 9). The maximum occurred variable is Intention (13 times), followed by Trust (2 times) and Risk (2 times), and the remaining variables exist only once.
At last, a total of 33 variables are observed to have direct relationships with an Attitude where 2, 3, 23, and 30 of them are BPR, WUT, PROM, and EXPR, respectively (see Fig. 10). The maximum occurred variables are Perceived ease of use (23 times), Perceived usefulness (23 times) which followed Risk (5 times), Trust (3 times), Privacy (3 times), Performance expectancy (3 times), and Effort expectancy (3 times). Moreover, 22 out of 33 variables occur only once.
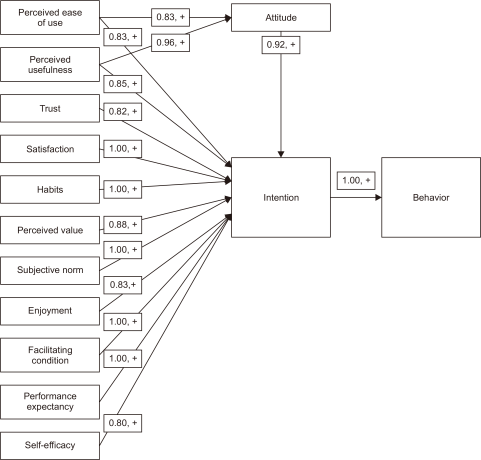
Jeyaraj et al. (2006) advised researchers to continue employing the best predictors within their conceptual models for consumer adoption-related studies. Following the recommendations of Jeyaraj et al. (2006), a conceptual consumer adoption model has been proposed supported by the outcomes of the above three figures. According to our findings, the 12 best predictors of Intention are Perceived ease of use (0.83), Perceived usefulness (0.85), Trust (0.82), Satisfaction (1.00), Habits (1.00), Perceived value (0.88), Subjective norm (1.00), Enjoyment (0.83), Facilitating condition (1.00), Performance expectancy (1.00), Self-efficacy (0.8), and Attitude (0.92). On the other hand, Attitude has the two best predictors—Perceived ease of use (0.83) and Perceived usefulness (0.96); and Behavior has only Intention (1.00) as the best predictor. Interestingly, all of these best predictors are positively associated with the respective focus variables. To measure IoT adoption, we focused primarily on Intention and Behavior, with Attitude acting as a mediator between Perceived ease of use (0.83), Perceived usefulness (0.96), and Intention. More simply, we can say that these 12 best predictors have achieved the top weighting values, and these are the most influential factors that determine the adoption of IoT among the consumer at the individual level. Thus, the following consumer adoption model can be developed (see Fig. 11).
As we discovered in our study, the correlations between independent and dependent factors are not always significant, and independent variables have sometimes failed to become an efficient predictor of dependent variables. The developed model, on the other hand, is made up of the 12 best predictors that have attained the highest weighting values. As a result, in terms of predictive or explanatory capacity, the suggested conceptual model outperforms any other evaluated theories and models in this literature study. On the flip side, since the model is generic, it may be used in a wide range of IoT areas and can aid in the development of novel and successful social applications. Furthermore, the suggested model is anticipated to serve as guidance for future studies into the aspects that drive individual IoT adoption. Importantly, factor weight patterns may be used as a guide for the subsequent variables and can be further studied to demonstrate their efficacy.
5. DISCUSSION
To comprehend the recent progression of individual consumers’ IoT adoption and the overall efficiency of the constructs, this review study performed a weight analysis of the variables from 87 articles in academic journals and conference proceedings published during the period 2014-2020. This research was carried out with three goals in mind. To be specific, the first goal of this paper was to investigate the growth of individual IoT acceptance in recent years. Therefore, the following significant points emerged from the findings:
-
In light of the current hype around IoT, it can be predicted that the number of articles in future years will have an upward trend even with a higher rate.
-
74 journals are distributed in 54 journals with an average rate of 1.37 and each conference has one paper. However, the average rate is not convincing.
-
15 different established theories and models were attempted where priority was given to TAM, UTAUT, and TPB. However, there is still room for some more consumer adoption models and more contribution is expected from the remaining 12 models.
-
A study on 23 different areas has been attempted, which is satisfying. However, if we ignore the three areas, i.e., health, smart home, and overall technologies & services, many more contributions are expected from the remaining 20 technologies and services.
-
Only 14 different types of samples were attempted, in which the authors mostly targeted consumers and students.
The second objective of this study was to find the most influencing factors of the Intention and Actual usage of IoT applications using weight analysis. This objective was fulfilled through the following steps. The first step was to find the frequency of all variables used in the theories and models to determine Adoption Intention and Actual usage. The second step was to conduct a weight analysis of the variables associated with Attitude, Intention, and Behavior. Notably, we have included Attitude for weight analysis since this variable has been used as a mediator of Intention and Behavior in many papers. According to the findings, among the 165 variables from 87 articles, only 28 variables occurred more than five times, 59 variables occurred more than once, and the remaining 106 variables were attempted only once. Thus, it can be understood that most of the variables were not attempted sufficient times. Afterward, we analyzed 94 direct relationships with Intention, 26 with Behavior, and 33 with Attitude. Following that, 2, 12, and 1 best predictors were found for Attitude, Intention, and Behavior, respectively from our weight analysis. On the other hand, the numbers of promising predictors were 23, 49, and 17 for Attitude, Intention, and Behavior, respectively.
The third objective was to develop an IoT adoption model using the best predictors achieved from weight analysis. We counted the frequency and weight in all research papers on the associations between exogenous and endogenous variables. Afterward, we have found the 12 best predictors from the weight analysis and a model is developed accordingly. These best predictors are Perceived ease of use (0.83), Perceived usefulness (0.85), Trust (0.82), Satisfaction (1.00), Habits (1.00), Perceived value (0.88), Subjective norm (1.00), Enjoyment (0.83), Facilitating condition (1.00), Performance expectancy (1.00), Self-efficacy (0.8), and Attitude (0.92), which is found to be significant sufficient times in the literature. Besides this, Attitude performs as a mediator between Perceived ease of use (0.83), Perceived usefulness (0.96), and Intention. Further, we have found several promising predictors that can affect Attitude (30 promising predictors), Adoption intention (49 promising predictors), and Behavior (17 promising predictors) of IoT applications. These promising variables have the potential to become the best predictors. However, these variables have not yet been sufficiently attempted. Indeed, Jeyaraj et al. (2006) recommended studying promising predictors inside the conceptual models for individual consumer adoption-related studies.
6. CONCLUSION
This study shows the exponential rise in the number of papers published in the last seven years, which demonstrates IoT as an emerging field with tremendous potential for future years’ publications. Though consumer IoT adoption is emerging day by day, it is still in its infant stage because several issues in 20 different technologies and services are still unaddressed and people from different sectors and professionals are not equally involved. Most importantly, if the current growth rate continues, much more progress is expected in the near future. On the other hand, the developed generic IoT model can most effectively predict user IoT adoption. Furthermore, this model can be applicable to a wide range of domains and can help us develop innovative, effective social applications.
Significantly, this is one of the first SLR studies that utilize weight analysis to determine influencing factors for IoT-enabled applications. Moreover, this study’s theoretical success is also based on portraying the combined diagrammatic representation for individual IoT adoption and calculating the number of significant and non-significant correlations between the leading constructs, which are then used to assess the weight analysis. Afterward, a new IoT adoption model has been developed in our study which is generic and capable of addressing all the analyzed IoT technologies and services. In addition, this developed model is capable of enhancing theoretical knowledge of individual IoT adoption and is able to develop a solid foundation for information management literature. From a practical standpoint, consumers, communities, and businesses might all profit from this developed IoT paradigm. Additionally, similar to our findings, Lee and Lee (2015) confirm that the potential of IoT devices is enormous; however, the future uncertainty of investment remains a concern for decision-makers. Therefore, the current growth of IoT among individuals in recent years and derived influencing factors (best predictors and promising predictors) are expected to influence and assist organizations, policymakers, and entrepreneurs in the further development of their business plans. Further, the results of this study have meaningful implications for companies that provide IoT-based services and/or decide to launch new services.
This study has a few drawbacks which can be addressed in future studies. To begin, papers were collected only from five databases, as stated earlier. Hence, some other databases such as EBSCO, ProQuest, PubMed, ACM, JSTOR, Wiley, or Hindawi were overlooked. Afterward, the searching keyword used for this weight analysis might be inadequate. We could have used more keywords related to specific IoT applications such as “smart home adoption/acceptance,” health service adoption/acceptance,” etc. As a result, we may have overlooked some articles and facts. Moreover, we performed a weight analysis on the generic issues of IoT adoption, whereas specific issues might lead to some other interesting results. On the other hand, some more statistical procedures can be followed to measure the relationships between the variables, for example, standard normal deviation, average β values, and lower & upper 95% confidence intervals (Baptista & Oliveira, 2016). Last, we have addressed individual consumer IoT adoption in this paper, and organizational IoT adoption might also be an interesting topic. Afterward, it would also be possible to make a comparison between these two types of IoT adoptions which will lead to some remarkable results.
REFERENCES
(*) sign includes sources used in the weight-analysis.
, (2022) A literature review of the adoption of Internet of Things: Directions for future work International Journal of Contemporary Management and Information Technology, 2(2), 15-23 https://ijcmit.com/wp-content/uploads/2022/02/Al-momani-Rahman-.pdf.
, , (2010) Performance of a generic approach in automated essay scoring Journal of Technology, Learning, and Assessment, 10(3), 1-16 https://ejournals.bc.edu/index.php/jtla/article/view/1603/1455.
Harnessing the Internet of Things for Global Development (2016) Harnessing the Internet of Things for global development https://www.itu.int/en/action/broadband/Documents/Harnessing-IoT-Global-Development.pdf
, (2019) * An empirical study of consumer adoption of Internet of Things services International Journal of Engineering and Technology Innovation, 9(1), 1-11 https://ojs.imeti.org/index.php/IJETI/article/view/801.
, (2018) IoT and ai in healthcare: A systematic literature review Issues in Information Systems, 19(3), 33-41 https://pdfs.semanticscholar.org/45f1/aa37b38efca0cc36b6d7b58d56bc1b5c7951.pdf?_ga=2.134121742.1240012556.1655962684-1742901.1655197744.
, (2019) Internet of Things-based services implementation and challenges in Malaysia: An inquiry Test Engineering and Management, 81, 3219-3231 http://www.testmagzine.biz/index.php/testmagzine/article/view/431.
World Bank (n.d.) World Bank country and lending groups https://datahelpdesk.worldbank.org/knowledgebase/articles/906519-world-bank-country-and-lending-groups
- Submission Date
- 2022-01-10
- Revised Date
- 2022-05-01
- Accepted Date
- 2022-05-15
- 350Downloaded
- 1,225Viewed
- 0KCI Citations
- 0WOS Citations


