- P-ISSN2287-9099
- E-ISSN2287-4577
- SCOPUS, KCI
Assessing Publication Productivity of the Top 10 Countries Across Medical Specialties: Prolific Versus Prestigious Journals

Yong-Gu Lee (Department of Library and Information Science, Kyungpook National University, Daegu, Korea)

Abstract
This study aimed to investigate publication productivity in various medical specialties in the top 10 countries with the highest number of published journal articles, considering the distinction between prolific and prestigious journals. For this study, we selected 10 specialties from the Scientific Journal Rankings (SJR) and used journals listed in both SJR and PubMed. Bibliographic details of these journals’ articles published from 2017 to 2019 were downloaded from PubMed. The results showed that various aspects of medical publication output were influenced by country characteristics such as specialty, journal type, population size, wealth, and healthcare expenditure. China showed the greatest variability in terms of specialty, as its publications in Oncology (ONCGY) were exceptionally high compared with the specialties of other countries. China’s publications in ONCGY exceeded even those of the United States in ONCGY. Furthermore, the western countries, the United Kingdom, Canada, and the United States in particular published more articles in prestigious journals than the other top 10 countries, where the East Asian countries published more articles in prolific journals than in prestigious journals.
- keywords
- prolific journals, prestigious journals, h-index, medical specialties, journal types, PubMed
1. INTRODUCTION
In the past two decades, there has been an enormous growth of research publications in large bibliographic databases such as PubMed ( https://pubmed.ncbi.nlm.nih.gov). PubMed, provided by the National Institutes of Health (NIH), is considered a leading source of medical research publications (Williamson & Minter, 2019). In the past, numerous bibliometric studies have been conducted based on PubMed to assess the medical research outputs of certain countries and regions (Albarqouni et al., 2018; Song et al., 2014; Tadmouri et al., 2019; Tan & Sijbrands, 2020). The quantitative results of such studies may vary among medical specialties, as these are important divisions of medical research. Medical specialties will be referred to simply as “specialties” hereinafter.
Modern specialties emerged in the early nineteenth century as a form of knowledge production closely related to clinical practice (Weisz, 2003). Today, the number of specialties has increased as medical practices have become more complex (Dolan, 2021). The American Board of Medical Specialties ( https://www.abms.org), a professional organization that certifies specialties in the United States, has certified more than 150 specialties to date. Many previous studies have focused on identifying characteristics of each specialty (Jamjoom & Jamjoom, 2016; Özen Çınar, 2020; Shamseddine et al., 2014).
Consequently, publication patterns within the specialties of particular countries need to be assessed more comprehensively, as superficial analyses can mislead researchers. Various factors, such as population size, wealth, and health care expenditure, must be taken into consideration when assessing countries’ publication outputs. It is also useful to consider different types of journals because scientific journals are often considered as the basic unit for evaluating publication output (Schubert & Braun, 1986). First, we considered prolific journals, i.e., journals that publish a large number of articles in specific fields. Prolific journals are common in various fields of study (Konur, 2012; Zhao et al., 2018). We also considered prestigious journals, i.e., journals that have relatively high h-indexes in certain fields. A journal’s h-index is considered a reasonable indicator of a journal’s impact and prestige (Bornmann et al., 2009) and is a single numerical indicator that takes into account both the number of citations and the number of published documents (Braun et al., 2006).
In recent years, there has been considerable interest in examining the scientific productivity of leading countries (Elango & Oh, 2022). In light of this, it is possible to compare the research output of leading countries using the bibliographic data of journals with high h-indexes.However, there is a lack of studies that have examined specialties within specific countries using different journal types. Considering the distinction between prolific and prestigious journals, the publication patterns of specialties in the leading countries should be examined in terms of journal types in addition to various country characteristics, such as population size and the country’s wealth and health expenditure.
The 10 countries that published the highest number of articles in medicine were the following: the United States, China, Japan, the United Kingdom, Germany, Italy, Canada, France, Australia, and South Korea. Moreover, the 10 specialties selected for this study were the following: Cardiology and Cardiovascular Medicine (CARGY); Infectious Diseases (INFEC); Neurology (NEURO); Oncology (ONCGY); Orthopedics and Sports Medicine (ORTHO); Pediatrics, Perinatology, and Child Health (PEDIA); Pharmacology (PHARM); Psychiatry and Mental Health (PSYCH); Radiology, Nuclear Medicine, and Imaging (RADGY); and Surgery (SURGY). These specialties had the highest numbers of journals indexed in the Scientific Journal Ranking (SJR).
Hence, the objective of this study was twofold:
2. METHODOLOGY
In this study, we examined the publication productivity of the previously mentioned 10 specialties and 10 countries. Publication productivity is commonly used to measure the performance of researchers, institutions, disciplines, and countries (Aboagye et al., 2021; Koljatic & Silva, 2001; Matthews, 2013). We refer to this term as a measurement of publication output efficiency in this study. To assess the research output of countries across specialties, we first used journals listed in both the 2020 SJR and PubMed. For the 10 medical specialties, the journal category of the 2020 SJR was used, and the bibliographic records of the journal articles of 10 medical specialties published from 2017 to 2019 were downloaded from the NIH website ( http://nlm.nih.gov/databases/download/pubmed_medline.html).
Considering different journal types, three types of datasets were created: a) ALL dataset, b) 30H dataset, and c) 30P dataset. The ALL dataset, which was created without the consideration of journal types, consisted of bibliographic records of articles published in all indexed journals across the 10 specialties. The top 30 journals from the 10 previously mentioned specialties were selected for the prolific and prestigious journal categories. The 30H dataset included bibliographic records of articles published in the 30 journals with the highest h-index scores, whereas the 30P dataset included bibliographic records of articles published in the 30 journals with the highest number of articles published. We defined and distinguished prestigious and prolific journals by creating the 30H dataset for prestigious journals and the 30P dataset for prolific journals.
In creating the datasets, some records were removed from the original downloaded data because the country names were not recognizable. Country codes were first extracted from the PubMed data (or the ALL dataset) based on author affiliation information. Approximately 5% of the records were removed due to missing or unrecognizable author affiliation information. In addition, country names were extracted using libpostal, an NLP tool for extracting international street addresses (Barrentine, 2018). The libpostal tool failed to correctly identify country names for approximately 4% of the datasets. Thus, approximately 9.6% of the total experimental data was excluded from the study. The research data were processed using Python and SQL, and the research results were analyzed using Excel and R.
The total number of journals and articles used in this study varied by specialty. Table 1 shows the descriptive statistics for the 10 selected specialties. On average, the 30P dataset contained approximately one and a half times more journal articles than the 30H dataset. The number of journals, the journal article records, and the average h-index of specialties across the three datasets varied widely. The average h-index of journals ranged from 50.7 (SURGY) to 65.9 (ONCGY) in the ALL dataset, from 130.8 (PEDIA) to 222.5 (ONCGY) in the 30H dataset, and from 105.0 (PEDIA) to 171.5 (CARGY) in the 30P dataset. Although the h-indexes in the 30H dataset are higher than those in the 30P dataset in each specialty, the difference among the specialties varied considerably. The varying h-indexes are indicative of the characteristics of journals in each specialty. The h-index of ONCGY is the highest (222.5) in the 30H dataset, suggesting that there were more prestigious journals published in this specialty than in other specialties. In contrast, the h-index of PEDIA (130.8) is the lowest in the 30H dataset, suggesting that there were fewer prestigious journals published in this specialty than in other specialties. Some journals listed in the 30H dataset are also included in the 30P dataset, indicating that some journals are both prestigious and prolific.
Table 1
Descriptive statistics of three datasets
| Specialties | ALL dataset | 30H dataset | 30P dataset | ||||||||
|---|---|---|---|---|---|---|---|---|---|---|---|
| N Journals |
Avg. h-index |
N Articles |
N Journals |
Avg. h-index |
N Articles |
N Journals |
Avg. h-index |
N Articles |
|||
| CARGY | 278 | 59.0 | 91,745 | 30 | 202.1 | 28,161 | 30 | 171.5 | 34,042 | ||
| INFEC | 227 | 61.9 | 81,953 | 30 | 180.8 | 25,266 | 30 | 135.4 | 39,240 | ||
| NEURO | 299 | 63.5 | 103,421 | 30 | 197.4 | 24,734 | 30 | 148.2 | 39,693 | ||
| ONCGY | 292 | 65.9 | 141,306 | 30 | 222.5 | 26,070 | 30 | 154.0 | 61,836 | ||
| ORTHO | 196 | 51.5 | 59,941 | 30 | 150.2 | 25,848 | 30 | 137.3 | 28,404 | ||
| PEDIA | 210 | 53.9 | 63,649 | 30 | 130.8 | 19,960 | 30 | 105.0 | 27,244 | ||
| PHARM | 179 | 59.5 | 55,759 | 30 | 143.5 | 18,345 | 30 | 114.5 | 28,930 | ||
| PSYCH | 366 | 61.7 | 78,845 | 30 | 189.7 | 18,161 | 30 | 144.6 | 30,460 | ||
| RADGY | 248 | 51.3 | 78,173 | 30 | 152.4 | 25,384 | 30 | 126.5 | 29,721 | ||
| SURGY | 340 | 50.7 | 134,000 | 30 | 169.9 | 30,278 | 30 | 127.3 | 45,449 | ||
| Average | 263.5 | 57.9 | 88,879 | 30 | 173.9 | 24,121 | 30 | 136.4 | 36,502 | ||
CARGY, Cardiology and Cardiovascular Medicine; INFEC, Infectious Diseases; NEURO, Neurology; ONCGY, Oncology; ORTHO, Orthopedics and Sports Medicine; PEDIA, Pediatrics, Perinatology, and Child Health; PHARM, Pharmacology; PSYCH, Psychiatry and Mental Health; RADGY, Radiology, Nuclear Medicine, and Imaging; SURGY, Surgery.
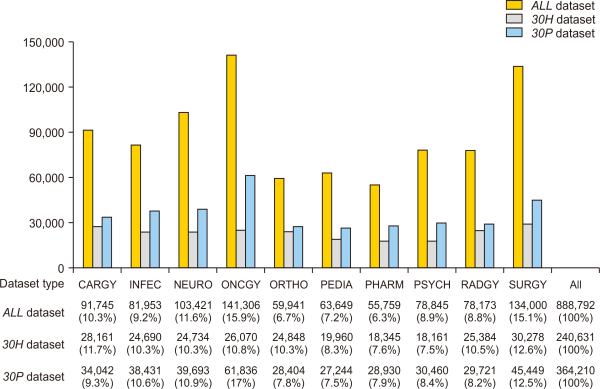
The total number of journal articles used in this study is shown in Fig. 1. In addition, we used a fractional counting method in which co-authors are counted equally regardless of the author sequence (e.g., first author, second author, etc.). Fractional counting is usually preferred over whole counting in processing bibliometric data (Gauffriau, et al., 2008; Perianes-Rodriguez et al., 2016; Pritychenko, 2016). The author’s country was counted proportionally to the number of co-authors, and only a fraction of the country was credited to the authors of the article.
Fig. 1
Total publications by specialty. CARGY, Cardiology and Cardiovascular Medicine; INFEC, Infectious Diseases; NEURO, Neurology; ONCGY, Oncology; ORTHO, Orthopedics and Sports Medicine; PEDIA, Pediatrics, Perinatology, and Child Health; PHARM, Pharmacology; PSYCH, Psychiatry and Mental Health; RADGY, Radiology, Nuclear Medicine, and Imaging; SURGY, Surgery.
3. RESULTS
3.1. Total Publication Outputs of 10 Specialties
Fig. 1 illustrates differences in the total publication outputs of 10 specialties across the three datasets. The number of articles published in the 30H dataset was considerably lower than in the other datasets across the specialties. The higher number in 30P was not surprising, as 30P represents prolific journals. As shown, the number of publications varied across specialties and datasets. In both the ALL dataset and the 30P dataset, the number of published articles was highest in ONCGY. In contrast, the number of articles published in the 30H dataset was highest in SURGY (30,278 articles, 12.6%). In the ALL dataset, the lowest number of articles was published in PHARM (55,759 articles, 6.3%), whereas the lowest number of articles in the 30H dataset was published in PSYCH (18,161 articles, 7.5%).
3.2. Total Publication Output of the Top 10 Countries
Table 2 shows the publication output of the top 10 countries across the datasets. Except for China, the result shows that global medical research is mostly led by only a handful of developed countries, while many developing countries strive to build their medical research capacity (Rahman et al., 2020). The research output of the corresponding countries is also presented in the 30H and 30P datasets. As expected, the United States is the largest producer of medical research publications in all three datasets. There is a considerable gap between the total production of journal articles in the United States and other countries in the ALL dataset. Compared to China, the United States published approximately two and a half times more articles, six times more in the 30H dataset, and two times more in the 30P dataset. Compared to South Korea (ranked 10th), the United States published approximately nine times more articles in the ALL dataset, 15 times more in the 30H dataset, and 10 times more in the 30P dataset.
Table 2
Total publications of top 10 countries
| Rank (ALL dataset) |
Country | Type of datasets | ||
|---|---|---|---|---|
| ALL (%) | 30H (%) | 30P (%) | ||
| 1 | United States | 230,160 (38.7) | 81,547 (48.4) | 97,461 (38.0) |
| 2 | China | 97,189 (16.3) | 14,355 (8.5) | 54,602 (21.3) |
| 3 | Japan | 46,968 (7.9) | 9,669 (5.7) | 18,467 (7.2) |
| 4 | United Kingdom | 41,673 (7.0) | 14,755 (8.8) | 16,409 (6.4) |
| 5 | Germany | 40,266 (6.8) | 10,531 (6.2) | 14,708 (5.7) |
| 6 | Italy | 35,203 (5.9) | 7,478 (4.4) | 13,075 (5.1) |
| 7 | Canada | 28,035 (4.7) | 9,745 (5.8) | 11,281 (4.4) |
| 8 | France | 26,191 (4.4) | 7,546 (4.5) | 9,973 (3.9) |
| 9 | Australia | 24,913 (4.2) | 7,621 (4.5) | 10,574 (4.1) |
| 10 | South Korea | 24,595 (4.1) | 5,305 (3.1) | 9,852 (3.8) |
| 595,193 (100) | 168,551 (100) | 256,402 (100) | ||
3.3. Relationship between the Number of Articles and Country Related Indicators
Using 2018 data from the World Health Organization (WHO), we investigated the relationships between the number of articles published and gross domestic product (GDP) per capita, as well as the number of articles published and total government health expenditure (GGHE-D) per capita. We found that the number of published articles increased with GGHE-D per capita. However, the R-squared values for both graphs shown in Fig. 2 indicate that there is a large variability in the trend line. In terms of number of articles and GDP per capita, the R-squared value shows that only about 5.7% of the variance can be explained by the linear regression model.
Fig. 2
Number of articles published vs. country’s wealth and health expenditure. AU, Australia; CA, Canada; CN, China; DE, Germany; FR, France, IT, Italy; KR, South Korea; UK, United Kingdom; US, United States; GDP, gross domestic product; GGHE-D, total government health expenditure.
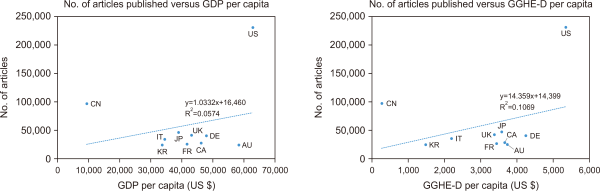
Similarly, in terms of number of articles and GGHE-D per capita, the R-squared value shows that approximately 10.7% of the variance in producing articles can be explained by the linear regression model. The United States has the highest GDP per capita and GGHE-D per capita, and it also has the highest number of articles published in medicine. In contrast, China has published the second-highest number of articles but has the lowest GDP per capita and GGHE-D per capita. As shown, the linear regression line can be used to assess a country’s publication productivity in relation to other countries. When the country’s wealth and health care expenditures are considered, the countries above the regression line are more productive in producing journal articles than the countries below the trend line; thus, the United States and China are more productive than most other countries.
Using the ALL dataset, the publication productivity of the top 10 countries was calculated relative to their population size. Similar to GDP per capita, we defined Articles per T-Capita as the articles produced per thousand populations and calculated the top 10 countries’ Articles per T-Capita using the 2018 population data from the WHO (World Health Organization, 2020). Articles per T-Capita represent a country’s publication productivity regarding medical journal articles. As shown in Table 3, Articles per T-Capita were the highest in Australia (1.00), whereas China published the lowest number of articles (0.07) according to this metric. Thus, when population size was taken into account, Australia was the most productive, and China was the least productive country in producing journal articles.
Table 3
Articles per T-Capita across top 10 countries
| Rank | Country | Articles per T-Capita |
No. of articles (ALL dataset) |
Population (1,000 head) |
|---|---|---|---|---|
| 1 | Australia | 1.00 | 24,913 | 24,898 |
| 2 | Canada | 0.76 | 28,035 | 37,075 |
| 3 | United States | 0.70 | 230,160 | 327,096 |
| 4 | Germany | 0.67 | 40,266 | 60,484 |
| 5 | United Kingdom | 0.63 | 41,673 | 66,274 |
| 6 | Japan | 0.57 | 46,968 | 82,792 |
| 7 | Italy | 0.53 | 35,203 | 66,919 |
| 8 | South Korea | 0.48 | 24,595 | 51,172 |
| 9 | France | 0.21 | 26,191 | 127,202 |
| 10 | China | 0.07 | 97,189 | 1,427,648 |
3.4. Number of Articles in Top Countries’ Specialties
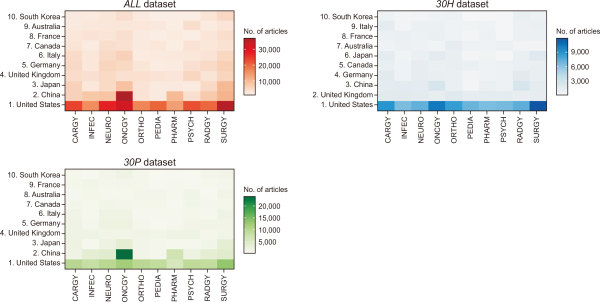
The number of published articles varied considerably across the specialties, countries, and datasets. Fig. 3 represents the raw publication counts of the top 10 countries’ specialties in the ALL, 30H, and 30P datasets. China showed the most distinctive publishing pattern. Compared with other countries, China published the highest number of articles in ONCGY in the ALL dataset. In the 30P dataset, the number of China’s publications in ONCGY is greater than the number of publications produced in any other country’s specialty. The dominance of the United States in medical research can also be noticed in this figure. Except for China in ONCGY, the United States published more articles than any other country in all specialties. The number of articles published by the United States in SURGY in the ALL dataset is the second highest across all specialties. In contrast to the publication patterns in the 30P dataset, the United States consistently published more articles in the 30H dataset than any other country in all specialties.
Fig. 3
Publication counts of top 10 countries’ specialties. The numbers on the left side of each country name indicate the rank in producing journal articles. CARGY, Cardiology and Cardiovascular Medicine; INFEC, Infectious Diseases; NEURO, Neurology; ONCGY, Oncology; ORTHO, Orthopedics and Sports Medicine; PEDIA, Pediatrics, Perinatology, and Child Health; PHARM, Pharmacology; PSYCH, Psychiatry and Mental Health; RADGY, Radiology, Nuclear Medicine, and Imaging; SURGY, Surgery.
3.5. Publication Share of Specialties within Countries
We compared the publication share of the top 10 countries’ specialties across all of these countries and across datasets. As shown in Fig. 4, the sum of all publication shares of the specialties in each country is 100%. China showed the most distinctive pattern of publication in terms of the publication share of individual specialties. In the ALL dataset, the number of articles published by China was the highest in ONCGY (38.1%). In the 30P dataset, China’s publication share in ONCGY (43.9%) was greater than that of any other country across all specialties. Furthermore, China also had the lowest publication share across all three datasets in PEDIA (2.1%) within the ALL dataset.
Fig. 4
Publication share of specialties within countries. CARGY, Cardiology and Cardiovascular Medicine; INFEC, Infectious Diseases; NEURO, Neurology; ONCGY, Oncology; ORTHO, Orthopedics and Sports Medicine; PEDIA, Pediatrics, Perinatology, and Child Health; PHARM, Pharmacology; PSYCH, Psychiatry and Mental Health; RADGY, Radiology, Nuclear Medicine, and Imaging; SURGY, Surgery.
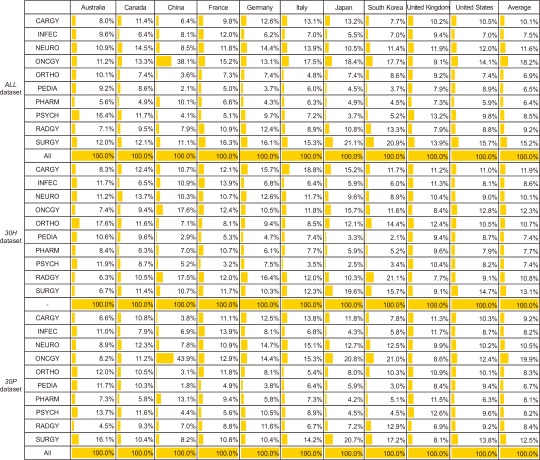
The average publication share of specialties, which is shown on the right side of Fig. 4, was calculated by taking the average share across all countries. An equal average percentage share of publications would be 10% because there are ten specialties. However, the actual average publication share varied widely, and the highest average publication share was found in the 30P dataset in ONCGY. In the ALL dataset, the high average publication share of ONCGY (18.2%) was partly due to China’s exceptionally high number of publications in this specialty. In the same dataset, the lowest publication share was that of PHARM (6.4%).
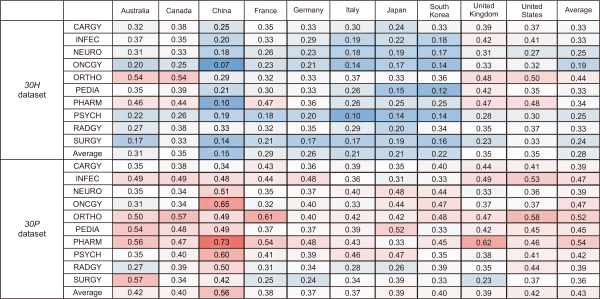
3.6. Comparing Proportions of Publications Using Ratios
Publication output can vary widely between two journal types — prestigious and prolific. Considering this distinction, we developed the 30H-All Ratio and the 30P-All Ratio to compare publication proportions within a dataset and between two datasets. The 30H-All Ratio measures the relative proportion of articles published in prestigious journals within a specialty or country. Because the 30H dataset consists of the top 30 journals by h-index scores, the 30H-All Ratio is defined as follows:
The 30P-All Ratio measures the relative proportion of articles published in prolific journals within a specialty or country. Because the 30P dataset consists of the top 30 journals that published the highest number of articles, it is defined as follows:
Fig. 5 shows the empirical results of applying the 30H-All Ratio and 30P-All Ratio to the top 10 countries’ specialties. The highest 30H-All Ratio is found in ORTHO of Australia (0.54) and ORTHO of Canada (0.54), shown in red. The lowest 30H-All Ratio is found in ONCGY of China (0.07). Looking at the 30H-All Ratio, China is mostly shown in blue, indicating that publication in most specialties was not the result of publishing in prestigious journals. On the other hand, the highest 30P-All Ratio is found in PHARM from China (0.73). The lowest 30P-All Ratio is found in SURGY of the United Kingdom (0.23), which indicates that this specialty within this country had the lowest proportion of publications published in prolific journals. The 30P-All Ratio of the countries’ specialties is mostly shown in red, indicating that considerably more publications were published in prolific journals than in prestigious journals.
Fig. 5
30H-All Ratio and 30P-All Ratio of top 10 countries’ specialties. Blue indicates a low ratio, whereas red indicates a high ratio. The intensity of the color indicates the degree of the ratio. CARGY, Cardiology and Cardiovascular Medicine; INFEC, Infectious Diseases; NEURO, Neurology; ONCGY, Oncology; ORTHO, Orthopedics and Sports Medicine; PEDIA, Pediatrics, Perinatology, and Child Health; PHARM, Pharmacology; PSYCH, Psychiatry and Mental Health; RADGY, Radiology, Nuclear Medicine, and Imaging; SURGY, Surgery.
To further examine the overall publication productivity of countries’ specialties, we obtained the grand average by averaging the 30H-ALL Ratio and 30P-ALL Ratio across all specialties and countries. Then, we counted greater-than-grand average (GTGA) 30H-All Ratios and GTGA 30P-All Ratios. As shown in Table 4, the grand average of the 30P-All Ratio (0.44) is much greater than the grand average of the 30H-All Ratio (0.30), which suggests that greater proportions of articles are published in prolific rather than prestigious journals. In terms of countries, the United States (9), the United Kingdom (9), and Canada (9) show the highest greater-than-average 30H-All Ratios, whereas China (9) shows the highest GTGA 30P-All Ratio. Therefore, in most specialties, authors from the United States, the United Kingdom, and Canada tend to publish more in prestigious journals, whereas authors from China tend to publish in prolific journals.
Table 4
Frequency counts of the greater-than-average 30H Ratios and 30P Ratios
| Ratio type |
Grand average | Frequency count | |||||||||
|---|---|---|---|---|---|---|---|---|---|---|---|
| Australia | Canada | China | France | Germany | Italy | Japan | South Korea | United Kingdom | United States | ||
| 30H-ALL | 0.30 | 7 | 9 | 1 | 6 | 5 | 2 | 1 | 3 | 9 | 9 |
| 30P-ALL | 0.44 | 5 | 4 | 9 | 2 | 2 | 1 | 4 | 4 | 3 | 5 |
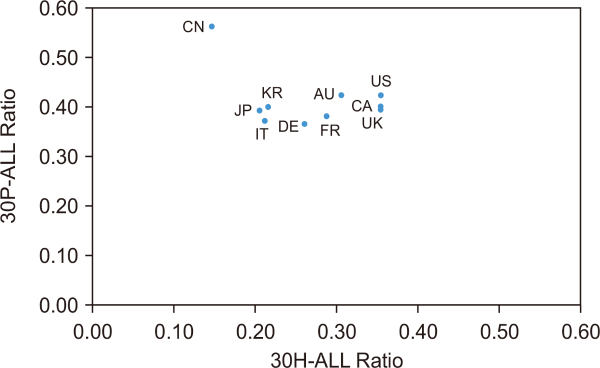
The 30P-All Ratio of countries was obtained by calculating the average 30P-All Ratios of the countries’ specialties. Similarly, the 30H-All Ratio of countries was obtained by calculating the average 30H-All Ratios of the countries’ specialties. Fig. 6 shows a scatterplot of the 30P-All Ratios and 30H-All Ratios of the top 10 countries. China had the lowest 30H-All Ratio (0.15) but the highest 30P-All Ratio (0.56). This suggests that authors from China mainly published articles in prolific journals rather than in prestigious journals. The United Kingdom, Canada, and the United States had the highest 30H-All Ratios (0.35). Authors from these Western countries published a greater proportion of their articles in prestigious journals and a smaller proportion of their articles in prolific journals. Compared with Western countries, East Asian countries, namely China, South Korea, and Japan, had the lowest 30H-All Ratios.
Fig. 6
30P-All Ratios and 30H-All Ratios by country. AU, Australia; CA, Canada; CN, China; DE, Germany; FR, France, IT, Italy; KR, South Korea; UK, United Kingdom; US, United States.
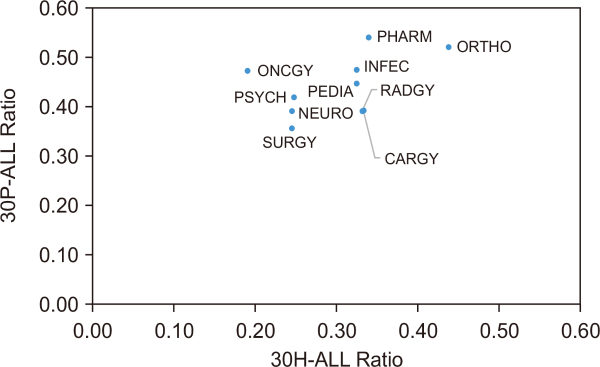
We also calculated the 30H-All Ratios and the 30H-All Ratios of specialties by averaging the 30H-All Ratios andthe 30H-All Ratios of all 10 leading countries. Fig. 7 illustrates a scatterplot of the 30H-All Ratios and 30P-All Ratiosof specialties. ORTHO had the highest 30H-All Ratio (0.44) with a relatively high 30P-All Ratio (0.52). PHARM had the highest 30P-All Ratio (0.54). This indicates that a substantial proportion of the articles in ORTHO and PHARM were published in both prolific and prestigious journals. Compared to other specialties, SURGY had a relatively low number of published articles in prolific or prestigious journals since SURGY had the lowest 30P-All Ratio (0.36) and a relatively low 30H-All Ratio (0.24).
Fig. 7
30P-All Ratios and 30H-All Ratios of specialties. CARGY, Cardiology and Cardiovascular Medicine; INFEC, Infectious Diseases; NEURO, Neurology; ONCGY, Oncology; ORTHO, Orthopedics and Sports Medicine; PEDIA, Pediatrics, Perinatology, and Child Health; PHARM, Pharmacology; PSYCH, Psychiatry and Mental Health; RADGY, Radiology, Nuclear Medicine, and Imaging; SURGY, Surgery.
4. DISCUSSION AND CONCLUSIONS
To our knowledge, this is the first study to examine the publication output of leading countries in regard to specific specialties using the large PubMed dataset. The top 10 countries we identified in terms of medical journal article production are similar to those of previous studies, such as Fontelo and Liu (2018) and Conte et al. (2017). While these studies used PubMed data, they used more specific document types (e.g., clinical studies) and a much smaller number of journals.
The results showed that publication productivity varied widely across countries and specialties and depended on several key factors. These were the country’s population, its wealth and health expenditures, and the types of journals that authors tend to publish in. In terms of population size, Australia was the most productive, whereas China was the least productive. In terms of total publication output, it was not surprising to find that the United States was the most dominant in producing articles, accounting for 39% of all articles published by the top 10 countries in medicine. Compared with other top countries, the United States and China were more productive in producing articles considering their wealth and health expenditures. Both GDP per capita and GGHE-D per capita seem to have a positive correlation with the number of articles published by countries, which is consistent with the findings that GDP affects health care spending (Jakovljevic et al., 2020).The findings of this study support the study of Lin et al. (2018), as the number of articles published increased along with GDP per capita. In addition, the total research output of a country can be calculated by taking into account the wealth and health care expenditure of the country. Compared to most other countries, the United States and China were more productive when their wealth and health spending were considered.
To compare the output of the specialties across the top 10 countries in terms of prestigious and prolific journals, we formulated the 30H-All Ratio and 30P-All Ratio. In terms of specialties, the total research production in oncology was highest in ONCGY, partly due to the large volume of articles published by China. Overall, the highest number of articles were published in ONCGY, whereas the lowest number of articles were published in PHARM. China showed the greatest variability in terms of specialty, as its publications in ONCGY were exceptionally high compared with the specialties of other countries. China’s publications in ONCGY exceeded even those of the United States in ONCGY. We believe 30H-All Ratio and 30P-All Ratio are effective in comparing publication proportions between specialties, a country’s specialty, and the country as a whole.
China’s high publication productivity was mostly due to publications in prolific rather than prestigious journals. Chinese authors in ONCGY also published a relatively low number of journal articles in more reputable journals. In general, authors from China in most specialties tended to publish in prolific journals, whereas authors from the United States, United Kingdom, and Canada in most specialties tended to publish in more prestigious journals. These countries also published a moderate number of journal articles in prolific journals. In contrast, East Asian countries (China, Japan, and South Korea) showed more distinct preferences in terms of journal type. Unlike the Western countries, these countries published more in prolific rather than prestigious journals. The strict editorial standards of journals pose a particular challenge for authors from non-Western countries (Oh et al., 2019). This may be one of the reasons why researchers from East Asian countries lag behind leading Western countries in publishing in more prestigious journals.
REFERENCES
(2018) libpostal: International street address NLP https://github.com/openvenues/libpostal
, , , (2017) Globalization and changing trends of biomedical research output JCI Insight, 2(12), e95206 http://doi.org/10.1172/jci.insight.95206. Article Id (pmcid)
(2021) The medical profession through history Perspectives in Medical Humanities, Supplement 1, 2-56 https://doi.org/10.34947/M7X596.
, (2022) Scientific productivity of leading countries International Journal of Information Science and Management, 20(2), 127-143 https://dorl.net/dor/20.1001.1.20088302.2022.20.2.8.3.
, , , , (2019) A comparative analysis of editorial leaders' profiles of major and non-western library and information science journals Journal of Information Science Theory and Practice, 7(4), 20-32 https://doi.org/10.1633/JISTaP.2019.7.4.2.
World Health Organization (2020) World health statistics, 2018 https://www.who.int/data/gho/data/indicators
- Submission Date
- 2022-04-03
- Revised Date
- 2022-05-12
- Accepted Date
- 2022-05-19
- 258Downloaded
- 894Viewed
- 0KCI Citations
- 0WOS Citations