- Apply for Authority
- P-ISSN2287-9099
- E-ISSN2287-4577
- SCOPUS, KCI

Changes in the Structure of Collaboration Network in Artificial Intelligence by National R&D Stage

Hye Jin Lee (KISTI Digital Curation Center, Daejeon, Korea)
Seok Jong Lim (KISTI Digital Curation Center, Daejeon, Korea)
KangSan DaJeong Lee (KISTI Digital Curation Center, Daejeon, Korea)

Abstract
This study attempted to investigate changes in collaboration structure for each stage of national Research and Development (R&D) in the artificial intelligence (AI) field through analysis of a co-author network for papers written under national R&D projects. For this, author information was extracted from national R&D outcomes in AI from 2014 to 2019. For such R&D outcomes, NTIS (National Science & Technology Information Service) information from the KISTI (Korea Institute of Science and Technology Information) was utilized. In research collaboration in AI, power function structure, in which research efforts are led by some influential researchers, is found. In other words, less than 30 percent is linked to the largest cluster, and a segmented network pattern in which small groups are primarily developed is observed. This means a large research group with high connectivity and a small group are connected with each other, and a sporadic link is found. However, the largest cluster grew larger and denser over time, which means that as research became more intensified, new researchers joined a mainstream network, expanding a scope of collaboration. Such research intensification has expanded the scale of a collaborative researcher group and increased the number of large studies. Instead of maintaining conventional collaborative relationships, in addition, the number of new researchers has risen, forming new relationships over time.
- keywords
- co-author network analysis, social network analysis, researcher collaboration, artificial intelligence, national R&D project
1. INTRODUCTION
For scientists, collaboration is a common scientific practice which has long been implemented for academic development. It refers to the implementation of co-research by more than two scientists by sharing intellectual, economic, and physical resources (Bordons & Gomez, 2000). Researchers share their knowledge and get help through collaboration. Their performances can be recognized by colleagues, since the results are being shared rapidly. On the other hand, when a researcher executes a segmented and specialized project alone, he/she could actually get to a limit in diverse aspects.
The most common form of research collaboration is coauthoring by more than two (2) researchers. Such coauthoring by at least two researchers is a collaborative activity which often brings interactions during co-research or authoring. A collaborative relationship between co-researchers can be the start of continuous research networking and new research collaboration, as well as a prerequisite for successful coauthoring (Choi & Lee, 2009; Park et al., 2014).
Recently, science technology research effort has become greater in scale and converged, and topics have been more complicated and diverse. As research costs increase, there has been an emphasis on national Research and Developments (R&D) and research collaboration. Since the Google DeepMind Challenge Match between Lee Se-dol and AlphaGo in March 2016, in particular, countries around the globe have promoted national R&D policies in artificial intelligence (AI) with a strong belief that innovative AI technology could be essential for global economic growth and solving significant social problems.
The South Korean government has also announced that data economy and AI development could be key to innovative growth in the Fourth Industrial Revolution era in 2019 and set a direction for R&D policy promotion to data-based R&Ds, which are known as ‘Data, Network and AI (DNA)’ (Ministry of Science and ICT, 2019).
Ever since the Google DeepMind Challenge Match, an era of new technology leap, the so-called ‘AI 2.0’ (Pan, 2016) has emerged in AI-related research fields. Particularly, it has rapidly grown in China, the USA, and India. As of 2018, the amount of AI-related research projects across 20 major countries has grown by 9.16% annually (Chung et al., 2017). Top research countries around the globe have led a world-level research collaboration network in AI and formed a solid collaborative relationship among countries with high research competence (Yang et al., 2018). As of 2017, the Republic of Korea is even behind rising China as well as global AI leaders (e.g., USA, Europe, etc.) in terms of the number of researchers in AI. In terms of number citations, which represents the competitiveness of academic papers, furthermore, South Korea ranked eleventh, confirming its weakness in AI-related research. The country is also low in the number of leading researchers (Kang, 2017).
Government-led AI incubation policies have been continuously released around the world. In such circumstances, it is anticipated that competition to secure technology leadership will be further fiercer. Since a research collaboration network allying AI leaders is already formed, there is a concern that a technology gap in AI will further grow. Hence, it is important to analyze AI-related collaboration networks and precisely diagnose research competence for the purposes of deriving collaboration strategies and enhancing collaboration performances. These days, the AI sector has rapidly emerged. From a policy perspective, this sector reveals clear research environment changes over time such as increases in R&D policy and resource inputs. To verify the effects of R&D policies and reflect the results on future policy making, therefore, it is necessary to observe changes in collaboration by stage. In this sense, this study analyzed coauthor networks in order to examine how a coauthor network has changed with the papers written by those who participated in R&D projects which have not been dealt with in previous research.
2. LITERATURE REVIEW
Research on researcher collaboration was conducted in three main streams. The first is a study that pays attention to the pattern of collaboration according to the characteristics of R&D tasks or researchers. These studies used the network analysis methodology to explain the structural characteristics of the research collaboration network and the process of forming the research collaboration network (Cloodt et al., 2006; Melin, 2000; Newman, 2001a).
The second is a study that analyzes factors that influence research collaboration. These studies tried to understand the factors affecting research collaboration by focusing on the researcher’s individual characteristics, international joint research, and collaboration methods such as convergence research (Lee & Lee, 2018; Mohr & Spekman, 1994).
The third is a study that pays attention to the effect of research collaboration on research performance or research productivity. These studies compared the papers of sole authors with the papers of co-authors, and proved that the results produced through research collaboration have high academic value (Abbasi et al., 2011). In addition, a study was conducted to analyze the relationship between the characteristics of the study and the performance by using co-author network analysis (Kuzhabekova, 2011).
If we look at the previous studies, most of the studies that focus on national R&D collaboration are those that analyze R&D projects, and it is difficult to find studies that focus on national R&D papers. Starting with the curiosity of “Can Machines Think?” by Turing (1950), interest and R&D investments in AI technology have dramatically increased since 2016. The beginning of the common use of the term ‘AI’ in various fields was named ‘AI 2.0’ by Pan (2016), as distinguished from ‘before such changes.’
The term ‘artificial intelligence’ (AI) was coined in 1956 when the first academic conference on the subject was held at Dartmouth College (McCarthy et al., 2006). AI refers to the simulation of human intelligence in machine or software, which is programmed to think, recognize, predict, learn, and understand using computers. It includes a science sector in which the methods to develop intelligent computers or computer software are studied (McCarthy et al., 2006).
Recently, AI has drawn a great of attention globally, and the scope of collaboration among organizations/countries has widened, making it possible to observe diverse collaboration patterns. A study by Eun (2020) confirmed that for the past decade, cross-border collaboration in AI is growing up and multiple mid-sized research institutes have emerged over time. A study by Lee (2018) finds that a solid research collaboration system is already established among countries with high research competence, including the USA and UK. For the Republic of Korea, it is time to take a new step forward for forming a close collaboration network with such countries with high research competence. Under current circumstances, it is possible to predict the flow of knowledge in a domestic AI sector by investigating the structure of the research collaboration network and examining core researchers, which can be a critical implication in finding factors that can promote such research collaboration with major countries.
According to a study by Shin and Park (2010), in the rising research sector, international collaboration is influenced by the research life cycle. In countries with low research capability, the percentage of international collaboration is high in the early stage. After the accumulation of research knowhow and establishment of the grounds for growth, however, such percentage is kept constant. AI is a rising research sector with fierce competition among countries. Recently, the technology gap between the countries with core technology and those with poor technology has further widened (Hager et al., 2019). Pravdić and Oluić-Vuković (1986) also said that collaboration with researchers with high research productivity enhances productivity, and that as the number of authors increases, the quality of papers would improve accordingly (Gordon, 1980). In particular, in their study (1972), Nudelman and Landers insisted that papers co-authored by diverse agencies or countries have a considerable influence on a research sector.
3. MATERIALS AND METHODS
In the study by Pan (2016), the 2016 Google DeepMind Challenge Match, which drew a dramatic interest in AI from the world, was named ‘AI 2.0.’ In this study, the AI 2.0 period was divided into three stages to analyze the structure of a coauthor network in AI by stage: Before AI 2.0 (2014-2015), During AI 2.0 (2016-2017), and After AI 2.0 (2018-2019).
3.1. Methods
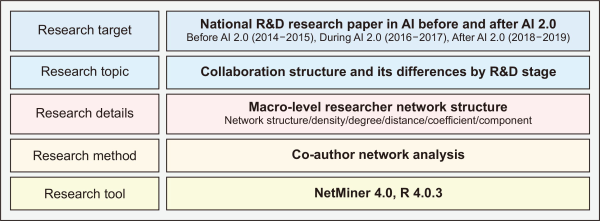
The concept mapping is shown in Fig. 1. After dividing the research period into three stages (Before AI 2.0, 2014-2015, During AI 2.0, 2016-2017, and After AI 2.0, 2018-2019), the collaboration structure and its differences by stage were analyzed through coauthor network analysis. For statistics processing and network analysis, R 4.0.3 was used. For network visualization, NetMinder 4.0 was adopted.
As stated in Table 1, this study was performed in five steps.
Table 1
Research details and procedures
| Stage | Procedure | Details |
|---|---|---|
| 1 | Data Collection | |
| 2 | Data Preprocessing | |
| 3 | Coauthor Network Formation | |
| 4 | Analysis of Collaboration | |
| 5 | Result Analysis |
‘Data Collection and Preprocessing’ is a process to collect target researchers and filter author information. After collecting national R&D research papers in AI, author information was extracted. Then, an author identification information database (e.g., department, English name, etc.) was developed based on the researcher information of the National Science & Technology Information Service (NTIS).
In the ‘Data Analysis’ stage, descriptive statistics needed to analyze current national R&D research in AI and coauthor network analysis on ‘Before AI 2.0’ and ‘After AI 2.0’ were implemented to examine whether there are any significant differences in collaboration structure before and after AI 2.0.
This study analyzed the structure of national R&D collaboration in AI through coauthor network analysis from a macro-level perspective. After analyzing the structural characteristics of the coauthor network in AI, we examined whether or not the coauthor network in AI is a small-world network.
3.2. Data Collection and Preprocessing
The target of this study is AI-related papers which have been published for the past six years among national R&D research papers. In this study, a total of 4,632 government-led R&D projects implemented from 2014 to 2019 were extracted from the NTIS database, in which the results of the research performed as a part of national R&D projects are collected and managed. Among such research outcome data, papers having an AI-related keyword were extracted. In extracting AI-related papers, the followings were used as keywords, targeting domestic and foreign journals/proceedings papers: Artificial Intelligence, Machine Learning, Deep Learning, Natural Language Processing, Artificial Neutral Network, and Computer Vision. In terms of the scope of this research, the coauthor network of the research outcomes generated as a part of national R&D projects was analyzed. Therefore, there was no restriction on the author’s department or country. However, a sole author’s papers which were not matched with a research topic were excluded from the analysis. Hence, a total of 3,784 national R&D research papers were detected through the above process. Among them, 3,625 papers but 159 single-authored ones were extracted. Then, 3,478 papers excluding 147 invalid ones (e.g., author name, department and/or title not confirmed, review paper, keyword and/or research topic not relevant with AI) were selected for final analysis.
Concerning analysis targets, a total of 14,496 authors (those appearing more than once included) were extracted from the above 3,478 papers. The number was reduced to 9,478 authors after excluding double counts. Concerning author identification, an author identifier marked on domestic papers which have research IDs that are issued at participation in national R&Ds was used. When the department and Korean name were matched, full names in English were standardized. In case a researcher ID was absent, full names in English were standardized when the department, Korean name, and research topic were matched. In terms of identification of different researchers with the same name, a method proposed by Gang et al. (2020) was adopted. Specifically, email address, department information, co-authors, and research topics (keywords) were matched in order.
For modeling a coauthoring relationship between researchers with data, node and link sets were created by expressing authors (researchers) and an inter-author relationship with nodes and links (coauthoring relationship) respectively.
A node should be solely identifiable and could have attribute information. Such attributes include a researcher’s department and the number of papers released. A link can have an inter-node direction and weighted values. However, the coauthoring relationship modeled in this study takes coauthoring count as weighted value without orientation. In terms of data used for network analysis, an author pair in a coauthoring relationship keeps at least one link or more according to coauthoring frequency. An author pair without any authoring relationship keeps a matrix form which has ‘0’ link value.
4. RESULTS AND DISCUSSION
4.1. National R&D Outcomes in Artificial Intelligence
For the past six years (2014-2019), the NTIS has collected a total of 3,478 research papers in AI. Based on them, 4,632 R&D research projects were created. The two figures are not matched because multiple projects can be listed on a single research outcome. The number of R&D research papers, number of research projects, and number of researchers by year are stated in Table 2. As described in this table, the number of research projects, number of research results, and number of researchers have gradually increased. Specifically, the number of papers and number of new researchers have annually risen by 41.88% and 37.24%, respectively. In particular, the number of research outcomes and number of researchers have rapidly increased since 2017. Specifically, the figures have more than doubled after AI 2.0 (2016). Including those appearing more than once, a total of 14,496 authors were extracted from 3,478 papers in AI for the past six (6) years. When those appearing more than once were removed, 9,478 researchers were found.
Table 2
National R&D outcomes in AI by year
| Year | Outcome | Projects | Authors (those appearing more than once included) | Researchers (those appearing more than once removed) |
|||
|---|---|---|---|---|---|---|---|
| Count | Growth rate | Count | Growth rate | By stage | |||
| 2014 | 218 | - | 473 | 804 | 727 | - | 1,607 |
| 2015 | 275 | 26.15 | 501 | 1,094 | 880 | 21.05 | |
| 2016 | 327 | 18.91 | 550 | 1,176 | 836 | -5.00 | 2,538 |
| 2017 | 527 | 61.16 | 718 | 2,022 | 1,391 | 66.39 | |
| 2018 | 988 | 87.48 | 1,126 | 4,239 | 2,623 | 88.57 | 6,744 |
| 2019 | 1,143 | 15.69 | 1,264 | 5,161 | 3,021 | 15.17 | |
| Total | 3,478 | (Mean) 41.88 | 4,632 | 14,496 | 9,478 | (Mean) 37.24 | 9,478 |
In terms of the percentage of papers generated through international collaboration studies, 741 international collaboration papers (21.31%) coauthored by domestic and foreign researchers and 2,737 domestic papers (78.69%) authored by domestic researchers only were observed.
Concerning distribution by country based on researchers’ departments, domestic institutes accounted for 85.57% while foreign institutes were 14.33%. As stated in Table 3, in the latter institutes, researchers from about 50 countries participated. In terms of the number of institutes by country, the USA was the highest, followed by Germany and China.
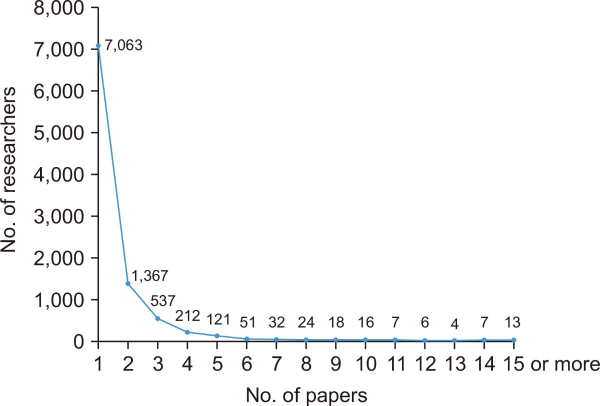
When researcher productivity was analyzed against the collected papers, among a total of 9,478 authors identified (those appearing more than once removed), 74.52% (7,063 authors) published only one paper while 14.42% (1,367 authors) wrote two papers. In other words, about 90% wrote only one or two paper(s) throughout the research period. In addition, 537 authors published three papers while 212 and 121 authors wrote four and five papers respectively. In other words, about 10% wrote three or more papers. One author wrote a total of 63 papers, which was the highest. As illustrated in Fig. 2, multiple papers have been published by few researchers.
Table 3
Distribution of researchers in AI by country
| Country | Percentage (%) | Country | Percentage (%) |
|---|---|---|---|
| USA | 39.67 | Germany | 13.88 |
| China | 7.75 | Pakistan | 5.62 |
| England | 2.99 | India | 2.94 |
| Iran | 2.63 | Singapore | 2.43 |
| Australia | 2.28 | Vietnam | 2.13 |
| Canada | 1.98 | Japan | 1.42 |
| Malaysia | 1.17 | Switzerland | 1.06 |
| France | 1.01 | Etc. | 11.04 |
It is possible to examine the continuity of research activities by examining papers published by stage. As stated in Table 4, a total of 189 authors (5.43%) have continuously engaged in research activities throughout the research period. More than 87% engaged in research activities over a single period only, while about one-fourth (23%) continued to do research even for the next period. Considering the fact that 74.5% of total researchers published a paper only once over the whole research period, only a few researchers keep engaging in research activities.
Table 4
Number of researchers by AI stage
| Doing research over a single period only | Before AI 2.0 (2014-2015) |
During AI 2.0 (2016-2017) |
After AI 2.0 (2018-2019) |
| 1,072 researchers | 1,540 researchers | 5,644 researchers | |
| Doing research continuously | Before AI 2.0-During AI 2.0 (2014-2017) |
During AI 2.0-After AI 2.0 (2016-2019) |
|
| 122 researchers | 687 researchers | ||
| Before AI 2.0, After AI 2.0 (2014-2015), (2018-2019) |
Whole period (2014-2019) |
||
| 224 researchers | 189 researchers | ||
In terms of the number of papers by the number of coauthors, ‘3 coauthors’ was the highest value with 918 papers (26.4%), followed by ‘2 coauthors’ (763 papers, 21.9%). Papers with ten or more coauthors accounted for about 2%. Among them, there were five papers with 50 or more coauthors. One paper was even written by 318 authors together. In terms of the distribution of the number of coauthors, no normal distribution was found. Instead, a long-tail structure which is close to a left-leaning power function was observed (see Fig. 3).
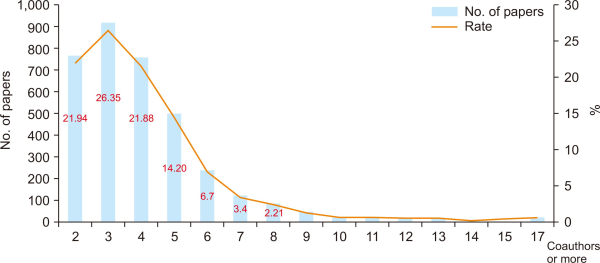
Concerning changes in the number of coauthors per paper, it increased from 3.69 in 2014 to 4.52 in 2019. The number of papers with five or more coauthors has also been on the rise recently. In addition, the highest number of coauthors has increased from 14 in 2014 to 59 in 2018 and 314 in 2019. In other words, large-scale collaboration projects in which several researchers participate have emerged.
In terms of the number of co-researchers by stage as shown in Fig. 4, before AI 2.0, ‘collaboration with 3 researchers’ was the highest value with 328 researchers. In addition, one researcher even collaborated with 78 researchers. During AI 2.0, ‘collaboration with 4 researchers’ was the highest with 491 researchers. One researcher even collaborated with 130 researchers. Even after AI 2.0, ‘collaboration with 4 researchers’ was the highest with 1,036 researchers. One researcher even collaborated with 628 researchers. Across the whole period, collaboration with 3-4 researchers was most common. The number of co-researchers revealed no big difference by stage. However, after AI 2.0, few researchers having a great number of co-researchers emerged because of increases in the amount of large-scale collaboration research, with numerous coauthors after that stage.
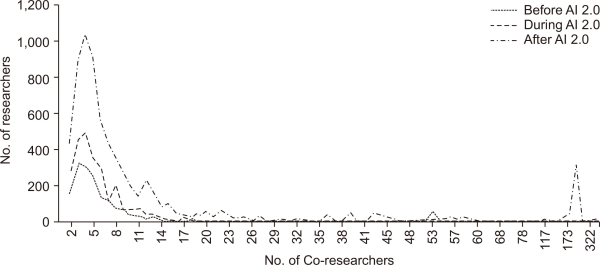
Table 5 describes changes in the number of links on a coauthor network. It is possible to examine if research activities are collaborated in a flexible fashion by observing how many links are being created and removed by the research period.
Table 5
Changes in coauthoring links by AI stage
| AI stage | Papers | Researchers | Links | New links | Old links | Links eliminated |
|---|---|---|---|---|---|---|
| Before AI 2.0 (2014-2015) | 493 | 1,607 | 4,451 | - | - | - |
| During AI 2.0 (2016-2017) | 854 | 2,538 | 5,662 | 5,465 | 197 | 4,254 |
| After AI 2.0 (2018-2019) | 2,131 | 6,744 | 69,913 | 68,936 | 977 | 4,685 |
Regarding changes in the formation of a collaborative relationship in AI, old links (relationships) account for 3.48% and 17.26% during AI 2.0 (2016-2017) and after AI 2.0 (2018-2019) respectively. In addition, new links are more than 95% of total links, confirming dramatic increase in the number of new collaborative relationships. Since AI is a rapidly changing academic field, various researchers have participated in such research activities. In particular, this tendency was obvious after AI 2.0 because AI-based research activities have expanded with the promotion of government-led R&D support policies since 2016. Therefore, there is a high possibility that researchers from diverse fields have entered AI sectors.
4.2. Collaboration Network Structure by Stage
In terms of the structure of a collaboration network before and after AI 2.0, the basic indicators for network analysis (density, average degree, average distance, diameter, coefficient, components) were examined. Table 6 shows changes in major network indicators by period. In terms of changes by stage, as the number of network researchers (nodes) rose, the number of components also increased. With increase in the number of nodes, density declined accordingly. However, even though the number of components of the researcher network after AI 2.0 rose, the number of links skyrocketed in comparison to that during AI 2.0, showing no big differences in density.
Table 6
Network indicator changes by node type
| AI stage | Node type | Nodes | Links | Density | Components |
|---|---|---|---|---|---|
| Before AI 2.0 (2014-2015) | Researcher network | 1,607 | 4,451 | 0.003 | 316 |
| During AI 2.0 (2016-2017) | 2,538 | 5,662 | 0.002 | 468 | |
| After AI 2.0 (2018-2019) | 6,744 | 69,913 | 0.003 | 726 | |
| Before AI 2.0 (2014-2015) | Institute network | 317 | 1,146 | 0.023 | 6 |
| During AI 2.0 (2016-2017) | 403 | 1,220 | 0.015 | 15 | |
| After AI 2.0 (2018-2019) | 755 | 3,248 | 0.011 | 21 | |
| Before AI 2.0 (2014-2015) | Country network | 31 | 166 | 0.357 | 1 |
| During AI 2.0 (2016-2017) | 32 | 96 | 0.194 | 1 | |
| After AI 2.0 (2018-2019) | 51 | 215 | 0.169 | 1 |
Fig. 5 illustrates national R&D networks in AI for the past six (6) years. In terms of an overall network shape, large research groups and small clusters were connected. The communities became larger, more connected, and more diverse over time.
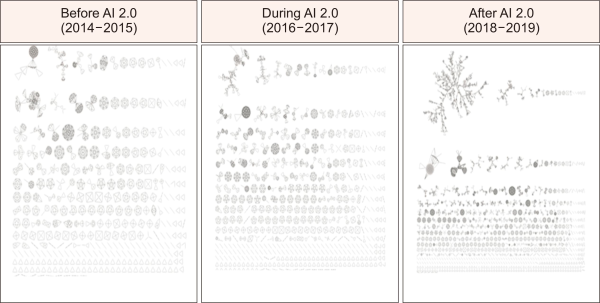
Table 7 describes the structure of a research collaboration network in AI by basic indicator. The characteristics by indicator are as follows:
Table 7
Structure of national R&D collaboration network in AI stage
| Network structure indicator | Before AI 2.0 (2014-2015) |
During AI 2.0 (2016-2017) |
After AI 2.0 (2018-2019) |
|---|---|---|---|
| Size | 1,607 | 2,538 | 6,744 |
| Density | 0.0036 | 0.0019 | 0.0033 |
| Degree | 5.7340 | 4.7754 | 22.2762 |
| Distance | 2.1626 | 4.0250 | 13.2340 |
| Coefficient | 0.9605 | 0.8369 | 0.9954 |
| Components | 316 | 468 | 726 |
4.2.1. Network Size
Network size refers to the number of nodes within the network. A large network size means numerous collaborations. Since node resources and capabilities needed to build and maintain network connection are limited, network size plays a critical role in a social relationship structure. Network size increases over time. A large scale represents increase in the number of the nodes constituting a network. The results show that research activities have become more active with increases in the number of new researchers in AI over time. In particular, the difference between before and during AI 2.0 was nearly 900, while the difference between during and after AI 2.0 was about 4,200, confirming that the increase in network size is further accelerating.
4.2.2. Network Density
Network density refers to the number of actual connections to total connections. As the number of connections increases, the value gets close to ‘1.’ Getting closer to ‘1’ means that nodes are closely related to each other with a more complicated structure. The highest density before AI 2.0 represents a relatively closer relationship among researchers who participated in collaboration during this stage. In contrast, the density during AI 2.0 was the lowest. As AI-related studies went through a transition period, the number of new researchers who did not collaborate with existing researchers increased. At the same time, research size has increased. Lastly, after AI 2.0, density rebounded from the density during AI 2.0. In other words, density rose even though the network size increased after coauthoring between new and old researchers.
4.2.3. Network Degree
Network degree refers to the average number of connections. This indicator shows relationships among researchers. In other words, it is a scale which represents how much researchers are connected to other researchers. As more connect, a network becomes denser, showing a dense network form. Regarding national R&D collaboration in AI, there was collaboration with 5.7, 4.7, and 22.3 researchers before, during, and after AI 2.0 respectively. As shown in network density, the network degree decreased during AI 2.0 but increased after AI 2.0. Furthermore, there was a significant increase from during AI 2.0 to after AI 2.0, which means that collaboration among researchers after AI 2.0 became more active.
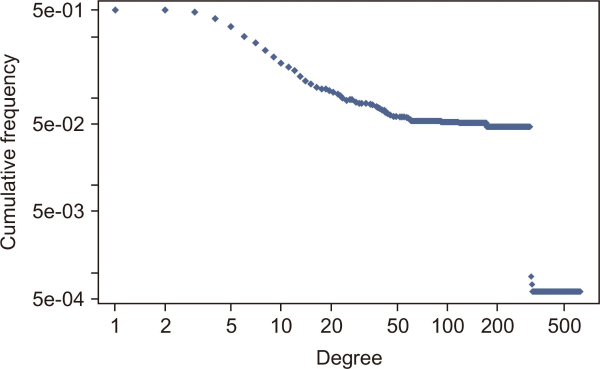
Fig. 6 illustrates degree distribution after AI 2.0 in graph form. With this distribution, it is possible to check if a network follows a power function. If the network degree graph goes after a power function, the characteristics of a scale-free network are reflected. In a scale-free network, very few nodes are greatly connected while most nodes are little connected. Therefore, most connections are enabled by few networks. As unveiled in previous studies, scientific collaboration in AI also reveals the characteristics of a small-world network. In national R&Ds in AI, network degree shows the characteristics of a scale-free network. As unveiled in previous studies, if power function distribution on a scientific collaboration network is well followed, the indicator (alpha) ranges from 2.1 to 3.0 (Onel et al., 2011). The results found that collaboration in AI was 3.28, 1.84, and 1.78 before, during, and after AI 2.0 each, which means that the coauthor network in AI has a high percentage of having scale-free network distribution. In other words, national R&D collaboration in AI has been conducted by few researchers and further strengthened over time. According to analysis of graph distribution and alpha values, a few leading researchers’ influence have gotten stronger over time, implying that the network has been formed by such few researchers.
Fig. 6
Power function distribution by degree after AI 2.0 (log-log scale). AI, artificial intelligence.
4.2.4. Network Distance
Network distance is an average of the shortest path length between nodes, and this value represents average distance between researchers. In general, if a network is the same with or shorter than ‘9,’ it is called a ‘network with a small world’ (Newman, 2001a, 2001b). A small-world structure means high information sharing speed and many researchers. In contrast, higher network distance represents getting away from small-world structure. As a result of large network distance, it takes a more time to spread information among researchers. The network distance in AI has increased over time. In particular, network distance during and after AI 2.0 exceeded ‘9,’ showing a sign of getting away from a small network size. In other words, research field, topic, and staff have broadly expanded, and the human network has become bigger. Even though information sharing has been slower than before AI 2.0 (before 2016), the network has become larger with more diverse information.
4.2.5. Coefficient
A network (or clustering) coefficient is an indicator which represents how much nodes are connected to each other through covariance between nodes. A coefficient is closely related with density changes. In a coauthor network, a coefficient refers to the probability of collaboration between two coauthors. Such probability that a couple of researchers are coauthored with the other was 0.96, 0.84, and 0.995 before, during, and after AI 2.0 respectively. Signally, 99.54% after AI 2.0 is particularly high compared to biology (6.6%), physics (43%), math (15%) (Newman, 2004), and domestic nano-bio (Lee & Lee, 2018).
4.2.6. Components
The number of components refers to the number of the subgroups constituting a network. After checking network components, the characteristics of a core network (i.e., maximum components) in each stage were investigated. As the network becomes larger, the number of components constituting the network also increases. The number of components was 316, 468, and 726 before, during, and after AI 2.0 respectively. Specifically, it increased by 258 (by 155.13% from the previous period) from during AI 2.0 to before AI 2.0. Larger-scale components have been formed over time. The ratio of researchers constituting the greatest component was 4.92% before AI 2.0 and 29.05% after AI 2.0. In other words, the number of researchers in collaboration constituting the largest component has increased (see Table 8).
Table 8
Changes in key component nodes on coauthor network by stage
| Stage | Components | Nodes | Density | Links | Percentage |
|---|---|---|---|---|---|
| Before AI 2.0 (2014-2015) | 316 | 79 | 0.088 | 271 | 4.92% |
| During AI 2.0 (2016-2017) | 468 | 213 | 0.029 | 649 | 8.39% |
| After AI 2.0 (2018-2019) | 726 | 1,959 | 0.004 | 7,584 | 29.05% |
In other words, the number of nodes constituting the largest component increased from 79 before AI 2.0 to 1,959 after AI 2.0. In addition, the number of links rose from 271 before AI 2.0 to 7,584 after AI 2.0. Accordingly, the percentage of the core network is increasing from 4.92% before AI 2.0 to 29.05% after AI 2.0. In contrast, density gradually declines as the number of nodes rises.
Fig. 7 illustrates core subgroup networks constituting the maximum component. In the first network, the core subgroup size before AI 2.0 (the number of research outcomes included in the maximum component) is 79 with 271 pairs of coauthors. Second, the core subgroup size during AI 2.0 is 213 with 649 pairs of coauthors. With the passage of time from before AI 2.0 to during AI 2.0, the core network has become more complicated. Third, the core subgroup size after AI 2.0 is 1,959. Specifically, the core network size from 2018 to 2019 is greater than the size before AI 2.0 (2014-2015). In entering the ‘after AI 2.0’ stage, in other words, the core subgroup network size dramatically increased, compared to the size during AI 2.0. The number of coauthor pairs has also dramatically increased to 7,584.

According to core clustering analysis, there have been studies on new research combinations in AI over time. In particular, increase in the number of components has accelerated with the passage of time. Therefore, subgrouping has been active in the AI-related coauthor network. As the number of nodes and links from a core network increases, the network shape has become more complicated. A dense network has been observed especially around small communities.
5. CONCLUSIONS AND IMPLICATIONS
This study attempted to analyze a researcher collaboration network by period against national R&D researchers in AI which has recently quickly grown.
First, to examine current research in AI, papers and researchers were analyzed. For this, AI-related research outcomes among those implemented as a part of national R&D projects were collected and extracted through bibliographic data. Concerning national R&D research outcomes in AI for the past six (6) years, a total of 9,478 researchers in AI were extracted from 3,478 papers. The number of papers has increased by 41.88% per year in average while the number of researchers has risen by 37.24% annually. Accordingly, the number of publications and researchers has gradually increased. Entering 2018, in particular, paper growth has accelerated. Furthermore, the number of coauthors per paper has been on the rise from 3.68 to 4.52. In particular, as the research period deepened, the number of international convergence studies in which more than 50 researchers participate has increased. Regarding the characteristics of researchers in AI, there has been collaboration with 7.75 researchers for the past two (2) years. After AI 2.0 (2018-2019), there was one researcher with the highest number of researchers in collaboration (628 researchers). As research became intense, the number of researchers in collaboration has dramatically increased.
The structure of collaboration networks by stage is as follows.
First, as the research period deepened, collaboration has expanded in terms of frequency and scale. Furthermore, as the research period approaches, a percentage maintaining a current relationship increases. However, such cases are not common. In addition, about 95% found a new relationship. In other words, new collaborative relationships have appeared more often over time, and collaboration networks have changed very fast. It appears that many old relationships have disappeared. Considering the characteristics of national R&D projects, researchers who participated in large-scale collaboration could disappear.
Second, it was confirmed that the AI sector has been led by few influential researchers. Among all researchers, 87% engaged in research activities during a single period only. In addition, only one-fourth have continuously done research. Particularly, researchers who have executed research activities throughout all periods accounted for 5.43%, which means that national R&D studies have been led by only a few groups. However, no research activities were observed during AI 2.0 (2016-2017). After AI 2.0 (2018-2019), the number of researchers who resumed such research projects has risen. Considering the characteristics of national R&D projects, it is difficult to conclude that research activities were disconnected depending on the start and end of such research. In fact, it appears that the number of researchers who have continuously engaged in research activities would be greater than actual measurements.
Third, among all papers, 21.31% account for international collaboration-related studies while 14.33% are from foreign institutes, confirming that international collaboration has been active in AI-related national R&D research. In particular, collaboration with global leaders in AI such as the USA, Germany, and China has been active. In addition, such collaboration has also been with more diverse countries (e.g., Australia, Canada).
Fourth, in terms of research network structure in AI, a split clustering pattern was observed across all stages, and the number of components increased over time, confirming intense collaboration in AI. In the early stage, however, there existed many split small groups. After AI 2.0 (2016), the scale of major groups increases despite the continuous formation of split groups. In other words, the border of major coauthor groups widens, accelerating the inflow of new researchers over time.
Lastly, from a structural perspective, there have been a great number of researchers coauthoring with key researchers. Therefore, in terms of a collaboration structure in AI, there exists a large-scale community led by few key researchers and a small community led by many researchers, and it evolves in a way to strengthen them.
To promote national R&D research collaboration in AI based on the above results, it is necessary to support core researchers in AI and seek for a method to strengthen collaboration. Since AI is a sector in which international collaboration and convergence research have been active, there should be further studies on major research groups by country to seize an opportunity for international collaboration. Furthermore, it is helpful to perform collaboration studies on many other areas where applied research efforts have been active such as bio-industry, electricity & electronics, and medicine.
As a follow-up study, it is necessary to compare the differences with other academic fields by applying the same analysis method used in this study, and it is necessary to analyze the factors that influenced collaboration.
REFERENCES
, , , (2017) Analysis of major research trends in artificial intelligence through analysis of thesis data Journal of Digital Convergence, 15(5), 225-233 https://doi.org/10.14400/JDC.2017.15.5.225.
(2020) An analysis on China's status within the international research network in the field of artificial intelligence Journal of Sinology and China Studies, 82, 217-239 https://doi.org/10.18077/chss.2020.82..010.
, , (2020) A study on the analysis of identification system and the linkage method of academic-information Journal of Korean Library and Information Science Society, 51(1), 115-143 https://doi.org/10.16981/kliss.51.202003.115.
(1980) A critical reassessment of inferred relations between multiple authorship, scientific collaboration, the production of papers and their acceptance for publication Scientometrics, 2(3), 193-201 https://link.springer.com/article/10.1007/BF02016697.
, , , , , , , , , , (2019) Artificial intelligence for social good arXiv https://doi.org/10.48550/arXiv.1901.05406.
(2017) Innovation capabilities of public research institutions: Focusing on papers related to the 4th industrial revolution (artificial intelligence) Science & Technology Policy, 27(6), 62-68 https://www.dbpia.co.kr/journal/articleDetail?nodeId=NODE07193597.
, (2018) Factors changing dynamic research collaboration network in Korean nanobiotechnology Journal of the Korean Society for Library and Information Science, 52(1), 231-258 https://doi.org/10.4275/KSLIS.2018.52.1.231.
(2018) International comparison of artificial intelligence research capabilities and implications SPRI Insight Report, 2018(3), 1-15 https://spri.kr/posts/view/22461?code=data_all&study_type=ai_brief.
Ministry of Science and ICT (2019) National strategy for artificial intelligence (AI) https://doc.msit.go.kr/SynapDocViewServer/viewer/doc.html?key=3186dcb6ace244e0870b2231aba980ae&convType=img&convLocale=ko_KR&contextPath=/SynapDocViewServer
, , (2011) The structure and analysis of nanotechnology co-author and citation networks Scientometric, 89(1), 119-138 https://link.springer.com/article/10.1007/s11192-011-0434-6.
- Submission Date
- 2022-04-24
- Revised Date
- 2022-05-04
- Accepted Date
- 2022-05-17
- Downloaded
- Viewed
- 0KCI Citations
- 0WOS Citations