JOURNAL OF INFORMATION SCIENCE THEORY AND PRACTICE
- P-ISSN2287-9099
- E-ISSN2287-4577
- SCOPUS, KCI

Factors Influencing User Satisfaction with University Library Websites in Myanmar

Siluo Yang (Department of Library Science, School of Information Management, Research Center for Chinese Science Evaluation (RCCSE), Wuhan University, Hubei, China)

Abstract
This study aims to develop a comprehensive technological framework anchored in a theoretical model to assess user satisfaction with university library websites (ULWs) in Myanmar. Adopting a quantitative approach, data were obtained via convenience sampling and subsequent inferential analysis. The target population for this study investigated users of various ULWs in Myanmar who were utilizing six university libraries. Of the collected responses, 273 valid surveys were analyzed using SPSS (version 25) and AMOS. Tools such as structural equation modeling and confirmatory factor analysis played pivotal roles in data interpretation and hypothesis validation. The proposed model highlights the significance of information quality, system quality, and librarian services in influencing both perceived usefulness (PU) and perceived ease of use (PEOU), culminating in user satisfaction. Notably, information quality and librarian services primarily impact PU, while system quality is more influential on PEOU. Interestingly, while PU has a direct bearing on user satisfaction, PEOU does not. Moreover, demographic elements such as age, gender, and education level introduce considerable differences in the utilization of ULW services. Drawing from the study’s findings, recommendations are made for ULW managers in Myanmar to bolster services, aligning with user preferences. The resulting framework offers tangible benefits to Myanmar’s educational sector, including academia, government entities, librarians, and policy framers. This pioneering research delves into the realm of ULWs in Myanmar’s higher education sector. Practically, the research underscores the necessity for stakeholders, encompassing Myanmar’s library experts and governing bodies, to elevate the standard of ULWs. Theoretically, a salient takeaway is the direct linkage between heightened usefulness and increased user satisfaction.
- keywords
- user satisfaction, university library websites, information system success model, technology acceptance model, Myanmar
1. INTRODUCTION
In Myanmar, the development of information and communication technology lags behind other ASEAN countries (Aung, 2018; Awang & Abidin, 2013; Aye, 2016; Tun, 2022). Myanmar, as a developing nation, faces technological insufficiencies and a dearth of advanced strategies. Consequently, challenges in human resource management are more pronounced, especially in the education sector, than in developed countries (Khine et al., 2021). Myanmar university libraries marked their foray into the digital space with the launch of university library websites (ULWs) in December 2013. This was facilitated by the E-Library Myanmar Project, primarily targeting major institutions (Nyein, 2016). With concerted efforts from librarians and precise guidance from information technology (IT) experts, many university libraries managed to offer services via their dedicated websites. Moreover, a predominant feature of Myanmar’s ULWs is their intent to provide free institutional repositories for users. Under the purview of the Ministry of Education, Myanmar boasts approximately 164 government-affiliated colleges and universities. While these institutions maintain library collections and staff faculty members, only a handful have embraced the digital age with library websites and digital library (DL) systems. As a result, there is a prevailing emphasis on collection development rather than digital services tailored to user needs.
The Department of Higher Education within the Ministry of Education aspires to furnish university library services to a broad spectrum of users – from academic faculty and teachers to researchers and students. However, they face hurdles in updating institutional repositories on university websites and grapple with the challenges of introducing digital services in academic libraries. This study narrows its focus to six universities, as detailed in Table 1 (providing links to the library websites of these institutions). Situated in Yangon, Myanmar’s former capital, these university libraries are among the country’s most prominent. They offer a plethora of academic resources, including databases, institutional repositories, and a range of other services. Even though many universities have initiated library websites, a significant portion of users remains unaware of these online services (Swe & Yang, 2021). As a result, university libraries should actively promote and familiarize users with their digital offerings. Previous studies have examined aspects such as collection development, usability, and user satisfaction (US) (Aye, 2016; Oo et al., 2022). Given the evolving landscape of university website services in Myanmar, a deeper exploration into the US model is warranted.
Table 1
Website link of six universities
| No. | University | Hyperlink |
|---|---|---|
| 1 | University of Yangon | https://www.uy.edu.mm |
| 2 | Universities’ Central Library | https://uclmyanmar.org |
| 3 | Yangon University Foreign Language | https://www.yufl.edu.mm |
| 4 | University of Computer Studies Yangon | https://www.ucsy.edu.mm |
| 5 | Dagon University | https://www.dagonuniversity.edu.mm |
| 6 | East Yangon University | https://eyu.edu.mm |
2. LITERATURE REVIEW
Globally, academic circles have dedicated substantial research to the pivotal realm of ULWs (Babar et al., 2020; Gao & Zheng, 2012; Liu & Xia, 2022). The pressing need for academic libraries to engage and offer services to their patrons online has heightened the importance of these studies. Catering to diverse user needs, college library websites should prioritize enhanced usability (Narnaware & Rokade, 2022). Libraries need to consider how to integrate popular old services with new components that emerge as a result of changing circumstances, and library websites are a good place to start (Lim, 2023). Developers of library websites will be able to better serve users with resources and services, make them more relevant, and enhance accessibility by establishing more direct routes—all of which will elevate the quality of information services—by utilizing data on actual user activity. Any library can enhance its website and draw readers to its content by gathering and evaluating statistics on user activity on the library website (Shevchenko, 2020). Several developed nations have published extensive research on ULWs, including topics such as the applicability of the technology acceptance model (TAM) to different age groups (Guner & Acarturk, 2020), webometric analysis (Brahma & Verma, 2018; Narnaware & Rokade, 2022), and gamification measures (Lim, 2023). Similarly, evaluations have been performed on Nigeria’s National Virtual Library (Gbaje, 2007), academic library websites in Nigeria (Abifarin & Imavah, 2018; Gbaje & Kotso, 2014), and regarding information architecture usability on websites of Sri Lankan academic libraries (Silvis et al., 2019).
Notably, despite being in close geographic proximity to these nations, Myanmar lacks comprehensive studies focusing on user perspectives related to ULWs. To date, no library professional in Myanmar has concentrated on ULW usage or the associated satisfaction factors. Initiated in 2013, the E-Library Myanmar project has been essential in the ULW movement’s growth over the last ten years (Fraser et al., 2019; Nyein, 2016). This initiative, backing several major academic institutions, has facilitated the establishment of DL systems in Myanmar. While some studies on digital transformation have been undertaken (Nyein, 2016), critiques persist concerning E-Library services. Worryingly, a sizeable demographic comprising undergraduate students and scholars remains uninformed about Myanmar ULW services (Swe & Yang, 2021). Hence, assessing user awareness becomes imperative to truly gauge US concerning ULW. The rich tapestry of international research offers inspiration and innovative methodologies for exploring the dynamics of Myanmar’s ULWs in relation to US. Consequently, this study stands as a foundational reference for various relevant academic explorations into ULWs.
2.1. Theoretical Background
US stands as a paramount metric when gauging the success of IT implementations (Keikhosrokiani et al., 2020; Zaitul et al., 2018; Zviran & Erlich, 2003). Furthermore, the value of foundational skills training cannot be understated; such training amplifies US and promotes increased voluntary engagement with the system, although not necessarily more intensive usage (Zaitul et al., 2018). The quality of communication between users and technical personnel, as underscored by previous information system (IS) research, holds significant sway over the acceptance, evaluation, and ultimate utilization of an IS (Gefen & Keil, 1998; Naeem et al., 2023). In the ever-evolving digital landscape, librarians are called upon to be adaptive, embracing new technologies to optimize user service experiences (Igbinovia, 2021). This pivot toward new technologies is not just a matter of modernization; it is grounded in research that scrutinizes technology acceptance factors, especially in developing nations, shedding light on concepts such as the Internet of Things. Evaluating technology acceptance is integral to gauging the success of an IS. Esteemed IS researchers have posited that a user’s acceptance of technology is intrinsically linked to their intention to use and the actual utilization of said technology (Marangunić & Granić, 2015). According to the McLean and DeLone model of IS success, US and utilisation are significantly impacted by the quality of the system, the information, and the services (Chen, 2011; Swe & Yang, 2021). The research pinpoints perceived usefulness (PU) and perceived ease of use (PEOU) as key determinants in IS implementation (Gefen & Keil, 1998). Elaborating on this, Davis et al. (1989) highlighted challenges related to user accessibility of computer systems and the ensuing repercussions on organizational performance. This intricate dance of acceptance and rejection of computer based IS is influenced by a diverse array of beliefs, attitudes, and satisfaction levels. Often, these determinants are deployed as a robust theoretical or psychometric foundation. A critical distinction is made between the TAM and the Theory of Reasoned Action (TRA), with the former emphasizing the pivotal roles of PU and PEOU in shaping users’ attitudes, intentions, and actual computing behaviors. In essence, PEOU underscores the notion that individuals can achieve more with the same effort, thereby directly impacting PU. Models such as the one proposed by Saeed and Abdinnour-Helm (2008) lean on the principles of TAM and the Information System Success Model (ISSM), revealing the weight of information quality (IQ) and system integration on IS utility.
Further studies, such as findings by Wixom and Todd (2005), highlight the academic proclivity to merge TAM with US theories. Pioneering works by researchers, for example Chen et al. (2016), Chen and Tsai (2019), and Soltani-Nejad et al. (2020), have sought to integrate the TAM with other models, creating robust frameworks to understand user intentions and satisfaction in various digital platforms. Ali et al. (2019) integrated TAM and ISSM to examine e-learning success, specifically hypothesizing among undergraduate students in Pakistan. Jin and Xu (2021), leveraging both ISSM and structural equation modeling (SEM), found that a number of factors significantly influenced US, including the quality of the system, the information it contains, and the services it provides. This in turn impacted loyalty toward paid knowledge platforms, as gauged by perceived value. Abdul Rahman and Mohezar (2020) underscored influential factors on DL, including perceived quality, instrumental support, PEOU, user expectations, satisfaction, net benefits, and PU. Lan and Chen (2022) combined TAM and ISSM to investigate the impact of attitudes, satisfaction, and continuing usage of telehealth services on middle-aged and older individuals living in remote places. Oktal et al. (2016) evaluated the National Judiciary Information System, revealing that IQ was the pivotal latent variable in the SEM. When one considers the vast landscape of IT/IS adoption theories, several stand out, notably: the Unified Theory of Acceptance and Use of Technology, the Theory of Planned Behavior, and the TAM by Davis et al. (1989). Within this theoretical milieu, IT/IS evaluation models emerge as essential tools, helping to elucidate user requirements and pinpoint crucial dimensions and factors for system development, ultimately fostering user acceptance and satisfaction. This study, in its quest for depth and clarity, leans on two central models.
2.1.1. Model of Information System Success
Success in IS according to the DeLone and McLean paradigm underwent enhancements and refinements as noted by Seddon (1997). DeLone and McLean’s initial 1992 framework captured temporal and causal relationships among six key factors, namely, system and organizational impacts, as well as IQ, use, individual impact and satisfaction of users. Within this model, system quality (SQ), IQ, and US were components of a causal variance model aimed at predicting subsequent IS utilization. Evaluating information and SQ entails discerning inaccuracies, recognizing that even the most technically superior systems can sometimes yield unproductive information. Concurrently, US, influenced by system and IQ, emerges as an independent variable in this variance model. Furthermore, system and IQ also help shape PU – a well-established predictor of future IS usage (Davis, 1986; Davis et al., 1989). The model received further refinements in 2003 by DeLone and McLean, introducing additional parameters such as service quality, system use, and net benefits (Karaman & Bölen, 2015). The quality of information is not just about its intrinsic value; it is also about perception and utilization, with user expectations playing a defining role. Aung (2018) and Soltani-Nejad et al. (2020) posited that a website’s design significantly affects how satisfied users are with it.
2.1.2. Technical Adoption Model
The TRA served as the model for the TAM. Davis et al. (1989) developed this paradigm even further. As a primary framework within IS theory, the TAM is characterized by several components: PU, PEOU, behavioral intention to use, and actual system usage. The main factors that determine whether or not users adopt ISs are PU and ease of usage. According to Bandura (1982), PU is the degree to which a person believes that by employing a particular technique, akin to Bandura’s self-efficacy theory, job performance would be enhanced. On the other hand, PEOU was defined by Rogers and Shoemaker (1971) as the degree to which a person thinks a system requires no effort. They also posited that the TAM could account for approximately 40% of the determinants influencing IT adoption. Numerous studies have analyzed and validated the TAM in the context of DL spanning different geographical regions. For instance, Sheikhshoaei and Oloumi (2011) argued that the TAM is not ideally suited for social and organizational factors but is more apt for individual-centric factors. They emphasized the importance of IT training to equip employees with the necessary skills, underscoring the necessity of periodic skills updates. In their study of undergraduate students’ use of DL at a Namibian institution, Kiana et al. (2021) identified US as pivotal for system support. Their research further underscored that enhancing US bolsters the success of ISs, while high quality systems invariably lead to increased satisfaction. Given this theoretical backdrop, the current study leveraged the TAM to craft hypotheses and design questionnaires, further details of which can be found in Table 2 (Dickinger & Stangl, 2013; Fathema et al., 2015; Izuagbe et al., 2016; Karaman & Bölen, 2015; Khan & Bhatti, 2017; Kiana et al., 2021; Maditinos et al., 2008; Noh & Chang, 2020; Pawinun & Asundi, 2002; Sahi, 2015; Sheikhshoaei & Oloumi, 2011; Silvis et al., 2019; Venkatesh & Bala, 2008), indicating the following hypotheses and research model development.
Table 2
Construction factors for user satisfaction with university library website
| Construct | No. of items | Adapted |
|---|---|---|
| Information quality | 5 Items | Karaman & Bölen (2015); Fathema et al. (2015); Maditinos et al. (2008) |
| System quality | 5 Items | Karaman & Bölen (2015); Fathema et al. (2015); Maditinos et al. (2008) |
| Librarian service | 6 Items | Pawinun & Asundi (2002); Sheikhshoaei & Oloumi (2011); Khan & Bhatti (2017); Kiana et al. (2021) |
| Perceived usefulness | 6 Items | Izuagbe et al. (2016); Fathema et al. (2015); Venkatesh & Bala (2008); Dickinger & Stangl (2013) |
| Perceived ease of use | 6 Items | Fathema et al. (2015); Venkatesh & Bala (2008); Dickinger & Stangl (2013) |
| User satisfaction | 6 Items | Noh & Chang (2020); Silvis et al. (2019); Sahi (2015); Dickinger & Stangl (2013) |
2.2. Information Quality
The caliber of information can be assessed through parameters such as usefulness, accuracy, reliability, and timeliness. Furthermore, a high quality of information indicates that it is pertinent, dependable, accurate, and presented in an easily understood way. Such high-quality information is typically viewed favorably by users, who find it helpful and valuable, which enhances their entire system experience. IQ was required to determine which library resources were most popular in order to enhance access to them (Shevchenko, 2020). Users are more inclined to trust the system and find it helpful for their particular needs when they believe the information is accurate and pertinent. Consequently, there may be a rise in user happiness, engagement, and system utilization. Adeyemi and Issa (2020) emphasized that the quality of information is pivotal when devising and implementing university web portals to ensure US. They advocate for university stakeholders – from management to IT experts – to prioritize assessing the quality of content on their web portals. Sharma et al. (2011) observed that users who are aware of the plethora of e-resources in their domain are more inclined to exploit online resources, bolster infrastructure, and participate in structured programs. This awareness, according to Sharma et al. (2011), increases the level of user pleasure. According to Soltani-Nejad et al. (2020), there is a strong correlation between US in DL and characteristics like information, system, and service quality. Zorba (2013) noted the dual roles of library websites, which can either serve informational purposes or act as marketing tools. The content requirements vary from departmental outlets to broader university platforms. In summary, high-quality information that is accurate, relevant, reliable, and well-presented positively affects opinions of users regarding practicality and convenience of usage. By ensuring the provision of high-quality information, systems and technologies can enhance US, engagement, and overall user experience. Given these insights, we put out the following hypotheses:
H1. Improving IQ positively affects users’ perceptions of its utility.
H2. Improving IQ positively affects users’ PEOU.
2.3. System Quality
Higher quality, dependability, and usefulness generally raise the possibility that consumers will find a system to be easier to use. It is important to remember, nevertheless, that users’ subjective assessments of usability can be impacted by a range of factors other than SQ. For instance, even a sophisticated system of the highest caliber could be viewed as challenging to use if the user interface is poorly made or if the user is not equipped with the required knowledge or abilities to operate it. Similar to this, if a system has an easy-to-use interface, even a lower-quality system could be seen as user-friendly. Superior SQ and user interface design are crucial in ensuring the delivery of high-quality information (Tun, 2021a). Academic libraries must invest in refining SQ, reconfiguring resource structures, overhauling operational processes, and ensuring seamless maintenance. This emphasis stems from the fact that SQ is crucial for optimizing web environments and addressing user demands (Zhai & Wang, 2016). Service quality stands as a paramount determinant of library website performance. Therefore, educational institutions must prioritize SQ to positively impact US with E-Library resources (Chang et al., 2015). Zhou (2014) contended that the perceived utility of a system largely hinges on its quality. Concurrently, the caliber of information has a significant bearing on US. To keep users engaged and contented, it is imperative for service providers to dispense reliable, up-to-date, and pertinent data. Satisfaction, as Zhou (2014) elucidates, is a metric reflecting the discrepancy between service quality and user expectations. Drawing from this discourse, SQ amplifies PEOU via PU, trust bolsters PU, and in turn, PU augments user contentment (Oktal et al., 2016). In conclusion, SQ has a significant impact on how users perceive a system’s usefulness and effortlessness of use. A high-quality system that performs well, provides the desired functionality, and is user-friendly can enhance the overall user experience, increase US, and favorably affect how beneficial and simple consumers perceive something to be. In light of these discoveries, we propose these hypotheses:
H3. PEOU benefits from high SQ.
H4. PU benefits from high SQ.
2.4. Librarian Service
To effectively advocate for the importance of libraries in today’s digital age, librarians must arm themselves with modern technological skills. By focusing on user-centric terminology, librarians can align their services with common language and terms, ensuring accessibility and promoting engagement within academic environments (Benedetti, 2017). Additionally, librarians can offer training sessions or workshops to educate users on information literacy skills, efficient search strategies, and proper citation practices. By empowering users with knowledge and skills, librarians enhance both PU and PEOU, making the library services more valuable and user-friendly. Besides this, PU greatly influences librarians’ attitudes toward IT. Jabeen et al. (2017) discovered that users expressed dissatisfaction with the assistance they received from librarians in navigating DL resources. Interestingly, these users were adept at utilizing various search engines and had gained substantial familiarity with library databases via librarian-provided services, such as accessing journals, articles, and full-text databases crucial for their courses. Emphasizing the significance of library orientation, Kiana et al. (2021) found a notable correlation between library training and DL usage. In the context of university DL, librarians play a pivotal role, particularly in offering specialized training sessions and facilitating research endeavors (Soltani-Nejad et al., 2020). In conclusion, librarians have a significant impact on how helpful and easy users believe library services to be. Their expertise, assistance, and guidance contribute to users’ perceptions that the service is valuable, relevant, and easy to use, ultimately enhancing the overall user experience. Therefore, the following hypotheses are formulated:
H5. There is a positive correlation between PU and librarian service.
H6. In terms of PEOU, librarian service is beneficial.
2.5. Perceived Ease of Use
Across the globe, libraries provide services mostly through websites and the Internet. Web designers have a responsibility to create websites that are visually appealing, engaging, and easy to use (Brahma & Verma, 2018). Ease of use makes it easier for users to extract value from the system, which in turn increases their perception of its usefulness. For example, a user-friendly project management tool that simplifies task management, collaboration, and reporting can be perceived as more useful by its users. Users are more satisfied with a system overall when they find it straightforward to use. Easy-to-use systems reduce frustration, minimize errors, and increase user confidence and control. Users appreciate systems that require less effort to accomplish tasks and allow them to achieve their goals efficiently. A positive user experience resulting from a high level of ease of use contributes to US. For instance, a seamless and intuitive e-commerce website that enables users to easily find and purchase products, that provides secure payment options, and offers clear and helpful product information can lead to higher US (Mamakou et al., 2024). For a system to be truly user-friendly, it should be intuitive, allowing users to seamlessly access information and services. A DL’s accessibility directly motivates its users (Masrek & Gaskin, 2016). These scholars posit that PEOU—a core tenet of the TAM—strongly resonates with US. Similarly, Thong et al. (2002) posited that PEOU indirectly enhances PU, mediated by the intention to use. To summarize, there is a positive correlation between PEOU and PU in addition to US. Users are more likely to find and accept systems that are convenient to use, which increases satisfaction with the system. Designing systems with a focus on usability and providing a smooth user experience can enhance both PU and US, leading to improved user engagement and overall system success.
Hence, we propose:
H7. PU benefits from PEOU.
H8. PEOU positively affects US.
2.6. Perceived Usefulness
Perception of usefulness is the term for the user’s perception of how beneficial a system or technology is in facilitating their tasks or achieving their goals. When users perceive a system as useful, they believe that it can effectively meet their needs, provide value, and help them accomplish their objectives. For example, if an e-commerce platform offers a wide range of products, competitive prices, and convenient shopping features, users are more likely to perceive it as useful. Masrek and Gaskin (2016) found that PU enhances the service of DL or job performance. Madle et al. (2003) emphasized the importance of usability testing for DL, especially in assessing the graphical interface, navigational ease, and user acceptability. Thong et al. (2002) suggested that PU has more influence over a DL than does PEOU. Additionally, PEOU indirectly sways intention to use, mediated through PU. US refers to the overall positive evaluation and contentment that users experience when interacting with a system or technology. When users perceive a system as useful in fulfilling their needs and goals, it contributes to their satisfaction. If a system effectively provides the features, functionalities, and benefits that users expect, it increases their satisfaction. For instance, if a user service software enables quick issue resolution, responsive communication, and personalized support, it enhances US. In summary, when users perceive a system as useful, it positively influences their satisfaction. Users are more likely to be satisfied when a system meets their expectations, helps them achieve their goals, and provides value. Designing systems with a focus on delivering PU can contribute to enhanced US, leading to increased user engagement, loyalty, and overall system success. Consequently, we propose the following:
H9. PU positively affects US.
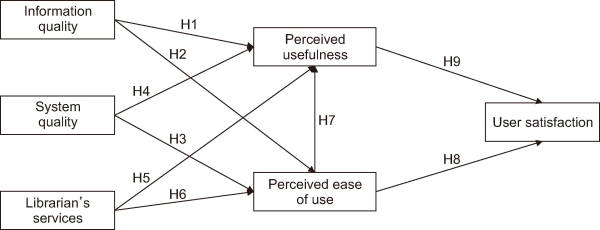
To sum up, the main goal of this research is to develop and build a novel model that investigates the factors that influence users’ satisfaction with the websites of Myanmar universities’ libraries. Drawing inspiration from the preceding discourse, this research endeavor seeks to sculpt a high-quality framework tailored for Myanmar’s ULWs. The objective is not just a theoretical exercise but a practical overhaul—reimagining university libraries to underscore the role of their digital portals, meeting user needs, and ensuring satisfaction. This research model aims to elevate the standards of ULWs in Myanmar by diving deep into user feedback, as seen in Fig. 1.
3. OBJECTIVES AND QUESTIONS
The literature evaluation unequivocally demonstrates that a thorough investigation is required to assess the chosen ULWs. Based on the available features, websites were categorized into three groups: high, medium, and poor (Dhar & Gayan, 2022). Nevertheless, the researchers did not employ any webometric indicators in their study, which was restricted to evaluating web content and creating a model for US based on six ULWs in Myanmar. Since then, as online technologies have advanced quickly, so have website functions. New technologies have entered the web development scene, including bots, semantic web, and artificial intelligence. Furthermore, the listing did not contain things like “upcoming events and activities” or “an online forum for discussion.”
This study, therefore, aims to delve into the factors affecting user awareness and satisfaction concerning ULWs. The research performs the following objectives and answers the research questions:
1. To determine the influence of user demographics on ULW usage.
2. To verify the factors that impact how PU and PEOU contribute to user contentment.
3. To assess the relationship between various determinants of US.
4. To present an innovative model outlining US for Myanmar’s ULWs.
5. To offer actionable recommendations to bolster Myanmar ULW infrastructure.
RQ1. Is there a significant difference in the usage of ULWs when grouped according to profile variables?
RQ2. Which factors play a significant role in determining US?
RQ3. How do user requirements and positive feedback contribute to ULW development?
4. METHODOLOGY
Zviran and Erlich (2003) emphasized the importance of employing diverse models and metrics to gauge US in empirical research pertaining to ISs. Consequently, the present study employed a survey methodology in order to accomplish its objectives. The research adopted a quantitative approach and harnessed the convenience sampling method within a cross-sectional survey design. Methods such as confirmatory factor analysis (CFA) and exploratory factor analysis used SEM in stages to validate and test the proposed hypotheses. There are 164 colleges and universities associated with the government, as was previously mentioned in the introduction section. However, some of these institutions only have websites that are connected to an online library. This study specifically selected 273 individuals from the websites of six universities’ libraries. Given that 273 respondents provided data for this study, both requirements for choosing the right sample size are met (Kumar et al., 2022). To assess the frequency of users’ engagement with library websites, the instruments were self-administered questionnaires utilizing a 5-point Likert measure, where 5 signified “strongly agree” and 1 denoted “strongly disagree.”
The investigation form was bilingual and available in both Myanmar and English. To ensure the content validity of the English version, it underwent scrutiny by professionals from the Department of English. For the distribution of the data collection instrument, the researcher procured the requisite permissions from the respective university rectors. Following this, with the support of university librarians, the questionnaires were disseminated. After development, the instrument was subjected to a pilot study with 15 participants encompassing library staff, educators, and students across different academic levels. The survey was conducted in Myanmar, utilizing printed forms, from February to March 2021 (Appendix). The participants’ disciplines mirrored the academic landscape of Myanmar, encapsulating fields such as arts and sciences (Table 3). Out of the total received questionnaires (332), after omitting outliers, 273 valid responses were retained for analysis. The data subsequently underwent scrutiny through descriptive statistics methodologies, with metrics such as percentage, mean, and standard deviation. The hypotheses were evaluated by using SEM and CFA techniques.
Table 3
Demographic profile of participants
| Contrast | Frequency |
|---|---|
| Gender | |
| Men | 31 (11.4) |
| Women | 242 (88.6) |
| Age (yr) | |
| ≤24 | 67 (24.5) |
| 25-29 | 63 (23.1) |
| 30-35 | 48 (17.6) |
| 36-45 | 41 (15.0) |
| 46-55 | 54 (19.8) |
| Major | |
| Science | 117 (42.9) |
| Art | 156 (57.1) |
| Education level | |
| Undergraduate | 16 (5.9) |
| Graduate | 217 (79.5) |
| Postgraduate | 40 (14.7) |
| Name of university library website | |
| University of Yangon | 46 (16.8) |
| Universities’ Central Library | 55 (20.1) |
| Yangon University of Foreign Languages | 38 (13.9) |
| Dagon University | 47 (17.2) |
| University of Computer Studies Yangon | 44 (16.1) |
| East Yangon University | 43 (15.8) |
| Total | 273 (100) |
5. RESULTS
From the analyzed data, the gender distribution showed 11.4% male and 88.6% female respondents. This evident gender disparity might be given credit for the constraints of the COVID-19 outbreak as well as the tumultuous political scenario in Myanmar under the military regime (Banerjee, 2023). With individuals avoiding physical contact during this period to inhibit virus transmission and students, and faculty actively participating in the civil disobedience movement against the military government, disruptions were evident. In particular, many males faced boycotts. Further buttressing this gender bias, the 2014 Myanmar Census reported a higher female than male population (Tun, 2021b).
5.1. Demographic Profile of the Respondents
Given these contexts, the gender skew in the present study concurred with the prevailing societal dynamics. Age wise, the respondents were distributed as follows: 24.5% below 24 years, 23.1% between 25-29, 19.8% between 46-55, 17.6% between 30-35, and 15.0% between 36-45. Academically, a vast majority (79.5%) were graduate students, followed by postgraduates (14.7%) and undergraduates (5.9%). Disciplinary distribution revealed 57.1% from arts and 42.9% from sciences. Analyzing specific ULW engagement, 20.1% of participants used the universities’ central library (UCL), 17.2% Dagon University, 16.8% University of Yangon, 16.1% University of Computer Studies Yangon, 15.8% East Yangon University, and 13.9% engaged with Yangon University of Foreign Languages. Further details are located in Table 3.
5.2. Preliminary Descriptive Analysis of Data
According to Kline (2011), a Z score (standard deviation) that falls between -0.3 and 0.3 should be deleted. For data to be considered normally distributed, kurtosis should lie between -7 and +7, and skewness should lie between -2 and +2. These criteria can be viewed in Table 4. The results indicate that all questionnaire items possess standard deviation. Table 4 displays skewness and kurtosis values ranging from -2 to 2. Based on this data normality, respondents appear to have a strong conviction that IQ can meet their requirements for ULW usage, as seen in the standard deviations for IQ 2, 3, 4, and 1. Additionally, respondents also expressed positive beliefs regarding US 4 and SQ 5.
Table 4
Preliminarily descriptive analysis of data normality
| Item | Descriptive statistic | |||
|---|---|---|---|---|
| 1 | Indicator | Standard deviation | Skewness | Kurtosis |
| 2 | IQ1 | 0.513 | -0.108 | 0.745 |
| 3 | IQ2 | 0.532 | -0.451 | 0.372 |
| 4 | IQ3 | 0.524 | -0.208 | -0.275 |
| 5 | IQ4 | 0.52 | -0.195 | 0.25 |
| 6 | IQ5 | 0.474 | -0.362 | 1.043 |
| 7 | SQ1 | 0.43 | -0.549 | 1.945 |
| 8 | SQ2 | 0.465 | -0.471 | 0.998 |
| 9 | SQ3 | 0.454 | -0.571 | 1.04 |
| 10 | SQ4 | 0.461 | -0.45 | 1.186 |
| 11 | SQ5 | 0.527 | -0.769 | 1.758 |
| 12 | LS1 | 0.426 | 0.26 | 2.473 |
| 13 | LS2 | 0.452 | 0.291 | 1.752 |
| 14 | LS3 | 0.415 | 0.449 | 2.612 |
| 15 | LS4 | 0.448 | 0.181 | 1.989 |
| 16 | LS5 | 0.459 | 0.197 | 1.716 |
| 17 | LS6 | 0.471 | 0.259 | 1.358 |
| 18 | PEOU1 | 0.442 | -0.612 | 1.361 |
| 19 | PEOU2 | 0.475 | -0.509 | 0.407 |
| 20 | PEOU3 | 0.435 | -0.407 | 2.063 |
| 21 | PEOU4 | 0.456 | -0.496 | 1.219 |
| 22 | PEOU5 | 0.425 | -0.607 | 2.002 |
| 23 | PEOU6 | 0.436 | -0.63 | 1.54 |
| 24 | PU1 | 0.432 | -0.5 | 1.989 |
| 25 | PU2 | 0.455 | -0.326 | 1.64 |
| 26 | PU3 | 0.448 | -0.326 | 1.821 |
| 27 | PU4 | 0.453 | -0.092 | 1.923 |
| 28 | PU5 | 0.432 | -0.361 | 2.2 |
| 29 | PU6 | 0.444 | -0.173 | 2.087 |
| 30 | US1 | 0.436 | -0.154 | 2.293 |
| 31 | US2 | 0.452 | -0.187 | 1.895 |
| 32 | US3 | 0.464 | -0.442 | 1.112 |
| 33 | US4 | 0.534 | -1.007 | 2.365 |
| 34 | US5 | 0.453 | -0.092 | 1.923 |
| 35 | US6 | 0.454 | -0.031 | 1.931 |
5.3. Results of Factor Loading and Cronbach’s Alpha
The Kaiser-Meyer-Olkin value for factor analysis stands at 0.912, with a chi-square value of 4,613.195. In line with Fornell and Larcker (1981), the Cronbach’s alpha lies between 0.875 and 0.93. All composite reliability values exceed 0.8, surpassing the recommended threshold of 0.7 (Hair et al., 2019). The factor loadings for each item in the measurement model, as shown in Table 5, range from 0.652 to 0.904. Hair et al. (2019) suggest that factor loadings below 0.50 indicate items that may need removal. However, with factor loadings above 0.50, as in this case, all criteria for convergent validity are met, as illustrated in Table 5.
Table 5
Analysis results of factor loading and Cronbach’s alpha
| Factor | PU | LS | PEOU | IQ | US | SQ | CA |
|---|---|---|---|---|---|---|---|
| PU5 | 0.81a) | 0.092 | 0.258 | 0.24 | 0.212 | 0.227 | 0.938 |
| PU4 | 0.792a) | 0.233 | 0.22 | 0.13 | 0.224 | 0.221 | |
| PU6 | 0.774a) | 0.13 | 0.351 | 0.215 | 0.18 | 0.208 | |
| PU3 | 0.751a) | 0.163 | 0.259 | 0.271 | 0.249 | 0.16 | |
| LS5 | 0.139 | 0.904a) | 0.099 | 0.1 | 0.206 | 0.106 | 0.938 |
| LS4 | 0.107 | 0.897a) | 0.088 | 0.109 | 0.252 | 0.012 | |
| LS6 | 0.163 | 0.867a) | 0.057 | 0.053 | 0.245 | 0.162 | |
| PEOU5 | 0.245 | 0.095 | 0.847a) | 0.135 | 0.13 | 0.226 | 0.905 |
| PEOU6 | 0.272 | 0.043 | 0.793a) | 0.146 | 0.161 | 0.3 | |
| PEOU4 | 0.366 | 0.147 | 0.775a) | 0.3 | 0.025 | 0.111 | |
| IQ3 | 0.199 | 0.089 | 0.185 | 0.842a) | 0.181 | 0.192 | 0.882 |
| IQ2 | 0.219 | 0.119 | 0.217 | 0.829a) | 0.07 | 0.209 | |
| IQ4 | 0.253 | 0.087 | 0.103 | 0.664a) | 0.188 | 0.46 | |
| US2 | 0.24 | 0.236 | 0.078 | 0.114 | 0.846a) | 0.093 | 0.895 |
| US1 | 0.248 | 0.29 | 0.143 | 0.191 | 0.78a) | 0.039 | |
| US5 | 0.147 | 0.289 | 0.093 | 0.096 | 0.767a) | 0.226 | |
| SQ4 | 0.29 | 0.166 | 0.296 | 0.214 | 0.109 | 0.779a) | 0.875 |
| SQ3 | 0.2 | 0.173 | 0.294 | 0.433 | 0.118 | 0.706a) | |
| SQ2 | 0.297 | 0.041 | 0.245 | 0.382 | 0.226 | 0.652a) |
5.4. Result of Pearson’s Correlation
The findings indicate that all variables exhibit a strong positive correlation at the 0.01 significance level.
The correlation coefficients range from 0.536 for IQ and PEOU to a peak of 0.731 for SQ and IQ. Shaded cells within Table 6 denote the nine causal relationships illustrated in the proposed research model (Fig. 2). It is important to note that while these correlations are substantial, they do not necessarily confirm the presence of strong causal relationships, as highlighted by Kline (2011).
5.5. Results of Convergent Validity, AVE, and Composite Reliability
The average variance extracted analysis (AVE) values ranged between 0.709 and 0.836, which are well above the guideline of 0.5 (or 50%) as suggested by Hair et al. (2019) (refer to Table 7). All the indicators were found to be significant, with the standardized regression weights for all indicators surpassing 0.768. Consequently, the dataset demonstrates robust convergent validity and a high level of internal consistency reliability.
Table 7
Analysis results of convergent validity, AVE, and CR
| Factor name | Item name | Standardized regression | AVE | CR |
|---|---|---|---|---|
| LS | LS4 | 0.917 | 0.836 | 0.939 |
| LS5 | 0.942 | |||
| LS6 | 0.884 | |||
| IQ | IQ2 | 0.845 | 0.715 | 0.883 |
| IQ3 | 0.853 | |||
| IQ4 | 0.839 | |||
| SQ | SQ2 | 0.825 | 0.745 | 0.897 |
| SQ3 | 0.911 | |||
| SQ4 | 0.851 | |||
| PEOU | PEOU4 | 0.865 | 0.762 | 0.906 |
| PEOU5 | 0.888 | |||
| PEOU6 | 0.871 | |||
| PU | PU3 | 0.863 | 0.794 | 0.939 |
| PU4 | 0.865 | |||
| PU5 | 0.883 | |||
| PU6 | 0.871 | |||
| US | US1 | 0.866 | 0.709 | 0.879 |
| US2 | 0.888 | |||
| US5 | 0.768 |
5.6. Results of Discriminant Validity
Hair et al. (2019) emphasized that assessing discriminant validity, which determines differences among correlated factors, is crucial for validating constructs. In Table 8, all the square root values of AVE exceed the correlation estimates for each construct, and these values are highlighted in bold.
Table 8
Analysis results of discriminant validity
| Factor name | PU | PEOU | IQ | SQ | LS | US |
|---|---|---|---|---|---|---|
| PU | 0.891 | |||||
| PEOU | 0.733 | 0.873 | ||||
| IQ | 0.654 | 0.595 | 0.845 | |||
| SQ | 0.701 | 0.713 | 0.822 | 0.863 | ||
| LS | 0.418 | 0.315 | 0.336 | 0.386 | 0.914 | |
| US | 0.604 | 0.411 | 0.476 | 0.488 | 0.611 | 0.842 |
Based on the analysis, the proposed research model demonstrates robust discriminant validity, making it suitable for subsequent SEM analysis. This can be referenced in Table 8.
5.7. Result of Model Fit Indices
The fit indices for the measurement model are as follows: goodness-of-fit index (GFI)=0.886, adjusted goodness-of-fit index (AGFI)=0.842, normed fit index (NFI)=0.928, incremental fit index (IFI)=0.956, comparative fit index (CFI)=0.956, and the root mean square error of approximation (RMSEA)=0.074 with x2/df=2.479. In the subsequent analysis of the structural model’s fit indices, the results yielded x2/df=2.836, GFI=0.872, AGFI=0.827, NFI=0.916, IFI=0.944, CFI=0.944, and RMSEA=0.082. Given that GFI and AGFI values exceed 0.8, NFI, IFI, and CFI values surpass 0.9, and with RMSEA exceeding 0.08 for both the measurement and structural models, these indicators point toward a good fit. These findings can be cross-referenced in Table 9. Consequently, this suggests that the research model for this study offers an acceptable fit to the data at hand.
5.8. Results of Hypotheses and Research Mode
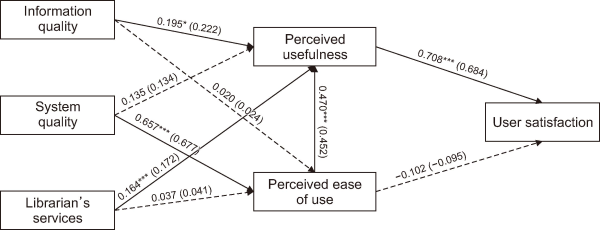
Table 10 presents the outcomes of the hypothesis testing. H1 and H5 indicate that librarian services significantly influence both PU (β=0.164, p<0.001) and IQ (β=0.195, p<0.05). Additionally, SQ considerably affects perceived usability (β=0.657, p<0.001). There is also a marked influence of PEOU on PU (β= 0.470, p<0.001), and PU notably impacts US (β=0.708, p<0.008), leading to the approval of H3, H7, and H9. Furthermore, both librarian services (β=0.037, p<0.05) and IQ (β=0.020, p<0.05) positively impact PEOU, while SQ has a notable influence on PU (β=0.135, p<0.05). However, H2, H4, and H6 were not supported. The data also contradict H8, indicating that PEOU does not significantly influence US. All these insights from the hypothesis testing can be viewed in Fig. 2.
Table 10
Analysis results of hypotheses
| Hypothesis | Relationship | Effect | Path coefficient | Result |
|---|---|---|---|---|
| H1 | IQ → PU | + | 0.195* (0.222) | Accepted |
| H2 | IQ → PEOU | + | 0.020 (0.024) | Rejected |
| H3 | SQ → PEOU | + | 0.657*** (0.677) | Accepted |
| H4 | SQ → PU | + | 0.135 (0.134) | Rejected |
| H5 | LS → PU | + | 0.164*** (0.172) | Accepted |
| H6 | LS → PEOU | + | 0.037 (0.041) | Rejected |
| H7 | PEOU → PU | + | 0.470*** (0.452) | Accepted |
| H8 | PEOU → US | - | -0.102 (-0.095) | Rejected |
| H9 | PU → US | + | 0.708*** (0.684) | Accepted |
6. DISCUSSION
6.1. Contribution of Theory
This research provides numerous noteworthy theoretical advances to the literature on ULWs, particularly in relation to US. First, this research aims to bridge the existing gaps between theory and practice specific to ULW services in Myanmar. Additionally, this study illuminates the multifaceted nature of US, revealing how it hinges on the prevailing quality of the ULW system, information, librarian service, PEOU, and utility. Several theories underscore the study’s findings. For instance, our results echo Gefen and Keil (1998), Davis et al. (1989), and others, suggesting that IQ significantly influences PU (Lan & Chen, 2022). Similarly, research by Mahmood et al. (2000), Zviran and Erlich (2003), Xu and Du (2018), Izuagbe et al. (2019), and then more recent studies resonates with our discovery that librarian services contribute to this PU. The relationship between service quality and PEOU has been substantiated by Senaratne and Samarasinghe (2019). Notably, the influence of PU on US was also observed in the findings of Zviran and Erlich (2003), who found that numerous ISs failed or were underutilized over the past five years. A plausible explanation for this could be the inactivity of the websites when users access ULW (Firdaus et al., 2019).
However, some of our findings diverge from established theories. For instance, contrary to expectations, IQ did not influence the PEOU of ULW services. This might be attributed to ULWs’ services. Similarly, librarian services did not have a significant impact on PEOU. This aligns with Wolfe et al. (2010), who found that users often relied more on search engines such as Google rather than ULWs. They also observed that users lacked the patience to await librarians’ responses, often feeling more knowledgeable than the librarians. Furthermore, SQ was not a significant influencer of the PU for ULW US. Cho et al. (2019) made a similar observation in their study on e-government services. The possible reason could be the enhanced user productivity offered by the current systems, ensuring seamless access. Last, while we anticipated a significant effect of PEOU on US, the results revealed no such influence. Zviran and Erlich (2003) also reported a similar result in their study of IS in the US literature: “Users will not be as willing to use a system if they believe that it is not satisfactory from their perspective.” Bandura (1982) and Lepper (1985) also reported similar findings in their studies on self-efficacy and motivational issues, both from psychological perspectives, and stating that efficacy is a major factor underlying intrinsic motivation.
Besides this, nothing observed on ULW is comprehensive or the end-all when it comes to tools or methods for ensuring US (Lim, 2023). In conclusion, our findings demonstrate that PU directly correlates with heightened US. If universities aspire to amplify US on their websites, these platforms should not only be inherently useful but should also offer seamless technical support, demand minimal setup, and be intuitively easy to learn (Zaitul et al., 2018). Interestingly, in the context of DL, PU emerged as a more reliable indicator of US than usability, aligning with studies by Madle et al. (2003), Oktal et al. (2016), and Chaloeyprach and Ketmuni (2021). This reinforces previously established patterns in research focusing on user acceptance and IT adoption (Guner & Acarturk, 2020). Importantly, PEOU and usefulness act as intervening variables bridging SQ, IQ, and librarian services to US concerning ULW service usage.
6.2. Managerial Contributions
Given that a ULW epitomizes a university’s academic standing, one can gauge the institution’s reputation through its ULW. Achieving optimal US is a continual endeavor, requiring sustained research to understand how user feedback evolves over time (Mahmood et al., 2000). In light of this, university heads should actively encourage website administrators and library specialists to elevate both the information and SQ of the ULW.
A collaborative approach involving university rectors, website administrators, librarians, and other library professionals is vital to ensure high-caliber ULW services in Myanmar. As we look forward, there is an evident need to enhance the information and SQ of ULW services in Myanmar. Addressing this requires a comprehensive strategy encompassing adequate budgets, skilled technicians, and effective dissemination of ULW services by librarians and library professionals. Furthermore, it is imperative for university librarians and academic staff in the Department of Information Studies to continually assess their library websites. They should gauge user engagement and satisfaction levels and provide annual reviews of ULW advancements to the Department of Higher Education (under the aegis of the Ministry of Education). By implementing such practices, users will become more familiar with ULW services through insights from research surveys. This will eventually foster increased awareness and satisfaction levels, propelling the stature of ULW services in Myanmar.
6.3. Research Limitations and Prospects for the Future
The present study’s scope is confined to a cross-sectional examination, focusing solely on factors influencing US. Notably absent is a comprehensive understanding of international ULW users’ perceptions and a ranking of which ULW offers the highest US in Myanmar. Given the rapid evolution of technical support, there is a pressing need for future studies to adopt qualitative and longitudinal approaches. Another limitation of this research pertains to its focus on only six universities. Expanding the study to encompass additional universities in Myanmar could provide a more holistic view of US in relation to the country’s ULW ecosystem. Furthermore, a potential avenue for exploration is the integration of mobile apps tailored for ULWs, emphasizing information and SQ designs. This proposition not only underscores the relevance of mobile technologies in today’s digital landscape but also suggests a forward-thinking approach to further embed IT within Myanmar’s academic sector.
Moreover, US is influenced by a wide range of factors from many perspectives. Among them, the concepts based on library service fields are mentioned for further direction. According to Sureshchandar et al. (2002), there are differences between US and service quality, but they are also closely related, thus improving one will probably improve the other. Other scholars have employed single-item scales to operationalize US, while others have employed multiple-item scales. Oh (2013) proposed a conceptual model consisting of fifteen items to calculate the public library’s satisfaction index. This model considers three factors: service quality (50%), customer satisfaction (40%), and loyalty (10%).
Using LibQUAL+TM, Twum et al. (2021) investigated the concept of service quality and offered factual data on variables impacting library patron loyalty. The image of a library brand is influenced by service effect, information access, personal control, and user loyalty. For the library to cultivate a favorable brand reputation and patronage, management must always raise the calibre of its services. According to Oh (2023)’s recommendation, users’ perceptions of service quality in public libraries focus on three dimensions: library personnel, resources and user services, and facilities and equipment. The results indicated that users were generally satisfied not only with the library services and expressed loyalty towards the libraries, but also that service quality positively influenced customer satisfaction, which impacted user loyalty. Similarly, Oh (2020) also analyzed data from 1,015 public library users in South Korea to investigate their perceptions of service quality, satisfaction, and loyalty. The results showed high satisfaction levels, loyalty, and perceived service quality, with significant impacts observed between these variables. Therefore, Oh (2020; 2023) observed that user loyalty was found across different demographic groups.
7. CONCLUSION
This present study finds a significant relationship between US and PU. It provides fresh insights into US concerning websites from the users’ viewpoint, enriching the TAM and ISSM literature. If universities wish to enhance US, focusing on increasing the PU of their websites could be an effective strategy. An analysis of user demographics, including gender, age, major, education level, and specific ULW usage, showed significant disparities. Notably, females, users under 24, those between 25 and 29 and between 46 and 55, students of the arts, graduate students, and users of the UCL website were most frequent, answering RQ1.
Empirical evidence demonstrates that factors such as IQ and librarian services in ULWs influence US through their PU. Interestingly, SQ is tied to both PEOU and US. Of prime importance, the research underscores that PU strongly impacts US. Thus, better IQ, easier system access, enhanced librarian services, and increased usefulness all lead to greater satisfaction, answering RQ2.
In contrast, PEOU was not a major determinant of US concerning ULW services. In a DL setting, while PEOU and usefulness acted as mediators for US, US primarily hinged on the quality and relevance of the information provided by ULW. As most users are adept with digital tools, the initial focus should be on the quality of information in ULW. Comprehensive and updated information is pivotal for US. A system’s usability can drive its frequency of use, which in turn impacts US. Librarian services play a crucial role in this; their expertise in guiding user searches based on SQ is vital. Hence, librarian services should prioritize usefulness over usability. To continually improve, librarians must communicate ULW status to higher authorities, answering RQ3.
Based on the findings, users found the ULW highly useful in terms of IQ, librarian services, and PEOU for their research. Myanmar ULW’s SQ was the only aspect perceived as easy to access. On the other hand, users did not see ULW IQ, librarian services, or SQ as highly usable or useful. The PEOU did not significantly contribute to their research satisfaction.
It is worth noting that many ISs fail or are underutilized. Regrettably, at least one IS breakdown was reported in the last five years. Stakeholders and web administrators should ensure consistent website availability to match user expectations. It is also important to select the right evaluation methods to gauge the system’s utility concerning user needs. This research provides invaluable insights for Myanmar’s academic governmental institutions, helping administrators and librarians devise more efficient strategies.
REFERENCES
, (2020) Ensuring continued use of a digital library: A qualitative approach Electronic Library, 38(3), 513-530 https://doi.org/10.1108/EL-12-2019-0294.
, (2018) Design evaluation of academic library websites in Nigeria African Journal of Computing & ICT, 11(3), 12-32 https://afrjcict.net/wp-content/uploads/2017/08/vol11no3sept18pap2journformnumbered.pdf.
, (2020) Integrating Information System Success Model (ISSM) and Technology Acceptance Model (TAM): Proposing students' satisfaction with university web portal model Record and Library Journal, 6(1), 69-79 https://doi.org/10.20473/rlj.V6-I1.2020.69-79.
, , , , (2019) Investigating the usage of e-learning: An integrated model of TAM and IS success Sindh University Research Journal, 51(2), 169-174 https://sujo.usindh.edu.pk/index.php/SURJ/article/view/787.
, , (2020) Marketing features on university library websites in Pakistan [Library Philosophy and Practice] 4443 https://digitalcommons.unl.edu/libphilprac/4443/.
(1982) Self-efficacy mechanism in human agency American Psychologist, 37(2), 122-147 https://doi.org/10.1037/0003-066X.37.2.122. Article Id (pmcid)
(2017) Promoting library services with user-centered language Libraries and the Academy, 17(2), 217-234 https://doi.org/10.1353/pla.2017.0013.
, (2018) Evaluation of websites of public libraries of India under Ministry of Culture: A webometric analysis Journal of Information Science Theory and Practice, 6(3), 16-24 https://doi.org/10.1633/JISTaP.2018.6.3.2.
, (2021) The acceptance of using library mobile application of the students at Faculty of Liberal Arts, Rajamangala University of Technology Thanyaburi Psychology and Education Journal, 58(1), 1471-1477 https://doi.org/10.17762/pae.v58i1.931.
, , , (2015) Exploration of usage behavioral model construction for university library electronic resources Electronic Library, 33(2), 292-307 https://doi.org/10.1108/EL-10-2013-0195.
, (2019) Determinants of behavioral intention to use the Personalized Location-based Mobile Tourism Application: An empirical study by integrating TAM with ISSM Future Generation Computer Systems, 96, 628-638 https://doi.org/10.1016/j.future.2017.02.028.
, , , (2016) Integrating ISSM into TAM to enhance digital library services: A case study of the Taiwan Digital Meta-Library Electronic Library, 34(1), 58-73 https://doi.org/10.1108/EL-01-2014-0016.
(2011) Undergraduates' perceptions and use of the university libraries Web portal: Can information literacy instruction make a difference? Proceedings of the American Society for Information Science and Technology, 48(1), 1-10 https://doi.org/10.1002/meet.2011.14504801051.
, , , , , , , , (2019, July 8-11) Proceedings of the 20th IEEE/ACIS International Conference on Software Engineering, Artificial Intelligence, Networking and Parallel/Distributed Computing IEEE A study on the factors affecting the continuous use of e-government services - Focused on privacy and security concerns -, 351-361,
, , (1989) User acceptance of computer technology: A comparison of two theoretical models Management Science, 35(8), 982-1003 https://doi.org/10.1287/mnsc.35.8.982.
, (2022) A webometric study of selected international library association websites: An evaluative study DESIDOC Journal of Library & Information Technology, 42(3), 185-190 https://doi.org/10.14429/djlit.42.3.17772.
, (2013) Website performance and behavioral consequences: A formative measurement approach Journal of Business Research, 66(6), 771-777 https://doi.org/10.1016/j.jbusres.2011.09.017.
, , (2015) Expanding the Technology Acceptance Model (TAM) to Examine Faculty Use of Learning Management Systems (LMSs) in higher education institutions Journal of Online Learning & Teaching, 11(2), 210-233 https://www.researchgate.net/publication/281842180_Expanding_The_Technology_Acceptance_Model_TAM_to_Examine_Faculty_Use_of_Learning_Management_Systems_LMSs_In_Higher_Education_Institutions.
, (1981) Structural equation models with unobservable variables and measurement error: Algebra and statistics Journal of Marketing Research, 18(3), 382-388 https://doi.org/10.1177/002224378101800313.
(2007) Implementing a national virtual library for higher institutions in Nigeria Library and Information Science Research E-Journal, 17(2), 1-15 https://doi.org/10.32655/LIBRES.2007.2.5.
, (2014) Assessing the contents of Nigeria academic library website Information and Knowledge Management, 4(7), 6-11 https://www.iiste.org/Journals/index.php/IKM/article/view/14182/14490.
, (1998) The impact of developer responsiveness on perceptions of usefulness and ease of use: An extension of the technology acceptance model ACM SIGMIS Database: The DATABASE for Advances in Information Systems, 29(2), 35-49 https://doi.org/10.1145/298752.298757.
, (2020) The use and acceptance of ICT by senior citizens: A comparison of technology acceptance model (TAM) for elderly and young adults Universal Access in the Information Society, 19(2), 311-330 https://doi.org/10.1007/s10209-018-0642-4.
, , , (2019) When to use and how to report the results of PLS-SEM European Business Review, 31(1), 2-24 https://doi.org/10.1108/EBR-11-2018-0203.
(2021) Internet of things in libraries and focus on its adoption in developing countries Library Hi Tech News, 38(4), 13-17 https://doi.org/10.1108/LHTN-05-2021-0020.
, , (2016) Electronic information resources (EIR) adoption in private university libraries: The moderating effect of productivity and relative advantage on perceived usefulness Journal of Information Science Theory and Practice, 4(1), 30-48 https://doi.org/10.1633/JISTaP.2016.4.1.3.
, , , , , , (2019) Effect of perceived ease of use on librarians' e-skills: Basis for library technology acceptance intention Library & Information Science Research, 41(3), 100969 https://doi.org/10.1016/j.lisr.2019.100969.
, , , , (2017) Library Collections, Acquisitions, & Technical Services (Vol. 40) Usability study of digital libraries: An analysis of user perception, satisfaction, challenges, and opportunities at university libraries of Nanjing, China, 1-2, pp. 58-69, https://doi.org/10.1080/14649055.2017.1331654
, (2021) Examining the factors influencing user satisfaction and loyalty on paid knowledge platforms Aslib Journal of Information Management, 73(2), 254-270 https://doi.org/10.1108/AJIM-07-2020-0228.
, , , (2020) Assessment of a medical information system: The mediating role of use and user satisfaction on the success of human interaction with the mobile healthcare system (iHeart) Cognition, Technology & Work, 22(2), 281-305 https://doi.org/10.1007/s10111-019-00565-4.
, (2017) Digital competencies for developing and managing digital libraries: An investigation from university librarians in Pakistan Electronic Library, 35(3), 573-597 https://doi.org/10.1108/EL-06-2016-0133.
, , (2021) Towards implementation of blended teaching approaches for higher education in Myanmar International Journal of Education and Management Engineering, 11(1), 19-27 https://doi.org/10.5815/ijeme.2021.01.03.
, , , , (2021) Predictors of digital library usage by undergraduate students at a Namibian University: Perspectives based on technology acceptance model African Journal of Library, Archives and Information Science, 31(1), 1-12 https://go.gale.com/ps/i.do?id=GALE%7CA663350481&sid=googleScholar&v=2.1&it=r&linkaccess=abs&issn=07954778&p=AONE&sw=w&userGroupName=anon%7Ec5caae6&aty=open-web-entry.
, , , (2022) Analyzing the impact of value satisfaction on behavioral intention to use e-resources Journal of Information Science Theory and Practice, 10(3), 1-14 https://doi.org/10.1633/JISTaP.2022.10.3.1.
, (2022) Telehealth care system for chronic disease management of middle-aged and older adults in remote areas Health Informatics Journal, 28(4), 14604582221141835 https://doi.org/10.1177/ .
(1985) Microcomputers in education: Motivational and social issues American Psychologist, 40(1), 1-18 https://doi.org/10.1037/0003-066X.40.1.1.
(2023) On the application of gamification elements in libraries Journal of Information Science Theory and Practice, 11(2), 1-11 https://doi.org/10.1633/JISTaP.2023.11.2.1.
, (2022) Construction of classification model of academic library websites in Jiangsu based on decision tree algorithm and link analysis method Open Access Library Journal, 9, e8324 https://doi.org/10.4236/oalib.1108324.
, , (2008) Measuring user satisfaction with respect to websites Zagreb International Review of Economics and Business, 11(Special Conference Issue), 81-97 https://hrcak.srce.hr/en/clanak/116917.
, , , (2000) Variables affecting information technology end-user satisfaction: A meta-analysis of the empirical literature International Journal of Human-Computer Studies, 52(4), 751-771 https://doi.org/10.1006/ijhc.1999.0353.
, , (2024) Measuring customer satisfaction in electronic commerce: The impact of e-service quality and user experience International Journal of Quality & Reliability Management, 41(3), 915-943 https://doi.org/10.1108/IJQRM-07-2021-0215.
, (2015) Technology acceptance model: A literature review from 1986 to 2013 Universal Access in the Information Society, 14(1), 81-95 https://doi.org/10.1007/s10209-014-0348-1.
, (2016) Assessing users satisfaction with web digital library: The case of Universiti Teknologi MARA International Journal of Information and Learning Technology, 33(1), 36-56 https://doi.org/10.1108/IJILT-06-2015-0019.
, , (2023) Evolution of modified TAM associated with e-banking services adoption: A systematic PRISMA review from 1975 to 2021 Journal of Modelling in Management, 18(3), 942-972 https://doi.org/10.1108/JM2-10-2021-0251.
, (2022) Webometric study of national institutional ranking framework (NIRF) listed college website with special reference to library web pages Library Philosophy and Practice, 7389 https://digitalcommons.unl.edu/libphilprac/7389/.
, (2020) A study on the factors of public library use by residents Journal of Librarianship and Information Science, 52(4), 1110-1125 https://doi.org/10.1177/0961000620903772.
(2016) Transforming libraries in Myanmar: The eLibrary Myanmar project Insights, 29(3), 266-272 https://doi.org/10.1629/uksg.319.
(2013) Developing LCSI (library customer satisfaction index) lite for public library Journal of the Korean Society for Library and Information Science, 47(4), 335-361 https://doi.org/10.4275/KSLIS.2013.47.4.335.
(2020) Beyond providing information: An analysis on the perceived service quality, satisfaction, and loyalty of public library customers Libri, 70(4), 345-359 https://doi.org/10.1515/libri-2020-0006.
(2023) How to measure service quality, customer satisfaction and loyalty of public library users: Application of library customer satisfaction index (LCSI) lite model Journal of Librarianship and Information Science, 55(3), 719-733 https://doi.org/10.1177/09610006221101193.
, , (2016) Measurement of internal user satisfaction and acceptance of the e-justice system in Turkey Aslib Journal of Information Management, 68(6), 716-735 https://doi.org/10.1108/AJIM-04-2016-0048.
, , , , (2022) Development of Yadanabon University Library (2000-2021) Yadanabon University Research Journal, 12(2), 105-119 https://meral.edu.mm/record/8372/files/Sanda%20Oo.pdf.
, (2002) Changing facets of library instruction programs in universities in Thailand Annals of Library and Information Studies, 49(3), 107-112 https://azpdf.net/document/zwvwmoog-changing-facets-library-instruction-programs-universities-thailand.html.
, (2008) Examining the effects of information system characteristics and perceived usefulness on post adoption usage of information systems Information & Management, 45(6), 376-386 https://doi.org/10.1016/j.im.2008.06.002.
(1997) A respecification and extension of the DeLone and McLean model of IS success Information Systems Research, 8(3), 240-253 https://doi.org/10.1287/isre.8.3.240.
, (2019) Factors affecting the intention to adopt m-learning International Business Research, 12(2), 150-164 https://doi.org/10.5539/ibr.v12n2p150.
, , (2011) Usage and acceptability of e‐resources in National Dairy Research Institute (NDRI) and National Bureau of Animal Genetic Resources (NBAGR), India Electronic Library, 29(6), 803-816 https://doi.org/10.1108/02640471111188024.
, (2011) Applying the technology acceptance model to Iranian engineering faculty libraries Electronic Library, 29(3), 367-378 https://doi.org/10.1108/02640471111141106.
(2020) Analysis of library website users' behavior to optimize virtual information and library services Journal of Information Science Theory and Practice, 8(1), 45-55 https://doi.org/10.1633/JISTaP.2020.8.1.4.
, , (2019) Evaluating the usability of the information architecture of academic library websites Library Hi Tech, 37(3), 566-590 https://doi.org/10.1108/LHT-07-2017-0151.
, , , (2020) Developing a model to identify the antecedents and consequences of user satisfaction with digital libraries Aslib Journal of Information Management, 72(6), 979-997 https://doi.org/10.1108/AJIM-04-2020-0099.
, , (2002) The relationship between service quality and customer satisfaction - A factor specific approach Journal of Services Marketing, 16(4), 363-379 https://doi.org/10.1108/08876040210433248.
, (2021) User satisfaction survey of university library websites in Myanmar Journal of Innovative Science and Research Technology, 6(9), 944-955 https://www.ijisrt.com/user-satisfaction-survey-of-university-library-websites-in-myanmar.
, , (2002) Understanding user acceptance of digital libraries: What are the roles of interface characteristics, organizational context, and individual differences? International Journal of Human-Computer Studies, 57(3), 215-242 https://doi.org/10.1016/S1071-5819(02)91024-4.
(2021a) Essential factors for developing private bank trust in Myanmar Thailand and the World Economy, 39(3), 31-56 https://so05.tci-thaijo.org/index.php/TER/article/view/255282.
(2021b) Prerequisites and perceived information system qualities model for mobile banking adoption among the customers of private commercial banks in Myanmar Journal of ASEAN Studies, 9(1), 49-71 https://doi.org/10.21512/jas.v9i1.6899.
, , , (2021) The influence of public university library service quality and library brand image on user loyalty International Review on Public and Nonprofit Marketing, 18(2), 207-227 https://doi.org/10.1007/s12208-020-00269-w.
, (2008) Technology acceptance model 3 and a research agenda on interventions Decision Sciences, 39(2), 273-315 https://doi.org/10.1111/j.1540-5915.2008.00192.x.
, (2005) A theoretical integration of user satisfaction and technology acceptance Information Systems Research, 16(1), 85-102 https://doi.org/10.1287/isre.1050.0042.
, , (2010) The role of the academic reference librarian in the learning commons Reference & User Services Quarterly, 50(2), 108-113 https://digitalcommons.unl.edu/libraryscience/221.
, (2018) Factors influencing users' satisfaction and loyalty to digital libraries in Chinese universities Computers in Human Behavior, 83, 64-72 https://doi.org/10.1016/j.chb.2018.01.029.
, , (2018) Determinants of web-user satisfaction: Using technology acceptance model MATEC Web of Conferences, 248, 05009 https://doi.org/10.1051/matecconf/201824805009.
, (2016) Improving relations between users and libraries: A survey of Chinese academic libraries Electronic Library, 34(4), 597-616 https://doi.org/10.1108/EL-03-2015-0041.
(2014) Understanding continuance usage intention of mobile internet sites Universal Access in the Information Society, 13(3), 329-337 https://doi.org/10.1007/s10209-013-0313-4.
, (2003) Measuring IS user satisfaction: Review and implications Communications of the Association for Information Systems, 12, 81-103 https://doi.org/10.17705/1CAIS.01205.
- 투고일Submission Date
- 2023-10-16
- 수정일Revised Date
- 2023-12-12
- 게재확정일Accepted Date
- 2023-12-12
- 다운로드 수
- 조회수
- 0KCI 피인용수
- 0WOS 피인용수