- P-ISSN2287-9099
- E-ISSN2287-4577
- SCOPUS, KCI

Enhancing QA System Evaluation: An In-Depth Analysis of Metrics and Model-Specific Behaviors

Aluko Ademola (Department of Library Information Science, Kyungpook National University, Daegu, Korea)

Abstract
The purpose of this study is to examine how evaluation metrics influence the perception and performance of question answering (QA) systems, particularly focusing on their effectiveness in QA tasks. We compare four different models: BERT, BioBERT, Bio-ClinicalBERT, and RoBERTa, utilizing ten EPIC-QA questions to assess each model’s answer extraction performance. The analysis employs both semantic and lexical metrics. The outcomes reveal clear model-specific behaviors: Bio-ClinicalBERT initially identified irrelevant phrases before focusing on relevant information, whereas BERT and BioBERT continually converge on similar answers, exhibiting a high degree of similarity. RoBERTa, on the other hand, demonstrates effective use of long-range dependencies in text. Semantic metrics outperform lexical metrics, with BERTScore attaining the maximum accuracy (0.97), highlighting the significance of semantic evaluation. Our findings indicate that the choice of evaluation metrics significantly influences the perceived efficacy of models, suggesting that semantic metrics offer more nuanced and insightful assessments of QA system performance. This study contributes to the field of natural language processing and machine learning by providing guidelines for selecting evaluation metrics that align with the strengths and weaknesses of various QA approaches.
- keywords
- question answering systems, evaluation metrics, natural language processing, transformer models, BERT
1. INTRODUCTION
The goal of natural language processing (NLP), a field within computer science and artificial intelligence, is to bridge the gap between humans and machines by enabling the latter to comprehend, interpret, and produce human language. In today’s data-driven world, NLP is essential due to the massive volumes of natural language data generated through chat logs, emails, and social media platforms. NLP is widely used in many fields, such as machine translation, speech recognition, named entity recognition, sentiment analysis, and question answering (QA). GPT-4, a potent language model, outperforms its predecessor, GPT-3, according to Baktash and Dawodi (2023). While GPT-4 offers numerous potential applications, it also presents drawbacks, including significant data and computational requirements, as well as ethical considerations.
1.1. Question Answering System
The goal of QA is to build automated systems that can understand natural language questions and provide accurate and concise answers. QA systems work by analyzing a user’s question and then searching for relevant information in a given knowledge base, such as a database, a collection of documents, or the Internet. Unanue et al. (2021) analyze a QA system using the BERTScore metric. When fine-tuning a strong baseline, experiments conducted over four diverse language pairs yielded improvements of up to 0.58 percentage points (3.28%) in the Bilingual Evaluation Understudy (BLEU) score and up to 0.76 percentage points (0.98%) in the BERTScore. Three approaches were proposed for generating soft predictions that allow the network to remain completely differentiable end-to-end.
In order to assess QA systems, this research examines how several metrics—such as Accuracy, Precision, Recall, F1 Score, Metric for Evaluation of Translation with Explicit ORdering (METEOR), and BERTScore—affect system performance. The study aims to improve the accuracy and reliability of QA systems, specifically deep learning models such as bidirectional encoder representations from transformers (BERT), biomedical language representation model (BioBERT), Bio-ClinicalBERT, and RoBERTa. This analysis is conducted using the epidemic question answering (EPIC-QA) text analysis conference (TAC) 2020 dataset, a benchmark dataset commonly used for evaluating the performance of these models, as demonstrated by their success on benchmarks like SQuAD (see more details at https://bionlp.nlm.nih.gov/epic_qa/).
1.2. Objectives
The primary aim of this study is to explore how various evaluation metrics impact the assessment of QA systems. Specifically, it seeks to address the following objectives: to identify how different evaluation metrics affect the perception of the strengths and weaknesses of QA systems, and to determine the most effective metrics for evaluating QA systems by comparing lexical and semantic metrics.
2. LITERATURE REVIEW
2.1. Performance Assessment Metrics for QA Systems
Metrics for automatic assessment are vital instruments for evaluating QA system performance. These metrics aid in the quantitative measurement of how well these systems perform in terms of delivering efficient and accurate responses when compared to the ground truth. Raza et al. (2022) used two datasets in this work: a reference-standard dataset built using the CORD-19 and LitCOVID initiatives, and a gold-standard dataset prepared by the experts from a public health domain, to assess their QA system, CoQUAD, using both lexical and semantic answer similarities. According to their research, the retrieval pipeline performs better when the top@k is increased, resulting in 83.6% recall in the top 20 out of the eight metrics used to assess the QA system. A variety of criteria are used to assess the efficacy of QA systems to precisely gauge performance. Research has explored numerous methods for improving these assessments. For example, Deutsch et al. (2021) presented a QA evaluation during the 2020 TAC for COVID-19 questions using normalized discount cumulative gain (NDCG) and normalized discount novel score (NDNS). The efficacy of NDNS was demonstrated by the HLTRI and h2oloo teams, achieving Exact scores of 0.371 and 0.368, respectively.
2.2. Evaluation Metrics
Different components of performance in QA are measured using lexical metrics and semantic similarity. While semantic similarities evaluate underlying meaning and context, lexical metrics concentrate on text features like word overlap. Both are beneficial and require specific methods. Bowman and Dahl (2021) discuss the present benchmarking procedures for natural language understanding, contending that these practices are problematic and do not provide an adequate evaluation of linguistic aptitude. They put forth four essential requirements for benchmarks to be responsible and effective: (1) Adversarial Filtering: The conventional method used to gather benchmark datasets is questioned since it might not fully reflect language comprehension; (2) Direct Addressing of Criteria: The main parameters used to gauge language comprehension should be specifically addressed by benchmarks; (3) Expert Integration: The integration of expert effort into crowdsourced data collection is crucial for improving the quality of benchmarks; and (4) Institutional Model: Establishing a clear institutional model to address bias in metrics is identified as an open research question.
2.2.1. Lexical Metrics
Lexical metrics are based on surface-level features of text, such as word frequency, length, and grammatical structures. North et al. (2023), in their review of computational methods for lexical complexity prediction in English texts, emphasized the application of machine learning techniques and various features to identify complex terms and suggest simpler alternatives. They also highlighted the use of lexical complexity prediction in readability and text simplification. These metrics help assess how well the language used in the prediction response compares to the reference summary in terms of similarities, relevance, and appropriateness.
Consider the following scenario to answer the question “What are the symptoms of COVID-19?”: The prediction answer correctly names fever, coughing, and dyspnea as the three primary COVID-19 symptoms. However, it does not address other common symptoms such as muscle aches, fatigue, loss of taste or smell, and sore throat. While the response includes some significant symptoms, it needs to be expanded for increased accuracy. The reference summary provides basic information but lacks crucial details. Lexical metrics offer quantitative insights into how well the prediction answer conveys the essential details and significance of the reference summary, indicating areas where the prediction model needs improvement. These measurements mainly emphasize factors like word overlap, term frequency, and structural similarity. This study will use several criteria to assess the lexical quality of QA systems, including ROUGE, F1 Score, exact match (EM), and Accuracy. By using these lexical metrics, we aim to assess how well QA systems capture the essential information and language patterns of the reference answers.
2.2.1.1. ROUGE.
ROUGE metrics evaluate the quality of QA systems by comparing generated responses against human-written ones and calculating the overlap between predicted and ground truth answers. Yang et al. (2018) assessed a QA system designed to respond to factoid queries using ROUGE metrics. Their research indicated that their modifications of ROUGE measurements had a stronger alignment with human judgment compared to the original ROUGE-L. For QA, the most widely utilized ROUGE metrics are ROUGE-1, ROUGE-2, and ROUGE-L.
2.2.1.1.1. ROUGE-1.
ROUGE-1 measures the overlap of unigrams (single words) between a system-generated answer and a set of reference answers.
For example, given the reference answer: “The cat sat on the mat” and the system-generated answer: “The cat on the rug,” the overlapping unigrams are “The,” “cat,” and “on.” The total unigrams in the reference answer are 6 (as “sat,” “the,” and “mat” are not present in the system-generated answer). Therefore . Through the evaluation of word overlap, these metrics assist in quantifying the degree to which the prediction accurately captures the important information from the reference answer.
2.2.1.1.2. ROUGE 2.
ROUGE-2 measures bigram overlaps by counting the number of consecutive word pairs that match between the reference and prediction. This aids in assessing the coherence and fluency of responses produced by the system.
For example, given the reference answer: “The cat sat on the mat” and the system-generated answer: “The cat on the rug,” the overlapping bigrams are “The cat” and “on the.” The total number of bigrams in the reference answers is 5 (as “The cat,” “cat sat,” “sat on,” “on the,” and “the mat”). Therefore, . Because word order is important for preserving textual meaning and flow in QA systems, ROUGE-2 offers a more rigorous evaluation than ROUGE-1.
2.2.1.1.3. ROUGE L.
ROUGE-L calculates the longest common subsequence (LCS) between a collection of reference answer(s) and an answer generated by the system. In contrast to ROUGE-1 and ROUGE-2, which assess word or bigram overlap, ROUGE-L accounts for sentence structure and word order by capturing the longest sequence of words that appear in both the system-generated and reference answers in the same order.
Where: X is the system-generated answer, Y is the set of reference answers, and LCS(X,Y) is the length of the LCS between X and Y. m is the length of the reference answer (or the average length if multiple references are used).
For example, given the reference answer: “The cat sat on the mat” and the system-generated answer: “The cat on the rug,” and LCS: “The cat sat on the,” length of reference (m) is 6. Therefore, .
2.2.1.2. F1 Score.
Question-answering systems are frequently assessed using the F1 Score. This is determined by examining the precision and recall of the system’s predictions. D’Hoffschmidt et al. (2020) created the French QA dataset FQuAD using 25,000 question-answer pairs from Wikipedia. A baseline model achieved 82.1 EM and 92.2 F1 Scores on the test set. The F1 Score is calculated as follows:
For example, given a reference answer with 10 correct answers and a system-generated answer with 8 answers (6 of which are correct), the , and . Therefore, .
2.2.1.3. Accuracy.
Accuracy measures the proportion of correct answers generated by a QA system out of all the answers it produced.
For example, given a reference set of 10 questions, each with a single correct answer, and a system-generated set of 10 answers, 8 of which are correct, the .
2.2.1.4. Exact Match.
EM is the percentage of questions where the system-generated response precisely matches one of the reference solutions, character by character. Wang et al. (2022) created a framework to assess the reading comprehension skills of machines. The assessment is easy to grasp and takes into account several factors. Tests demonstrate the approach’s significant improvement, showing increases in EM and F1 Scores on MRC tasks of up to 11.22% and 8.71%, respectively.
For example, given the question “What is the capital of France?,” with the reference answer [Paris] and the system-generated answer [Paris], the EM score is 1 (perfect match). In another example, given the question “What is the tallest mountain in the world?,” with the reference answer [Mount Everest] and the system-generated answer [Alps], the EM score is 0 (no EM).
2.2.2. Semantic Answer Similarities Metrics
Metrics for semantic similarity assess how closely the meanings of the system-generated responses match those of the reference answers. Herbold (2024) devised the STSScore method, which uses an optimized model to directly estimate semantic similarity between texts. They discovered that STSScore performs better than conventional techniques based on embeddings or subsequence overlap. A common approach in COVID-19 QA systems is to find the cosine similarity between a question and potential answers, both represented as vector embeddings.
For example, given the question “What are the symptoms of COVID-19?,” the system-generated prediction is “COVID-19 symptoms include fever, cough, and difficulty breathing,” while the reference summary is “COVID-19 is a virus that can cause severe respiratory illness.”
Using a pre-trained language model, these statements can be represented as vectors. It is then possible to determine the cosine similarity between each answer vector and the question vector. Amur et al. (2023)’s review of short-text semantic similarity demonstrates the potential of deep learning. They surveyed datasets and noted shortcomings in conventional techniques. The response with the highest cosine similarity is considered to be more semantically comparable to the query. Metrics such as BERTScore, Bi-Encoder, Cross-Encoder, and METEOR are important indicators of semantic similarity. However, BERTScore and METEOR are the main focus of our investigation.
2.2.2.1. BERTScore.
BERTScore is a metric used for evaluating the similarity between two pieces of text, typically in the context of NLP tasks such as QA. It is based on the BERT model, a neural network model used for language representation. Zhang et al. (2020) propose BERTScore as an automatic evaluation metric for text generation, similar to common metrics, by calculating a similarity rating for each token in the candidate sentence relative to every word in the reference sentence. They assessed the outputs of 363 machine translation and image captioning systems using BERTScore, which showed a stronger correlation with human evaluation and outperformed existing evaluation metrics in selecting the best model. Chen and Eger (2023) introduce new evaluation metrics based on natural language inference (NLI) to address vulnerabilities in BERT-based metrics that are susceptible to adversarial attacks. These NLI-based metrics demonstrate greater robustness and outperform existing summarization metrics, though they still fall below the state-of-the-art for machine translation. Combining NLI metrics with existing ones enhances both adversarial robustness and performance on standard benchmarks. Precision and recall are combined to compute an F1 measure in this context.
For a reference x and candidate , the Recall, Precision, and F1 Scores are defined as follows:
Recall: This measures the proportion of relevant tokens in the reference sentence that are also present in the candidate sentence. A high recall score indicates that the generated sentence covers most of the semantic content of the reference sentence. The recall is calculated as follows:
Precision: This measures the proportion of relevant tokens in the candidate sentence that are also present in the reference sentence. A high precision score indicates that most of the generated tokens are semantically similar to the reference tokens. The calculation is shown below:
F1 measure: This is the harmonic mean of precision and recall. It provides a balanced measure of the accuracy of the generated sentence, taking into account both the semantic similarity of the generated tokens and how well the generated sentence covers the content of the reference sentence. See below on how it is calculated:
2.2.2.2. METEOR.
METEOR is widely used in NLP for evaluating language translation and QA tasks by comparing generated responses to reference answers, scoring based on their similarity and overall quality. Soni and Roberts (2022) proposed a method for generating clinical question variations based on EHRs. Results showed METEOR outperformed BLEU in paraphrase detection, with METEOR scoring 21.27 and BLEU 13.25. METEOR uses lexical matching, stemming, and synonymy to assess overlap between answers, considering word order, phrasing, and grammar. It adjusts its formula to account for tokenization and alignment with reference answers. METEOR balances precision and recall, incorporating factors like EM, stems, synonyms, and paraphrases. This approach allows METEOR to recognize different ways of expressing the same idea, making it more robust in handling language variations. One of METEOR’s key advantages is its strong correlation with human judgment, as it evaluates both the accuracy and completeness of a translation. Its flexibility across languages and domains, along with its customizability, makes it valuable for various NLP applications beyond machine translation, such as text summarization and paraphrase detection.
The formula for METEOR is as follows:
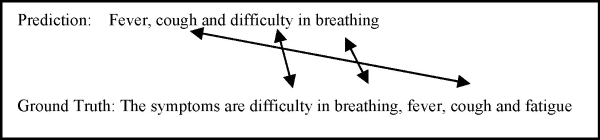
The information above shows there are lexical similarities between the prediction and the ground truth and the demonstrates that METEOR also captures semantic similarity when evaluating QA. Computing the overall METEOR score combines the F-score computed from precision and recall.
2.3. Transformers Model (Baseline Approach)
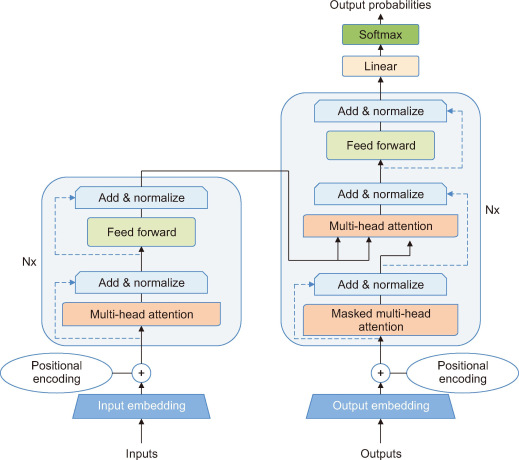
NLP has evolved tremendously with the introduction of the Transformer model by Vaswani et al. (2017), especially for QA tasks. This deep learning model functions through an encoder-decoder architecture. The encoder processes the input sequence (such as a question) to create hidden representations that capture the context and meaning of each token. The decoder then uses these representations to generate the output sequence, which includes the answer. Our research employs four distinct Transformer model iterations: BERT, BioBERT, Bio-ClinicalBERT, and RoBERTa. Each model was selected based on its specific strengths and performance in handling biomedical text and QA tasks (Fig. 1).
2.3.1. Bidirectional Encoder Representations from Transformers (BERT)
BERT is a transformer-based approach created specifically for language understanding applications. Unlike the original Transformer model, BERT is trained bidirectionally, meaning it simultaneously considers context from both the left and right sides of a word. This bidirectional training allows BERT to more effectively grasp complex relationships and nuanced meanings of words. Alzubi et al. (2023) recommended DistilBERT, a faster and lighter version of BERT, for COVID-19 queries. After being fine-tuned using the SQuAD 1.1 dataset, DistilBERT outperformed earlier models, achieving an F1 Score of 87.3 and an EM score of 80.6.
2.3.2. Biomedical Language Representation Model (BioBERT)
BioBERT, based on BERT, is a specialized model for the biomedical domain, pre-trained on biomedical texts and fine-tuned for tasks including QA, named entity recognition, and relation extraction, outperforming other models. An investigation by Campos-Mercade et al. (2021) assessed various language models for QA related to COVID-19, revealing that BioBERT outperformed other models, particularly in tasks involving the filtering of sentences based on their relevance. In this research, we utilize the BioBERT model developed by the Data Mining and Information Systems Laboratory at Korea University, specifically designed for NLP tasks in the biomedical domain.
2.3.3. Bio-ClinicalBERT
Bio-ClinicalBERT, a BERT-based model pre-trained on biomedical literature, performs exceptionally well in QA challenges such as the BioASQ Challenge. This study improved Bio-ClinicalBERT’s performance for specific tasks on the EPIC dataset by experimenting with different embeddings. Alsentzer et al. (2019) demonstrated that employing a model customized for the medical domain and developing embeddings with ClinicalBERT, a variation of Bio-ClinicalBERT, yields better results than non-domain-specific embeddings in three common clinical NLP tasks. In this study, the “emilyalsentzer/Bio_ClinicalBERT” model was employed to extract answers from the provided context.
2.3.4. RoBERTa
RoBERTa is a pre-trained language model built on the Transformer architecture, similar to BERT but with several significant enhancements to the training process. These improvements include dynamic masking and the elimination of the next sentence prediction task, both of which lead to stronger language comprehension. RoBERTa has been trained on a large corpus of text data to gain a thorough understanding of linguistic structures and patterns. Möller et al. (2020) significantly improved performance by fine-tuning a pre-trained RoBERTa model using the SQuAD and COVID-QA datasets, a QA dataset consisting of 2,019 question/answer pairs annotated by volunteer biomedical experts on scientific articles related to COVID-19. In this project, the RoBERTa model will be used to extract answers, leveraging its strong language understanding capabilities through a two-stage QA process (pre-training and fine-tuning).
3. RESEARCH DESIGN
3.1. Data Collections
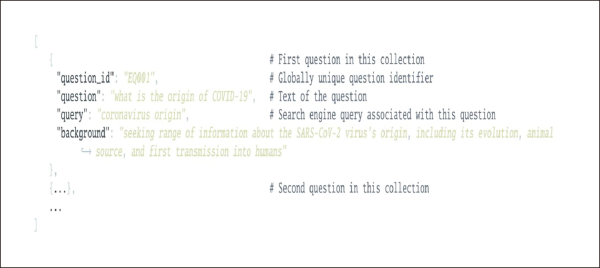
This study uses the EPIC-QA dataset to assess the performance of various QA models in a specific domain. EPIC-QA focuses on ad-hoc questions related to diseases, with a specific emphasis on COVID-19, aligning with our research goal of analyzing QA models in a biomedical context. However, we acknowledge that the EPIC-QA dataset may not fully capture the entire range of QA system requirements. EPIC-QA delves deeper than generic QA datasets like SQuAD or MovieQA, which typically address factual information retrieval. The dataset is divided into two categories: Expert Level, designed to address questions relevant to professionals in the field, and Consumer Level, focused on answering questions posed by the general public. This study will concentrate on the Consumer QA subset, which pertains to the general public’s inquiries about COVID-19 (Fig. 2).
3.2. Dataset Analysis
As part of the TAC, Goodwin et al. (2020) from U.S. National Library of Medicine launched the EPIC-QA track. The goal of this track was to further the study of automated question-answering systems, particularly those that deal with COVID-19. Creating systems that could modify their responses for various user groups, including specialists and the general public, was the main goal. To train and assess their systems, participants were given access to a variety of datasets, such as scholarly publications and easier-to-access information sources. The dataset analysis involves the following key sources: Ask-Science, which consists of 263 JSON files, each representing a post made between December 1, 2019, and October 29, 2020, in the /r/AskScience community on Reddit. These posts, tagged by community moderators, relate to COVID-19, health, medicine, or biology, and include one or more COVID-19 keywords. CCNS-TREC contains 114,645 JSON files, each corresponding to an HTML-parsed website included in the CommonCrawl News Subset used by the TREC Misinformation Track. These files contain one or more COVID-19 keywords. CHQA comprises 2,739 JSON files, corresponding to an October 9, 2020 HTML-parsed snapshot of web pages affiliated with the NIH, CDC, or WHO that contain COVID-19 keywords. To ensure a balanced and representative dataset for our ten questions, we sampled a subset of documents from each dataset. The final dataset used for analysis consisted of ten documents, including three from Ask-Science, three from CCNS-TREC, and four from CHQA.
3.3. Dataset Structure
The EPIC-QA dataset comprises two separate collections: answer extraction and end-to-end tasks. The dataset is well-structured and easily accessible for research, as each document in these collections is organized as a separate JSON file.
3.4. Structure of Context, Question, and Answer in QA
A QA system’s goal is to produce a response to a specified inquiry based on a written passage. Contextualization is important because it establishes the framework for both the query and the response. This context may include historical background, relevant data, and other details that help the reader fully understand the issue at hand. Raza et al. (2022) used a COVID-19 QA dataset to illustrate an extractive QA system. This system takes a query as input and generates an answer by extracting relevant information from a given context. For example, the question “How long after you get exposed to the COVID-19 virus is a test able to detect?” is addressed with the following context: “The timing of when a COVID-19 test can detect the virus after exposure depends on several factors, such as the type of test used, the viral load in the body, and the individual’s immune response. Generally, it can take between 2 to 14 days after exposure for a COVID-19 test to detect the virus in the body.” The system generates the answer: “It can take between 2 to 14 days after exposure to COVID-19 for a test to detect the virus in the body.”
3.5. Procedures
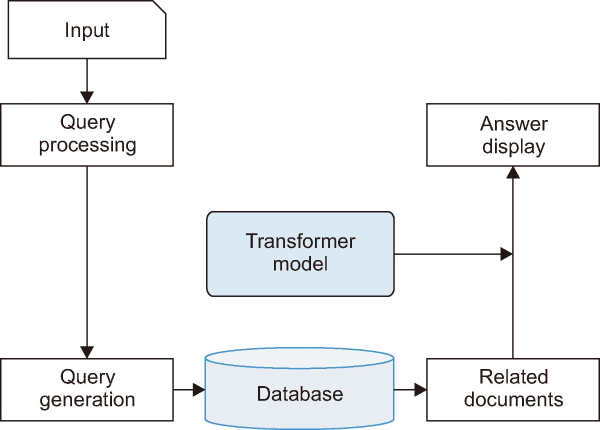
The QA system will be implemented using selected QA approaches, designed to dynamically generate answers to user queries by extracting information from a dataset, rather than relying on pre-stored answers in a database (Fig. 3).
3.5.1. Step 1: Data Loading
The process begins by loading relevant documents from the dataset that corresponds to the user’s query. This is accomplished using a data loading library, such as PyTorch’s DataLoader, which efficiently handles the dataset and ensures that only relevant documents are passed into the QA system.
3.5.2. Step 2: Data Retrieval
Data retrieval is a crucial component of the QA process, essential for extracting relevant information from a corpus. Efficient and successful information retrieval is increasingly important in the era of big data, where vast amounts of data are generated daily. Several retrieval strategies are employed. Lexical Search (BM25) is a traditional approach based on keyword matching and term frequency. Semantic Search, on the other hand, uses more advanced techniques such as Dense Passage Retriever, Bi-Encoder, and Cross-Encoder, which leverage deep learning to understand the context and meaning behind words. Given the nature of this study and the structure of the EPIC-QA dataset, it will be necessary to integrate the retriever model with the reader model to accurately extract relevant answers.
3.5.3. Step 3: Answer Extraction (Reader Model)
The reader model is the last stage of the QA process. Its job is to comprehend the text and extract relevant information in order to provide a response. To respond, the reader divides the question into different portions, searches for essential words and phrases, and compares them to pertinent areas in the dataset. Responses are sent back to users once the reader determines the correct answer.
3.5.4. Step 4: Problem Formulation
The problem investigated in this research can be characterized as follows: The input question sequence (q) is represented as q=[q0, q1, q2, …, qn], where q0 through qn represent the individual tokens in the input question. The input context or passage sequence (p) is represented as p=[p0, p1, p2, …, pn], where p0 through pn represent the individual tokens in the context or passage from which the answer is to be extracted. The similarity function (S), denoted as S(q, p), measures the relevance of each token in the passage to the question. This function takes into account the contextual information of the tokens and is learned during the training process. Softmax is a normalization function that converts the relevance scores produced by S(q, p) into probabilities. Finally, argmax is a function that selects the token in the passage with the highest probability as the answer. These components work together in the QA system to identify and extract the most relevant answer from the context provided.
3.6. Dataset Preprocessing
A thorough preprocessing workflow was applied to the dataset to ensure the efficacy of our QA model. The aim of this preprocessing was to standardize and purify the data, preparing it for training and assessment. During the data processing phase, several procedures were followed to prepare the text for analysis. First, the data was cleaned by removing HTML tags and special characters. Tokenization and lemmatization were then applied to standardize and reduce dimensionality. Stopwords were removed to emphasize more informative keywords. The dataset was divided into training, validation, and test sets to provide a fair and diverse assessment of the model. Finally, text sequences were encoded using BERT embeddings and padded to a constant sequence length to optimize batch processing during model training.
3.7. Experimental Setup
The experimental setup was designed to leverage state-of-the-art machine learning algorithms and hardware acceleration to achieve high accuracy in QA tasks. The desktop computer used was a high-performance device equipped with a robust CPU, GPU, and Coral USB accelerator, providing all the necessary hardware for efficient model training and inference. Python was used to implement TensorFlow 2.4.0 in Google Colab. The pre-trained models BERT, BioBERT, Bio-ClinicalBERT, and RoBERTa were selected for their capacity in quality assurance. The model’s performance was evaluated using metrics including ROUGE, Accuracy, EM, and F1 Score.
3.7.1. Experimental Procedure
We conducted a comparative analysis of four pre-trained language models from the Transformers library—BERT, BioBERT, Bio-ClinicalBERT, and RoBERTa—targeted at QA tasks across three distinct domains: general, biomedical, and clinical.
3.7.2. Dataset and Preprocessing
We used a text analysis dataset specifically selected for the biomedical field to train these models. Preprocessing techniques were applied to the dataset to ensure the data was relevant and properly formatted for the QA tasks. These techniques included filtering out unnecessary information and applying sentence segmentation.
3.7.3. Model Fine-Tuning
Each model was fine-tuned on its respective training dataset using the AdamW optimizer. The fine-tuning process was configured with the following hyperparameters: a learning rate of 2e-5, a batch size of 32, and 5 epochs. To prevent overfitting, we implemented early stopping by monitoring the loss function, and training was halted if the loss did not improve for three consecutive epochs.
3.7.4. Evaluation Metrics
The performance of the models was evaluated using a combination of metrics that assessed accuracy, fluency, and semantic similarity. The F1 Score and Accuracy metrics measured the model’s ability to correctly identify the correct answers, providing insights into precision and recall. The ROUGE-L Score was used to evaluate the overlap between the generated answers and the reference answers, focusing on the LCS to assess the quality of the generated text. The METEOR Score assessed the fluency and semantic coherence of the generated answers, taking into account synonyms, stemming, and word order. Lastly, BERTScore measured the contextual and syntactic similarity between the generated and reference answers, leveraging pre-trained BERT embeddings to evaluate the depth of understanding.
3.8. List of Questions
This section presents sample questions that showcase the QA system’s ability to handle various COVID-19 inquiries. Although the number of questions in this experimental study is relatively small, they cover a range of topics, from infection rates to prevention.
1. Who can contract COVID-19?
2. Why are COVID-19 infection rates so low in Africa?
3. How do we prevent contracting COVID-19?
4. Is COVID-19 transmissible through mosquitos?
5. What makes some viruses seasonal?
6. When exactly do people during the illness start producing antibodies for COVID-19?
7. Which symptoms are commonly association with COVID-19?
8. Where should I go if I suspect I have symptoms?
9. Are children less susceptible to COVID-19 compared to adults?
10. What is the impact of COVID-19 on mental health?
4. RESULTS AND DISCUSSION
We used ten questions from the EPIC-QA dataset to assess four pre-trained language models—BERT, BioBERT, Bio-ClinicalBERT, and RoBERTa—due to our dataset’s domain-specific nature. Metrics appropriate for biomedical writing, such as the F1 Score, ROUGE, METEOR, and BERTScore, evaluated how well they handled language peculiar to the field. Notably, all models produced EM and accuracy metrics of zero, which is why they were excluded from the displayed results. Pal (2023) introduced CLIFT, a new benchmark for clinical domain QA, and discovered that while deep learning models exhibit strong performance on initial test sets, their performance may deteriorate when exposed to distributional changes.
This outcome emphasizes the need for more reliable models and assessment metrics in the clinical domain. These results suggest that these metrics were not properly aligned with the significance of addressing biomedical questions in this context.
4.1. Results of F1 Score
BERT and BioBERT achieved moderate F1 Scores of 67%, demonstrating their ability to answer both general and biomedical questions, highlighting their considerable QA capabilities. RoBERTa, with an F1 Score of 33%, may require additional fine-tuning, while Bio-ClinicalBERT, scoring 48%, shows specialization in clinical contexts. The F1 Score analysis offers a comprehensive understanding of each model’s relative strengths and weaknesses in biomedical QA (Table 1).
Table 1
The results of F1 Score
| Model name | Result (%) |
|---|---|
| BERT | 67 |
| BioBERT | 67 |
| Bio-ClinicalBERT | 48 |
| RoBERTa | 33 |
4.2. Results of ROUGE
BERT and BioBERT exhibit better response alignment with the ground truth, as evidenced by their respective ROUGE scores of 67%, indicating significant n-gram overlap and accuracy. Bio-ClinicalBERT and RoBERTa achieve 65% ROUGE scores, closely pursuing high alignment while having slightly different vocabulary and detail than BERT and BioBERT. In terms of obtaining significant factual components, BERT and BioBERT perform better than Bio-ClinicalBERT and RoBERTa, which show similar but considerably lower accuracy (Table 2).
Table 2
The results of ROUGE
| Model name | Result (%) |
|---|---|
| BERT | 67 |
| BioBERT | 67 |
| Bio-ClinicalBERT | 65 |
| RoBERTa | 65 |
4.3. Results of METEOR
The METEOR scores reveal that RoBERTa leads with 85%, indicating it generates the most fluent and coherent answers closely aligned with the ground truth. BioBERT follows at 82%, showing strong semantic similarity and relevance. Bio-ClinicalBERT scores 81%, reflecting robust domain understanding, while BERT, at 79%, slightly trails in conveying the intended meaning. Overall, these scores underscore each model’s capability in producing meaningful and coherent responses, with RoBERTa excelling in fluency (Table 3).
Table 3
The results of METEOR
| Model name | Result (%) |
|---|---|
| BERT | 79 |
| BioBERT | 82 |
| Bio-ClinicalBERT | 81 |
| RoBERTa | 85 |
4.4. Results of BERTScore
The BERTScore values show that BioBERT and Bio-ClinicalBERT achieved the highest scores (97%), demonstrating exceptional meaning and nuance matching with reference responses. BERT follows closely at 95%, indicating good semantic correctness. RoBERTa performs well with a score of 86%, though with some minor variations in finer aspects. Overall, BioBERT and Bio-ClinicalBERT excel at preserving semantic content, while BERT and RoBERTa demonstrate strong performance in capturing relevant information. The strong performance of RoBERTa in METEOR scores reflects its general effectiveness in NLP tasks, as discussed in various studies on transformer-based models. The exclusion of EM and Accuracy due to low scores is an important observation and may warrant further investigation into why these metrics performed poorly in this specific context (Table 4).
Table 4
The results of BERTScore
| Model name | Result (%) |
|---|---|
| BERT | 95 |
| BioBERT | 97 |
| Bio-ClinicalBERT | 97 |
| RoBERTa | 86 |
4.5. Maximum Scores of Each Metric
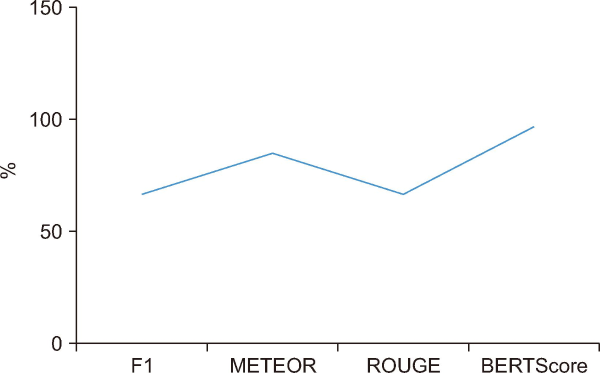
We evaluated QA models using BERTScore, METEOR, ROUGE, F1 Score, EM, and Accuracy. EM and Accuracy were excluded due to low scores. BERTScore achieved the highest at 97% with BioBERT and Bio-ClinicalBERT. METEOR reached 85% with RoBERTa, while F1 Score and ROUGE were 67% with BERT and BioBERT. These results highlight the relative strengths of each model across different evaluation metrics and provide a clearer picture of their effectiveness in answering questions (Fig. 4).
4.6. Evaluation Metrics and Answer Quality
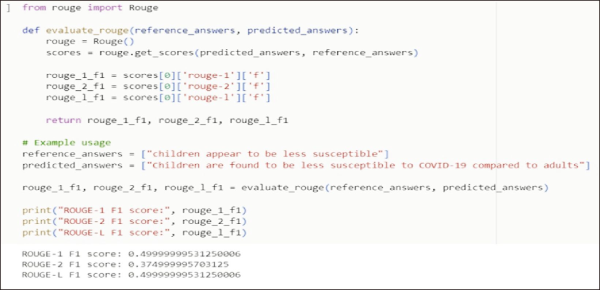
In this section, we analyze the relationship between evaluation metrics and the quality of answers produced by the QA systems, illustrated below by one of the examples generated by the QA model and metric used in this study (Fig. 5).
4.7. Overall Performance of the QA Models
The performance variance among the four QA models highlights their unique strengths and weaknesses in predicting answers. This section answers Research Question (RQ) 1. BERT and BioBERT demonstrated exceptional capabilities in identifying relevant phrases. Bio-ClinicalBERT’s reliance on contextual dependencies can lead to initial detection of irrelevant words, while RoBERTa’s ability to handle long sequences and extract information from large contexts enhances its QA performance.
Overall, these models represent significant advancements in language model capabilities for QA tasks, enabling automated systems to capture context, understand queries, and provide more accurate and contextually aware answers across various applications. Zaib et al. (2021) propose a framework that integrates conversation history into a neural machine comprehension system using BERT. Results show that the proposed framework performs competitively with state-of-the-art models. However, they also highlight the negative impact of using the entire conversation history, as it introduces noise and unnecessary information, reducing model performance.
This analysis aligns well with current research trends in QA systems, as seen in the provided search results. The comparison of different models’ strengths and weaknesses reflects the ongoing efforts to improve QA performance across various domains. The inclusion of Zaib et al. (2021)’s findings on conversation history integration adds valuable context to the challenges in developing more advanced QA systems.
4.8. Evaluation Metrics of the QA System
This study assessed the performance of BERT, BioBERT, Bio-ClinicalBERT, and RoBERTa models in predicting answers. The evaluation was conducted using lexical metrics such as F1 Score, EM, ROUGE, and Accuracy, as well as semantic metrics like METEOR and BERTScore. According to Turchin et al. (2023), biomedical BERT models—such as BioBERT and ClinicalBERT—perform better at recognizing complex medical concepts in medical documentation than standard BERT models. However, the ideal model selection may vary based on the specific task.
Semantic measures were found to perform better than lexical metrics, addressing RQ2. BERTScore was notable for obtaining the highest score of 0.97 for the BioBERT and Bio-ClinicalBERT models. This result suggests that BERTScore, as a semantic metric, performed better than the other metrics included in this study when evaluating the quality of the responses. METEOR proved to be a robust metric for QA model evaluation, scoring 0.85 and capturing semantic nuances such as paraphrases, as well as EM. Even though BERTScore sometimes outperformed METEOR, the latter remains reliable. The QA system’s accuracy and fluency are demonstrated by the ROUGE and F1 Scores of 0.67, which show a solid balance between precision and recall.
On the other hand, EM and Accuracy scores were low as they could not capture semantic equivalency. Models may perform poorly if their phrasing deviates from reference responses, even if the response is accurate and meaningful. To address these issues, the study employed more flexible and sophisticated assessment metrics, such as F1 Score, METEOR, and ROUGE. These metrics provide a comprehensive evaluation of the model’s performance in QA tasks, considering token-level matching and measuring the precision and semantic quality of the generated answers.
The comparison of lexical and semantic metrics, as well as the focus on BERTScore and METEOR, reflects the ongoing efforts to improve the evaluation of QA models in the biomedical domain.
4.8.1. Implications
The varying performance of the QA models emphasizes the importance of selecting the appropriate model for specific applications. For tasks requiring precise phrase identification, BERT or BioBERT may be more suitable, while RoBERTa’s ability to handle long and complex text could be advantageous in other contexts. Bio-ClinicalBERT’s performance highlights the need for ongoing research to improve the robustness and accuracy of QA models. Addressing these shortcomings could lead to significant advancements in the field. The implications of these findings extend beyond academic study and into real-world applications. RoBERTa’s ability to handle complex inputs could significantly enhance automated customer service by improving the model’s capacity to process extended and more varied customer queries. Similarly, BioBERT’s ability to accurately recognize medical terminology from patient records establishes it as a valuable asset in clinical decision support systems, potentially improving diagnostic accuracy and minimizing human error. As language models evolve, ongoing research to address the deficiencies of models like Bio-ClinicalBERT will be essential for enhancing QA systems across various industries.
4.8.2. Evaluation Metrics of the QA System
This study highlights a key issue: the difference between lexical and semantic metrics. Lexical metrics such as EM and Accuracy sometimes fail to account for semantic equivalence, penalizing models for minor variations in wording despite preserving meaning. This is particularly challenging in the biomedical domain, where nomenclature can differ substantially while representing the same context. As a result, models may receive low EM scores even when producing semantically accurate responses, underscoring the limitations of rigid lexical assessment in specialized tasks. Semantic metrics, such as BERTScore and METEOR, provide more flexibility by considering paraphrases. BERTScore showed exceptional performance for biomedical models (BioBERT, Bio-ClinicalBERT), effectively capturing semantic quality with a score of 0.97. METEOR demonstrated reliability for both paraphrases and precise matches, achieving a score of 0.85. These metrics offer a more nuanced assessment of QA models, particularly in complex domains like biomedical text, where understanding the intent and meaning of the question is crucial. While lexical measures are still useful for gauging fluency and accuracy, semantic metrics like METEOR and BERTScore are essential for evaluating the deeper quality of model responses, especially in specialized fields such as biomedicine. The results of this work support recent developments in the literature, such as Turchin et al. (2023), which highlight the importance of semantic equivalence over simple token matching and call for more sophisticated evaluation techniques.
5. CONCLUSION
In this study, we tested the effectiveness of various machine learning evaluation criteria to evaluate QA systems. The study by Bahak et al. (2023) evaluates ChatGPT’s performance as a QA system in comparison to other models. It finds that while ChatGPT, based on GPT-3.5 Turbo, performs well on straightforward factual queries, its reliability decreases when dealing with more complex queries and when contextual information is lacking.
To determine their effect on assessing model quality, we selected and applied a variety of measures, including lexical metrics (F1 Score, ROUGE, EM Accuracy), semantic and lexical metrics (METEOR), and semantic metrics (BERTScore). Our results showed that BERTScore is the best-performing metric for capturing similarity between prediction and ground-truth, based on contextual and grammatical nuances. METEOR also demonstrated strong performance, highlighting the importance of incorporating both semantic and lexical elements in QA assessment. F1 Score and ROUGE showed similar performance and provided valuable insights into the quality of the answers.
These measures are useful options for assessing QA systems as they cover important aspects of answer accuracy. EM and accuracy measurements did not perform well because they only consider word-level matching and ignore structure and contextual knowledge. This demonstrated their limitations by imposing penalties for even minor phrase modifications.
Since the efficacy of these metrics varies with different datasets and circumstances, alternative or supplementary evaluation approaches that consider context are necessary. Achieving accurate evaluation requires choosing metrics that align with the objectives and features of the QA system.
5.1. Limitations
While our study provides valuable insights into the performance of QA models, it is important to acknowledge the limitations of the research. Our results are not as broadly applicable as they could be due to the small sample size of ten questions taken from the EPIC-QA dataset. Expanding the dataset to include questions from different domains might be a consideration for future research to ensure more reliable results. Moreover, our analysis focused on four specific models and a limited set of evaluation metrics. Future studies in this area should examine a wider range of models and include more metrics that capture diverse facets of QA performance, such as those designed for scientific or medical domains.
According to Chen et al. (2021), extensive, complex documents and inquiries requiring in-depth expertise are frequently challenging for current QA approaches to address. The complexity of real-world document sets, which often contain large amounts of text and require in-depth expertise, was not explored in our study. Addressing this limitation will be crucial for developing QA systems that can successfully handle such difficult scenarios.
5.2. Future Study
Future research should emphasize integrating qualitative evaluations alongside quantitative metrics, to provide a more comprehensive understanding of QA system performance and user experience. We recommend increasing the sample size and exploring a wider range of models and metrics to capture various aspects of performance.
Furthermore, integrating knowledge bases and textual inference can greatly improve the efficiency of the system and the accuracy of the evaluation. By highlighting these qualitative dimensions, researchers can obtain a greater understanding of user interactions and contextual challenges that QA systems face. This approach is consistent with recent developments in the field, such as the integration of large language models and the exploration of multi-modal QA systems.
This comprehensive approach not only contributes to academic discourse but also informs practical applications, ensuring that QA systems are tailored to meet real-world needs and complexities.
REFERENCES
, , , , , , (2019) Publicly available clinical BERT embeddings arXiv, 1904.03323 https://doi.org/10.48550/arXiv.1904.03323.
, , , , (2023) COBERT: COVID-19 question answering system using BERT Arabian Journal for Science and Engineering, 48, 11003-11013 https://doi.org/10.1007/s13369-021-05810-5. Article Id (pmcid)
, , , , (2023) Short-text semantic similarity (STSS): Techniques, challenges and future perspectives Applied Sciences, 13, 3911 https://doi.org/10.3390/app13063911.
, , , (2023) Evaluating ChatGPT as a question answering system: A comprehensive analysis and comparison with existing models arXiv, 2312.07592 https://doi.org/10.48550/arXiv.2312.07592.
, (2023) GPT-4: A review on advancements and opportunities in natural language processing arXiv, 2305.03195 https://doi.org/10.48550/arXiv.2305.03195.
, (2021) What will it take to fix benchmarking in natural language understanding? arXiv, 2104.02145 https://doi.org/10.48550/arXiv.2104.02145.
, , , (2021) Prosociality predicts health behaviors during the COVID-19 pandemic Journal of Public Economics, 195, 104367 https://doi.org/10.1016/j.jpubeco.2021.104367. Article Id (pmcid)
, , , , , , , (2021) Reasoning in dialog: Improving response generation by context reading comprehension The Thirty-Fifth AAAI Conference on Artificial Intelligence (AAAI-21), 35, 12683-12691 https://doi.org/10.1609/aaai.v35i14.17502.
, (2023) MENLI: Robust evaluation metrics from natural language inference Transactions of the Association for Computational Linguistics, 11, 804-825 https://doi.org/10.1162/tacl_a_00576.
, , (2021) Towards question-answering as an automatic metric for evaluating the content quality of a summary Transactions of the Association for Computational Linguistics, 9, 774-789 https://doi.org/10.1162/tacl_a_00397.
, , , , (2020) FQuAD: French question answering dataset arXiv, 2002.06071 https://doi.org/10.48550/arXiv.2002.06071.
, , , , , , (2020) Epidemic question answering https://bionlp.nlm.nih.gov/epic_qa/
(2024) Semantic similarity prediction is better than other semantic similarity measures arXiv, 2309.12697 https://doi.org/10.48550/arXiv.2309.12697.
, , (2023) Lexical complexity prediction: An overview ACM Computing Surveys, 55, Article 179 https://doi.org/10.1145/3557885.
(2023) CLIFT: Analysing natural distribution shift on question answering models in clinical domain arXiv, 2310.13146 https://doi.org/10.48550/arXiv.2310.13146.
, , (2022) CoQUAD: A COVID-19 question answering dataset system, facilitating research, benchmarking, and practice BMC Bioinformatics, 23, 210 https://doi.org/10.1186/s12859-022-04751-6. Article Id (pmcid)
, , (2023) Comparison of BERT implementations for natural language processing of narrative medical documents Informatics in Medicine Unlocked, 36, 101139 https://doi.org/10.1016/j.imu.2022.101139.
, , (2021) BERTTune: Fine-tuning neural machine translation with BERTScore arXiv, 2106.02208 https://doi.org/10.48550/arXiv.2106.02208.
, , , , , (2022) Feeding what you need by understanding what you learned arXiv, 2203.02753 https://doi.org/10.48550/arXiv.2203.02753.
, , , , , , , , , (2018, July) Proceedings of the Workshop on Machine Reading for Question Answering Association for Computational Linguistics Adaptations of ROUGE and BLEU to better evaluate machine reading comprehension task, 98-104, https://doi.org/10.18653/v1/W18-2611
, , , , , , , , (2021) Proceedings of the Parallel Architectures, Algorithms and Programming. PAAP 2020 Communications in Computer and Information Science BERT-CoQAC: BERT-based conversational question answering in context, 47-57, https://doi.org/10.1007/978-981-16-0010-4_5
, , , , (2020) BERTScore: Evaluating text generation with BERT arXiv, 1904.09675 https://doi.org/10.48550/arXiv.1904.09675.
- Submission Date
- 2024-11-07
- Revised Date
- 2024-11-12
- Accepted Date
- 2024-11-17