- P-ISSN2287-9099
- E-ISSN2287-4577
- SCOPUS, KCI
 ISSN : 2287-9099
Article Contents
- 1. INTRODUCTION
- 2. THE SOCIAL LIVE-STREAMING SERVICES YOUNOW, PERISCOPE, AND USTREAM
- 3. RESEARCH MODEL AND RESEARCH QUESTIONS
- 4. CATEGORIZATION OF MOTIVES AND CONTENTS
- 5. METHODS
- 6. STREAMERS’ GENDER AND AGE
- 7. MOTIVATIONS OF STREAMERS AND THE CONTENTS OF THEIR STREAMS
- 8. STREAMING BEHAVIOR BY COUNTRY
- 9. STREAMING BEHAVIOR BY INFORMATION SERVICE
- 10. CONCLUSION
- Ack
- References
Streamer Motives and User-Generated Content on Social Live-Streaming Services


Abstract
Three most popular information services, Periscope, Ustream, and YouNow, vicarious for all Social Live-Streaming Services (SLSSs), are investigated to analyze their streamers’ motivations and the user-generated content. Additionally, we collected demographic data (gender and age). More than 7,500 streams by users from the U.S., Germany, and Japan were observed. Main streamer motivations on SLSSs are boredom, socializing, to reach a specific group, the need to communicate, and fun. Important content categories on all three SLSSs are chatting, sharing information, 24/7, and slice of life. We were able to identify differences between users from the U.S., Germany, and Japan as well as between the users of Periscope, Ustream, and YouNow. Main motive to stream is in the U.S. to reach a specific group, while in Japan it is socializing, and in Germany boredom. The top content category for both, YouNow as well as Periscope is to chat; on Ustream it is 24/7 (i.e., webcams).
- keywords
- Social Live-Streaming Services (SLSSs), Social Media, YouNow, Periscope, Ustream, Motivation, Content Analysis
1. INTRODUCTION
To stream or not to stream – that is the question plaguing the minds of people all over the globe. Ever since humanity discovered the wonders of social media it also became unnervingly aware of its most primal desire to share their lives with the world. Almost everybody with Internet access has a social media presence of any kind. It is therefore no surprise that web services like Facebook are what is widely associated with the Internet in everyday conversations. Whatever the occasion, be it something mundane like a trip to the local mall or maybe something a little more exciting like skydiving, today's Average Joe is in the comfortable position of becoming a perfect stranger's entertainment for the duration of a few minutes just by pressing a button and going live on the social live streaming platform of his choice. While some may stream for the fun of it or maybe in an attempt to tackle the boredom of everyday life, others are a bit more ambitious, aiming for huge audiences and loyal viewers, trying to become the next micro-celebrity. In order to find out just how diverse today's streamers and their preferred streaming services are both in content, motivation and demographics, a month was spent watching a multitude of broadcasts and analyzing not only them but also the people who produced them. You may be surprised by what difference not only a service but also a country makes. As per usual whenever you are sifting through the human psyche via social media, you may find that somewhere amidst fluffy kittens and people filming themselves while driving their car one-handedly, this newest trend of enabling potentially everybody to broadcast themselves wherever they want, whenever they want, will leave you amazed but also questioning your own as well as everyone else's sanity.
According to Scheibe, Fietkiewicz and Stock (2016), Social Live Streaming Services (SLSSs) are Social Networking Services (SNSs) which allow users to broadcast their own program in real-time by using either mobile devices or webcams. Since the audience is able to interact with the streamer as he or she is streaming, SLSSs are synchronous social media. On some platforms, the audience may reward the performers with, e.g., points, badges or money. There are general SLSSs (such as YouTube, Periscope and Ustream), specialized SLSSs (e.g. Twitch for gaming), and SLSSs which are embedded in other services (as Facebook Live and YouTube Live).
There is a huge amount of scientific literature on SLSSs in 2015 and especially in 2016. Here, we only want to mention some examples. SLSSs find application in private contexts (Alohari, Kunze, & Earle, 2016; Scheibe, Fietkiewicz, & Stock, 2016), but also in serious environments, e.g. in teaching neurosurgery (Maugeri, Giammalva, & Iacopino, 2016; Kalakoti, Maiti, Sharma, Sun, & Nanda, 2016) or economics (Dowell & Duncan, 2016). There are first thoughts on applying SLSSs in marketing (Brouwer, 2015). These services see also use in live broadcasting sports events (Pophal, 2016); however, there are massive legal problems (Ainslie, 2015; Sandomir, 2015). Authors discussed legal and ethical implications of SLSSs (Faklaris et al., 2016; Honka et al., 2015), while other focus on privacy (Alamiri & Blustein, 2016; Stewart & Littau, 2016). From a more technical view, computer science aspects of SLSSs became analyzed (Favario, Siekkinen, & Masala, 2016; Siekkinen, Masata, & Kämäräinen, 2016; Wilk, Wulffert, & Effelsberg, 2015; Wilk, Zimmermann, & Effelsberg, 2016). Some papers only discuss one of the SLSSs. We could identify literature on Periscope (Edelmann, 2016; Favario, Siekkinen, & Masala, 2016; Rugg & Burroughs, 2016; Stewart & Littau, 2016; Tang, Venolia, & Inkpen, 2016; Wang, Zhang, Wang, Zheng, & Zhao, 2016), Ustream (Smith-Stoner, 2011; Tasner, 2010), and YouNow (Honka et al., 2015; Scheibe, Fietkiewicz, & Stock, 2016; Stohr et al., 2015).
2. THE SOCIAL LIVE-STREAMING SERVICES YOUNOW, PERISCOPE, AND USTREAM
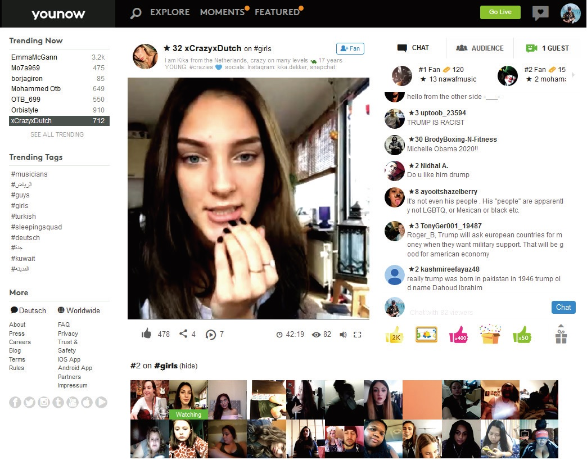
YouNow is a live webcast service that was founded by Adi Sideman in 2011(Figure 1). YouNow is mainly a web browser service, however, it can also be used by either Android or iOS devices. YouNow has on average of about 100 million user sessions per month and one can find 150,000 daily broadcasts on it. The most appreciated target group are teenagers (Scheibe, Fietkiewicz, & Stock, 2016). According to Alexa, most of its users (about one quarter) are from the US, but we can also find people from Turkey, Mexico, Saudi Arabia and Germany. The information behavior on YouNow has been scientifically analyzed. An empirical study found out that main motivations to stream were the “need of self-representation, boredom and intended acceptance by the community” (Scheibe, Fietkiewicz, & Stock, 2016, p. 13). Features such as gamification can increase the motivation to use the service (Wilk, Wulffert, & Effelsberg, 2015).

Periscope is a live streaming application for iOS and Android(Figure 2). It was developed by Kayvon Beypour and Joe Bernstein and launched by Twitter in March 2015 (Edelmann, 2016). The idea of this application is to broadcast short clips. Twitter announced that in August 2015, Periscope reached a total amount of 10 million accounts (Rugg & Burroughs, 2016). More than half of these accounts are US-Americans. Other countries with about 5% and lower usage are Turkey, India, Spain and France. Just like YouNow, since its release, Periscope has dealt with privacy and copyright issues. For example, Periscope users are known for streaming TV premieres or sporting and cultural events illegally and therefore have been banned from these events (Rugg & Burroughs, 2016). However, a prosecution of these individuals is almost impossible (Stewart & Littau, 2016). One has to consider that Periscope, as an information sharing platform, can be used for beneficial purposes, e.g. an information-sharing resource during crisis events. People can inform themselves quickly during these events.
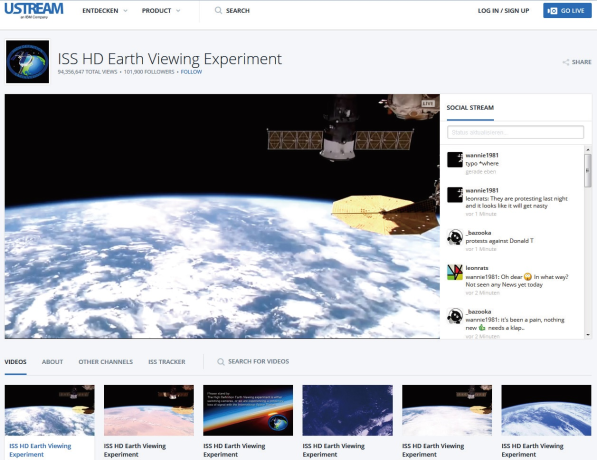
Ustream was founded by Brad Hunstable, John Ham and Gyula Feher in 2007 and has offices in both San Francisco and Budapest(Figure 3). In January 2016, Ustream was acquired by its current parent company, IBM. It is one of the leading providers of cloud-based, end-to-end video solutions for media and enterprises. It provides not only live videos, but also videos on demand for more than 80 million viewers per month. Ustream has a broad content spectrum with a large variety to reach the largest possible audience. It consists of a number of different products, including Ustream Align and Ustream Pro Broadcasting. Ustream Align is an internal video communication platform for a company and its employees, whereas Ustream Pro Broadcasting (the research object of this article) serves broadcasters and marketers, who require a dependable platform for producing, publishing and managing both live and recorded video streams. Ustream, Inc. holds a patent for its ‘Bidirectional communication on live multimedia broadcasts’ (US 9185152 B2).
Each of the three SLSSs has a different focus on the content produced and a different target group. YouNow is mainly used by teenagers, so it is interesting to see if they produce a different kind of content than streamer who use Ustream, which has a different, more scientifically focus. Periscope, on the other hand, can be used by journalists to broadcast news or a crisis.
Meerkat was another general live streaming app that could not stand against its competitor Periscope. Meerkat has abandoned the live streaming model (Wagner, 2016) which is why Meerkat is not investigated in this research. The Japanese platform Nico Nico Douga was also not considered, for fear of there not being enough streams originating from either the US or Germany to compare to the Japanese streams. Facebook Live and YouTube Live are other SLSSs which were not considered because they were, at the time we conducted the research, not as popular as YouNow, Ustream and Periscope. Twitch was another possible choice, but the focus of the site is too narrow with only gaming videos.
3. RESEARCH MODEL AND RESEARCH QUESTIONS
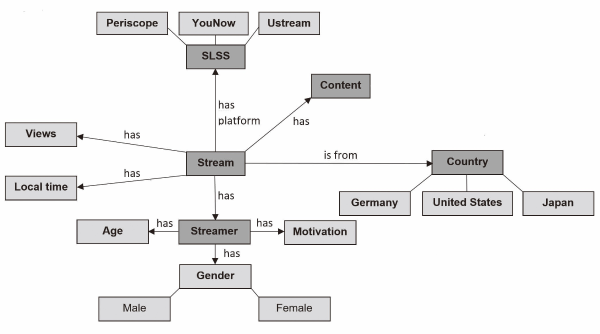
What is our research model? And what are the research questions? Each stream has a certain amount of views and is streamed at a certain period in time. It contains user-generated content. The streams we wanted to observe were broadcasted through Ustream, YouNow and Periscope, and originates from the United States of America, Japan and Germany. We wanted to have insight into different cultures and their behavior on SLSSs. Since our research team had the required language skills for those countries (German, English, and Japanese) we had the opportunity to investigate three culturally and geographically distant countries. Each individual stream is produced by a different streamer or a group of streamers. These streamers differ in age, gender, and their subjective motivations for perusing a social live streaming service. Data to every aspect shown in our research model (Figure 4) was collected and analyzed over the course of four weeks.
According to our research model, the research questions (RQs) are:
RQ1: What are the gender and the age distributions on SLSSs?
RQ2: What motives lead streamers to broadcast?
RQ3: What kind of content do streamers produce?
RQ4: For RQ2 und RQ3: Are there differences between countries (RQ4a) and services (RQ4b)?
4. CATEGORIZATION OF MOTIVES AND CONTENTS
This study is the first comprehensive attempt to analyze motives of streamers and user-generated content on SLSSs. Despite of the studies of Scheibe, Fietkiewicz and Stock (2016) as well as Tang, Venolia and Inkpen (2016) there is no literature on this topic. However, there are multiple studies concerning the usage of SNSs. To this day, the behavior of SNS users has been observed, analyzed, and documented thoroughly, with special attention being paid to users of the platforms Facebook and Twitter. The fundamental question that arises is: Who publishes what content on which platform and why? In addition to the literature review, we watched videos on SLSSs in order to find appropriate categories to describe the videos’ contents and the streamers’ motivations.
Motives to use SNSs are manifold and have been scientifically analyzed with various foci. Simple intrinsic motives for the use of SNSs are boredom (Brandtzæg & Heim, 2009) as well as fun and entertainment (Cheung, Chiu, & Lee, 2011; Kim, Kim, & Nam, 2010). In addition, social aspects are one of the most mentioned motives in previous researches. Therefore, socializing as an act of establishing new contacts that may prevent loneliness has been observed on SNSs like Facebook and Twitter (Brandtzæg & Heim, 2009). Even already existing relationships and social activities are managed via social media (Beldad and Koehorst, 2015; Tosun, 2012). SNSs provide the opportunities to reach specific groups in order to interact with them (Joinson, 2008). Exchanging views or distribution of the user’s opinion (Lin & Lu, 2011) is easily achievable. That is why organizations use SNSs as important communication channels as well (Kim et al., 2014). Social interactions within virtual communities fulfill the user’s need to belong and raise the group-based self-esteem (Cheung et al., 2011). Even if there is no existing social structure, each user has the possibility to establish his or her own community (Hollenbaugh & Ferris, 2013). Motives like self-expression and a certain sense of mission play a major role in the use of SNSs (Beldad & Koehorst, 2015; Greenwood, 2013). Furthermore, there are also users intending to become famous and earn money through the use of SNSs; they want to be seen and acknowledged (Greenwood, 2013). Marwick and Boyd (2010; 2011) describe this phenomenon of a user keeping in contact with their own community for the sake of personal branding as “micro-celebrity.” All in all, based upon literature review and own observations we formed the following motivation categories: boredom, fun, hobby, socializing, loneliness, relationship management, to reach a specific group, exchange of views, need to communicate/inform, need to belong, self-expression, self-improvement, sense of mission, become a star, to make money, troll, no comment.
In the same manner as the differentiation of the user motives to use SNSs we distinguished several content categories. People like to use SNSs to communicate (Beldad & Koehorst, 2015; Brandtzæg & Heim, 2009); so, it is likely that people will use SLSSs to chat about all kinds of topics as well. In the same sense, they also share information about various kinds of topics or themselves (Hollenbaugh & Ferris, 2013). One of these topics could be, for instance, a tutorial for fitness exercises. Since entertainment is another factor to use SNSs (Cheung, Chiu, & Lee, 2011; Kim, Sohn, & Choi, 2010), it is likely that people will use SLSSs to entertain themselves or others, while using different kinds of entertainment media, since live streams present an opportunity to broadcast movies, TV shows, or music. The media can even be broadcasted 24 hours a day, so the category 24/7 was used as well. This category represents a webcam which runs 24 hours a day, seven days a week. Sport events are also entertainment; and there are already critics about people using SLSSs to broadcast those (Edelmann, 2016). Gaming is another kind of entertainment. Twitch.tv is already the main platform to stream this kind of content, but it is likely that gamers will be present on other SLSSs as well. There is no denying that people who start as musicians on YouTube can get popular; examples are Justin Bieber or Lindsey Stirling. So maybe people will use SLSSs to broadcast themselves making music.
A study by Tang, Venolia and Inkpen (2016) defined and investigated several content categories on SLSSs. For this study, some of the categories were adopted. This includes people streaming themselves while they were at home or in a restaurant eating food. Another category defined by them are animals, either in a home or in nature. Also, nature itself was categorized. A different aspect Tang et al. (2016) mentioned is a craft or special skill a streamer is broadcasting, which can be drawing a picture, or making comedy. The category “slice of life” represents the “normal” day of a streamer, for example how he or she sleeps, goes to work or brushes his or her teeth. SLSSs can also be used for scientific or educational purposes including broadcasting information about science, technology and medicine (STM). Rugg and Burroughs (2016) state that people stream news using SLSSs. SNSs were used for conversation about political issues (Hampton, Shin, & Lu, 2016), so it would be no surprise that SLSSs have such content, too. Because SLSSs are live and the content is produced in real time, the category “Nothing” was included into our research, which means that there was no produced content at all in the time the data has been collected. SLSSs are rising in popularity; this makes them interesting for users who want to make money through it. There is a category “Business Information” here broadcasters tell about their business ideas and try to allocate investors. Singh (2015) writes about SNSs as an intersection of spirituality, human world and natural world. So, we included the category “Spirituality” into our research. We worked with the following content categories: to chat, make music, share information, news, fitness, sports, gaming, animals, entertainment media, spirituality, draw/paint a picture, 24/7, STM (science, technology, medicine), comedy, slice of life, politics, nature, food, business information, nothing, others.
Additionally, we applied formal categories: Gender, local time, day of the week, name of the streamer, number of spectators, age of the streamer, language.
5. METHODS
The subject of this research is to assess, evaluate and compare streamers’ information production behavior with emphasis on content and motivations. We wanted to gain insight in the information production behavior of SLSSs’ users from an information science point of view. To collect meaningful data, it was necessary to create standardized data sets. Our main method is content analysis (Krippendorf, 2004). The following steps were taken in the process of analyzing the content: Step one is to draft research questions or hypotheses, which resulted in our research model and in our research questions. The second step is selecting the sample. Our sample are streams which originated from the U.S., Japan and Germany on the platforms YouNow, Periscope and Ustream, and were observed in the time period of four weeks (in April, 2016). The third step is defining categories and to create a codebook which exactly describes the application of a certain category to a given live-stream (McMillan, 2009). To ensure a qualitative content analysis with a high reliability the research object was approached in two different ways. At first, a directed approach via assorted literature was used to confirm and reassure previous theoretical considerations on research questions, hypotheses, variables, their relations and further proceedings. In addition to existing researches, conventional content analysis via observation was employed, “allowing the categories and names for categories to flow from the data” (Hsieh & Shannon, 2005, p. 1279). Thus, important keywords for this research were generated directly from the collected material.
Literature information as well as our own observations formed the foundations for our categories of contents and motives. After that, our codebook has been developed. The codebook has been used to create an Excel spreadsheet with all mentioned categories of contents, motivation, and formal data. The fourth step “is training coders and checking the reliability of their coding skills” (McMillan, 2009, p. 63). To ensure the reliability, it is required that the coders work in a group of at least two coders, who are trained in coding (Krippendorf, 2004). In the fifth step the empirical work was done. The Excel spreadsheet (including all category names) has been distributed to all 24 researchers (advanced students of information science in Düsseldorf). We arbitrarily chose the videos to be watched. Researchers have ticked off anything in this spreadsheet that was applicable to the stream they were currently watching. The gathering of data was performed in two phases. In the first phase, they just watched the streams and categorized the content (in one or more categories). Afterwards, in the next phase, they communicated with the streamers to find out their motivation to broadcast a stream. Through inquiries and cooperation with the information producers it was possible to determine their motivation. Here, again, one or more motive categories were applicable.
Since many streamers have insisted on their personality rights by not giving the permission for recording or transcription, and because of the short span of time some SLSSs store their content, a replication of the study with the same data base of streams is not possible. To effectively collect the records, twelve teams consisting of two persons per team were formed and allocated to one of the three countries (USA, Germany, and Japan). It was ascertained that the researchers were fluent in the language of the streams (i. e. English, German, and Japanese). Additionally, streams were collected at four different time intervals (12am to 5:59am, 6am to 11:59am, 12pm to 5:59pm, 6pm to 11:59pm; just as Honka et al., 2015, did) to determine whether the broadcasting behavior is different. We worked with 12 pairs of coders, of which each pair watched and categorized the same stream. For collecting the data, the “four eyes principle” was used. Each stream was watched simultaneously but independently by two coders for two to a maximum of ten minutes. In all cases, the coder pairs arrived at consensus on the categorization. Therefore, an intercoder reliability of 100% can be guaranteed. All in all, 7,667 streams were watched by two researchers each in a time span of four weeks. The last step includes the analysis and interpretation of the data. The results of each stream were recorded in the Excel spreadsheet and then compared. The characteristics of the broadcasts were analyzed via descriptive statistics.
6. STREAMERS’ GENDER AND AGE
Looking at the accumulated data, one can easily identify some of the general trends. Let us first take a look at the streamers themselves. Globally, the majority of the streamers are men, as they make up 61% of all streamers (Table 1). Excluded from Table 1 are streams for which no gender of the person could be determined, due to privacy reasons or simply because no streamer could be seen. The results of Tang, Venial and Inkpen (2016, p. 4774) confirm this distribution. There are only few differences in their information production behavior between the genders; this result seems to be different in comparison to other SNSs (Correa, Hinsley, & de Zúñiga, 2009; Seymour, 2012). In fact, when one looks at the motivations and the generated content of female streamers, one can see that most of them match with the motivations and the content of the male users.
Most of the people using these platforms are kids, teenagers, and young adults, as about 70% of all streamers are between the ages of 13 and 25, which is to be expected considering these age groups use the Internet daily and are the most invested in social media services (Table 2).
Table 2
Age Group Distribution on SLSSs (N=4,937)
| Age | Number | Relative Frequency |
|---|---|---|
| 13-19 | 1,839 | 37.25% |
| 20-25 | 1,631 | 33.04% |
| 26-30 | 580 | 11.74% |
| 31-35 | 361 | 7.31% |
| 36-40 | 192 | 3.89% |
| 41-45 | 144 | 2.92% |
| 46-50 | 110 | 2.23% |
| 51-55 | 47 | 0.95% |
| 56-60 | 21 | 0.43% |
| 61-65 | 8 | 0.16% |
| 66-70 | 2 | 0.04% |
| 76-80 | 2 | 0.04% |
To understand the trends concerning the age groups better, we have to look at how the different generations are influenced by social media. Following Brosdahl and Carpenter’s (2011) categorization of generations, there is the Silent Generation (1925-1945), the Baby Boomers (1946-1960), Generation X (1961-1980) otherwise known as Digital Immigrants (Prensky, 2001) and Generation Y (born after 1981) otherwise known as Digital Natives (Prensky, 2001). According to Prensky (2001), Digital Natives are “native speakers” of the digital language of the computer, video games and the Internet while Digital Immigrants encompasses those who were introduced and adapted to the digital world at a later point in their lives. Furthermore, in recent studies (Fietkiewicz, Lins, Baran, & Stock, 2016a; 2016b), it has been pointed out that there are possibly significant differences between the members of Generation Y and their children, assuming they were born in the late 1990s and 2000s, due to the development of the media and rise in its use after its introduction in 1981. Therefore, it is suggested that this development gives rise to a new generation, whose members are familiar with digital gadgets and are frequently exposed to them, namely Generation Z. In conjunction with the afore mentioned categorization of generations, this article will allocate those who were born after the year 2000 to Generation Z and, therefore, assign the year 1999 as an ending point to Generation Y.
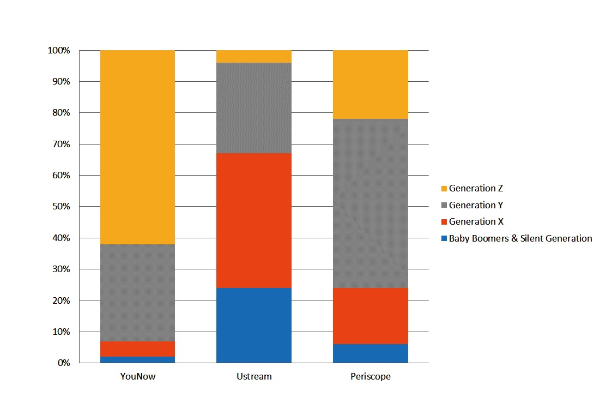
Figure 5 illustrates the generations of the streamers, distributed into the three different streaming platforms. Whereas more than half of the YouNow streamers belong to the Generation Z, just 4% of the Ustream users belong to this group. Instead, about 24% of Ustream's users are among the Baby Boomers & Silent Generation. This shows that Ustream users are older compared to YouNow's. Similar to YouNow, the smallest group on Periscope are the Baby Boomers & Silent Generation; however, in contrast to YouNow, Periscope is mostly used by Generation Y, with Generation Z and Generation X being runner-ups.
Combining all streams, the median of the number of spectators who watched simultaneously with us is 8. YouNow is the highest in the overall ranking with a median of 12, and Ustream the lowest with a median of 7. Streams by users from the United States have the highest median, which is 13; Japan’s streamers have the lowest. Periscope ranks top in the United States (18) and Japan (8), while YouNow has the highest average number of viewers in Germany (9).
Table 3
Streamer Motives on SLSSs (N=7,667)
| Motivation | Number | Relative Frequency |
|---|---|---|
| Boredom | 1,675 | 21.80% |
| Socializing | 1,256 | 16.38% |
| To Reach a Specific Group | 1,166 | 15.20% |
| Need to Communicate | 1,127 | 14.70% |
| Fun | 1,035 | 13.50% |
| Self-Expression | 845 | 11.02% |
| Hobby | 679 | 8.85% |
| Exchange of Views | 501 | 6.53% |
| To Make Money | 479 | 6.25% |
| Sense of Mission | 332 | 4.33% |
| Need to Belong | 319 | 4.16% |
| To Become a Star | 301 | 3.92% |
| Relationship Management | 270 | 3.52% |
| Self-Improvement | 246 | 3.21% |
| Loneliness | 187 | 2.44% |
| Troll | 86 | 1.12% |
7. MOTIVATIONS OF STREAMERS AND THE CONTENTS OF THEIR STREAMS
There is a huge variety concerning the motivation of each streamer (Table 3). Most of them appear to be using these services out of simplistic reasons, such as boredom (21.8%) and fun (13.5%). A large part of SLSSs’ streamers apparently uses these services mainly for entertainment. But we can identify motives satisfying social needs as socializing (16.4%), reaching a specific group (14.7%), belonging to a certain group (4.2%) and relationship management (3.5%). Some people need to communicate (14.7%), want to exchange their views (6.3%) or have a “mission” to communicate (4.3%). A minority of streamers (about 4%) make use of SLSSs to foster their career in becoming a (micro-)celebrity or to make money (6.3%). About 1% of the participants confessed that they behave as a troll.
Table 4
Content Categories on SLSSs (N=7,667)
| Content | Number | Relative Frequency |
|---|---|---|
| To Chat | 3,376 | 44.02% |
| Share Information | 1,317 | 17.17% |
| 24/7 | 1,156 | 15.07% |
| Slice of Life | 1,096 | 14.29% |
| Nothing | 946 | 12.34% |
| Entertainment Media | 900 | 11.74% |
| Make Music | 738 | 9.62% |
| Animals | 516 | 6.73% |
| Nature | 421 | 5.49% |
| Gaming | 419 | 5.46% |
| Sports | 301 | 3.92% |
| News | 262 | 3.42% |
| Spirituality | 239 | 3.12% |
| Advertising | 223 | 2.91% |
| Food | 177 | 2.31% |
| Comedy | 116 | 1.51% |
| Fitness | 110 | 1.42% |
| Politics | 106 | 1.38% |
| Business Information | 106 | 1.38% |
| STM | 72 | 0.94% |
| Draw/Paint a Picture | 61 | 0.80% |
Moving on to the content of the streams (Table 4), we see that chatting is the main content category (44.0%). This seems to be a stable result since Tang, Venolia and Inkpen (2016, p. 4773) arrive at the same result. Sharing information (17.2%), 24/7 (i.e. webcams, 15.0%), slice of life (14.3%), entertainment media (11.8%) and making music (9.6%) are further frequently identified content categories. About 12% of all streams exhibit—nothing. We should note an interesting trend concerning the content. It appears that streamers favor easily producible contents (as chatting, 24/7 or even nothing) over contents which require much time, effort, and preparation (as, e.g., making own music or producing STM information). The majority of streams obviously require only a minimum of cognitive effort or mental effort of thinking (Tyler, Hertel, McCallum, Ellis, 1979) while producing the videos.
The streamers' motivations as well as the content categories were consistent throughout the different time spans, meaning that there are no essential information production behavior changes depending on the time of day (deviations were below 2%).
8. STREAMING BEHAVIOR BY COUNTRY
In the following section, there will be a closer look to the ranks based on the collected data in the Unites States of America, Japan, and Germany(Tables 5 and 6).
Table 5
Top Ten Content Categories by Country
| Rank | USA (N = 3,143) | Germany (N = 2,604) | Japan (N = 1,920) | |||
|---|---|---|---|---|---|---|
| Content | Relative Frequency | Content | Relative Frequency | Content | Relative Frequency | |
| 1 | To Chat | 37.67% | To Chat | 52.53% | To Chat | 42.97% |
| 2 | Share Information | 23.93% | Share Information | 13.94% | 24/7 | 22.86% |
| 3 | Nothing | 18.74% | Entertainment Media | 13.82% | Slice of Life | 15.63% |
| 4 | 24/7 | 15.91% | Slice of Life | 11.41% | Share Information | 10.52% |
| 5 | Slice of Life | 15.88% | Nothing | 8.56% | Animals | 10.21% |
| 6 | Make Music | 14.54% | 24/7 | 8.33% | Nature | 10.05% |
| 7 | Entertainment Media | 13.97% | Make Music | 7.26% | Gaming | 7.08% |
| 8 | Animals | 8.18% | Gaming | 6.64% | Nothing | 6.98% |
| 9 | Nature | 6.20% | Animals | 2.42% | Entertainment Media | 5.26% |
| 10 | Advertising | 5.92% | News | 1.84% | Make Music | 4.79% |
Table 6
Streamer Motives by Country
| Rank | USA (n = 3,143) | Germany (n = 2,604) | Japan (n = 1,920) | |||
|---|---|---|---|---|---|---|
| Motive | Relative Frequency | Motive | Relative Frequency | Motive | Relative Frequency | |
| 1 | To Reach a Specific Group | 23.19% | Boredom | 28.07% | Socializing | 21.46% |
| 2 | Need to Communicate/Inform | 21.51% | Fun | 12.67% | Need to Communicate/Inform | 16.77% |
| 3 | Boredom | 20.46% | Socializing | 11.56% | Boredom | 15.68% |
| 4 | Socializing | 17.28% | Self-Expression | 7.64% | Fun | 15.47% |
| 5 | Self-Expression | 16.48% | To Reach a Specific Group | 6.07% | To Reach a Specific Group | 14.53% |
| 6 | Fun | 12.98% | To Make Money | 5.91% | Hobby | 11.61% |
| 7 | Exchange of Views | 12.28% | Hobby | 5.76% | Self-Expression | 6.67% |
| 8 | Hobby | 9.74% | Need to Belong | 5.61% | To Make Money | 4.74% |
| 9 | To Make Money | 7.45% | To Become a Star | 5.11% | Self-Improvement | 3.59% |
| 10 | Sense of Mission | 7.22% | Need to Communicate | 4.95% | Exchange of Views | 3.44% |
| 11 | Need to Belong | 5.19% | Relationship Management | 2.73% | Sense of Mission | 3.13% |
| 12 | Relationship Management | 5.15% | Exchange of Views | 1.88% | To Become a Star | 2.34% |
| 13 | Self-Improvement | 4.30% | Sense of Mission | 1.73% | Loneliness | 1.98% |
| 14 | To Become a Star | 3.91% | Loneliness | 1.69% | Relationship Management | 1.93% |
| 15 | Loneliness | 3.34% | Self-Improvement | 1.61% | Need to Belong | 0.52% |
| 16 | Troll | 1.78% | Troll | 0.92% | Troll | 0.31% |
U.S. The content data shows that most of Americans seem to love talking about just anything and they like to share information about themselves. However, compared with Japan (43%) and especially Germany (53%), only 38% of all U.S. based streamers prefer to chat while streaming. Sharing information is essential for 24% of American users and for 23% of Japanese, but only for 14% of Germans.
A bad habit of American streamers is to present nothing. The camera runs, but there is no action anywhere. We could identify about 19% of all U.S. based videos presenting nothing, while in Germany there are 9% and in Japan only 7%.
In contrast to Japan (5%) and Germany (7%), a lot of American streamers (15%) perform music on SLSSs. Such users try to reach a specific group to improve their image and to cultivate their fan bases.
It is striking to note that only American streaming channels contain advertising nowadays (about 6%). American companies know that live streaming is rising in popularity in the lives of Americans. They are using the generation of live streamers (primarily generation Y) to connect in real-time with their (potential or actual) customers. Through careful research, businesses are finding a new and exciting platform that provides more personalized advertising.
Reaching a specific group is the main motive of U.S. streamers (23%), in Japan (15%) and in Germany (6%) this motive is not that important. The motives of the need to communicate (22%) and boredom (20%) could be observed for every fifth American user each. The category of sense of mission (7%) is for Americans ranked higher than in other countries. Americans (7%), and also, Germans (6%), told us that they were motivated to stream by the intention to make money.
Germany. The data show that the majority of Germans (53%) uses live streaming channels for the sole purpose of chatting. Sharing information (14%), entertainment (14%), and slice of life (11%) are frequent further content categories.
The top motivation for information production behavior in Germany is boredom (28%). But also in the U.S. (20%) and Japan (16%) boredom seems to be a main motive to stream. More than 12% of the German streamers act for fun. Are especially German SLSSs’ users part of a “Generation B” (“Generation Boredom”)?
Japan. When it comes to the content of Japanese streams, one can see that just like in the United States and Germany, chatting (with 43%) is most common among streamers. However, starting with the second rank, content in Japan differs from the other two countries. 24/7 streams are broadcasted more often in Japan (23%), as well as streams including animals (10%) or elements of nature (10%). This is mostly due to the platform Ustream where a lot of 24/7 live streaming of animals or nature takes place.
Regarding the motives for streaming in Japan, socializing is the main one (21%). Next is the need to communicate (17%). There are many foreigners living and working in Japan, especially Brazilian and Russian people who also tend to stream quite often. They mostly try to communicate with people in their mother language and meet friends over the Internet. Furthermore, many Japanese people feel the need to communicate and inform their audience, e.g. by giving a tour through various Japanese cities, showing Buddhist temples or simply the landscape. Also, a bit more common in Japan compared to Germany seems to be the motive of streaming as a hobby (12%). The platform Periscope is particularly popular among Japanese streamers, having many passionate “Periscopers,” who have gathered a notable number of fans and whose hobby is to stream on a regular basis. In contrast, barely any streams from Japan can be found on the platform YouNow which emphasizes that YouNow is not established in Japan.
Table 7
Top Ten Content Categories by Service
| Rank | YouNow (N = 2,021) | Ustream (N = 2,686) | Periscope (N = 2,960) | |||
|---|---|---|---|---|---|---|
| Content | Relative Frequency | Content | Relative Frequency | Content | Relative Frequency | |
| 1 | To Chat | 66.90% | 24/7 | 38.61% | To Chat | 61.89% |
| 2 | Share Information | 19.74% | Entertainment Media | 18.50% | Share Information | 17.94% |
| 3 | Nothing | 19.50% | Animals | 17.39% | Make Music | 8.24% |
| 4 | Make Music | 15.73% | Share Information | 14.33% | Entertainment Media | 7.40% |
| 5 | Slice of Life | 10.19% | Gaming | 11.73% | Nature | 5.03% |
| 6 | Entertainment Media | 9.10% | Nature | 9.64% | Slice of Life | 4.73% |
| 7 | Comedy | 3.27% | Nothing | 9.08% | Food | 2.97% |
| 8 | Gaming | 3.07% | News | 8.71% | Sports | 2.94% |
| 9 | Fitness | 2.28% | To Chat | 7.52% | Nothing | 1.76% |
| 10 | Advertising | 2.03% | Advertising | 4.24% | Gaming | 1.42% |
9. STREAMING BEHAVIOR BY INFORMATION SERVICE
Looking at Table 7 one can see that YouNow and Periscope share similarities concerning content distribution. Most striking is the high percentage of chatting (YouNow: 67%, Periscope: 62%) and sharing information (YouNow: 20%, Periscope: 18%). This could be explained due to the purpose of these websites which is mainly focused on social interaction between the streamers and their audience. Both services have functions that enable better communication with the viewers. Firstly, on YouNow and Periscope (but not on Ustream) there is a “like” function which allows the viewers to show the streamer that they enjoy the content. In Periscope, the streamer even sees the likes portrayed as colorful hearts appearing on the screen. Furthermore (on all services), the viewer has the possibility to react to the streamer’s performance in real time through the chat function. A conversation similar to real life can be held as well as a very close and social sphere created, depending on the numbers of viewers.
Ustream’s purpose is mainly to inform the audience via webcams, to broadcast conferences or news. A lot of videos are 24/7 streams showing mostly animals or nature. The viewer has the possibility to look into the everyday life of an animal (e.g. watching eagles in their nest) or to look down to the earth from the International Space Station (ISS) applying the ISS Earth Viewing Experiment. Compared to Periscope and YouNow, it offers limited interaction possibilities. Chatting on Ustream has only an amount of about 8%.
The less interesting content category “nothing” is most often on YouNow (20%); on Ustream it amounts to 9% and on Periscope to only 2%. For making music, streamers prefer YouNow (16%) over Periscope (8%) while avoiding Ustream. Some sports events (3%) are covered by Periscope.
Those findings implicate that YouNow and Periscope are more often used to produce socially motivated content (to chat, share information), because people use them to interact with each other. Whereas Ustreams’ content is more focused on entertainment or animals, often combined with 24/7 streams.
Table 8
Streamer Motives by Service
| Rank | YouNow (N = 2,021) | Ustream (N = 2,686) | Periscope (N = 2,960) | |||
|---|---|---|---|---|---|---|
| Motive | Relative Frequency | Motive | Relative Frequency | Motive | Relative Frequency | |
| 1 | Boredom | 35.48% | To Reach a Specific Group | 25.58% | Boredom | 30.03% |
| 2 | Socializing | 22.17% | Need to Communicate | 14.74% | Socializing | 25.24% |
| 3 | Fun | 18.65% | To Make Money | 12.92% | Need to Communicate | 16.66% |
| 4 | Self-Expression | 18.26% | Hobby | 8.86% | Fun | 15.95% |
| 5 | Need to Communicate | 13.11% | Fun | 6.92% | Self-Expression | 13.07% |
| 6 | Exchange of Views | 11.83% | Exchange of Views | 3.46% | To Reach a Specific Group | 9.32% |
| 7 | Hobby | 10.74% | Self-Expression | 3.31% | Hobby | 7.57% |
| 8 | To Reach a Specific Group | 10.34% | Sense of Mission | 2.87% | Exchange of Views | 5.71% |
| 9 | To Become a Star | 9.65% | Boredom | 2.57% | Need to Belong | 4.36% |
| 10 | Need to Belong | 8.91% | Socializing | 2.27% | Sense of Mission | 3.72% |
| 11 | Relationship Management | 7.27% | Self-Improvement | 1.19% | Relationship Management | 3.58% |
| 12 | Self-Improvement | 5.74% | To Become a Star | 1.15% | Loneliness | 3.58% |
| 13 | To Make Money | 4.60% | Relationship Management | 0.63% | Self-Improvement | 3.31% |
| 14 | Loneliness | 3.86% | Need to Belong | 0.37% | To Become a Star | 2.53% |
| 15 | Sense of Mission | 2.23% | Troll | 0.37% | Troll | 1.32% |
| 16 | Troll | 1.83% | Loneliness | 0.11% | To Make Money | 1.32% |
Similar to the distribution of content categories, motives to stream on YouNow and Periscope (but, again, not on Ustream) are similar(Table 8). Both services’ rankings for motives are almost identical, with boredom leading the list followed by socializing, need to communicate, fun and self-expression.
The fact that boredom is ranked first is particularly noteworthy as this motive has never been described as remarkable when talking about using Social Media before. Instead, in literature the motives of communication, becoming a celebrity and reaching a specific group are portrayed as important factors leading to people broadcasting themselves (Marwick & Boyd, 2011, p. 141). However, only a comparatively small number of streamers claimed to use SLSSs as a means to become famous. YouNow and Periscope are mainly used for socializing and self-expression, a phenomenon which can also be observed on SNSs like Facebook (Tosun, 2012, pp. 1510-1512). For Ustream, it becomes evident that streamer motives are leaning towards commercial or serious (e.g. scientific) use instead of social use.
The motives to use the different SLSSs mirror the implications about the produced content. YouNow and Periscope are valued for the opportunity of social interactions, whereas Ustream, even if it offers the possibility to interact with one another, is valued because of commercial or scientific motives.
10. CONCLUSION
What did we learn from our studies on the information production behavior with emphasis on user-generated content and streamers’ motivations on the three general social live streaming services YouNow, Periscope and Ustream? We are now going to answer our four research questions.
RQ1 asked about age and gender of the streamers. YouNow and Periscope are services with streams mostly by adolescents for adolescents, while Ustream users are a bit older. However, the majority of all streamers is aged between 13 and 25 years. Main streamer group on YouNow is Generation Z, on Periscope it is Generation Y, and, finally, on Ustream it is Generation X. Members of Baby Boomers and Silent Generation are nearly visible on YouNow as well as on Periscope, but on Ustream. About a quarter of Ustream’s streamers belong to the Baby Boomers & Silent Generation. Fietkiewicz, Lins, Baran and Stock (2016a, p. 3834) found for YouNow that it is mainly used by Generations Y and Z, but not by Generation X.
About 61% of our analyzed streams were broadcasted by male streamers. This result is in line with the findings of Scheibe et al. (2016, p. 12); they identified 61% male users on YouNow as well. The results of Tang et al. (2016, p. 4774) confirm this gender distribution on SLSSs, too.
The motives of the streamers are topic of RQ2. Here, we arrive at a rather surprising result. There are not motives like becoming a celebrity or to exchange views which are in the center of attention, but boredom and fun. A third of the streamers just wants to get some time passed to relieve their boredom. However, with the need to socialize, to reach a specific group and the need to belong we identified socially grounded motivations. A minority of streamers intends to make money or become a micro-celebrity through SLSSs. We have to notice that there are country-specific differences (RQ4a): While in Germany the main motives to streams are indeed boredom and fun, followed by socializing; in the U.S. and in Japan there are more diversified sets of main motives. U.S. based streamers broadcast to reach a specific group, because they want to communicate, because they are bored, they want to socialize and to cultivate self-expression. Main motivations of Japanese streamers are socializing, the need to communicate, boredom, fun, reaching a specific group and broadcasting as a hobby. Concerning the different services (RQ4b), boredom and socializing are the two main motives found on YouNow and Periscope, while the need to reach a specific group and the need to communicate are main streamers’ motives on Ustream. While socializing is a well-known motivation to use social media, boredom as a leading motivation of using social media is very remarkable and should be studied in the future more in depth.
What kind of content do streamers produce (RQ3)? There is a clear top content category: to chat. As this description is in line with the findings of other studies, it seems to be a stable result. To chat is the top categories in all three countries (RQ4a), and it is at the top for YouNow and Periscope (RQ4b). Frequently found further contents are sharing information (ranked second in Germany and the U.S. as well as on YouNow and Periscope), 24/7, i.e. webcams (ranked second in Japan and first on Ustream) and slice of life. Every tenth of all streamers is going to entertain his or her viewers through self-produced music. More than 10% of the streams show nothing. Serious topics as politics, business information or scientific, technical and medical information are relatively seldom on the air. The majority of SLSSs’ streams are obviously produced with a minimum of cognitive effort.
We have to notice some limitations of our study leading to an outlook on further endeavors. The empirical basis of our findings with 7,667 intellectually analyzed videos is very large and should be reliable due to the law of large numbers. As we identified some country-specific differences in contents as well as in the streamers’ motivations, the results are not universally generalizable. Here, further country-specific studies have to be conducted. We know from other studies (e.g., Scheibe et al., 2016) that there are many SLSS users in Turkey and in Saudi Arabia. How do Turks behave on SLSSs? What are the characteristics of Arabian users? In the Japanese SLSS scene, a local player has many streamers as well as viewers. What are the users’ motives and the contents on Nico Nico Douga? We have observed that foreigners apply SLSSs to stay in contact with their fellow countrymen, with friends and relatives far away. What information behavior on SLSSs does this specific user group exhibit? Finally, there are two questions always on our minds: Why is boredom a main motivation to use SLSSs? And why do many streamers invest such minimal cognitive effort into their live broadcasts?
Ack
Responsible for the collection and interpretation of the data were the following: Yasmin Ehlers, Vu Thuy Doan Huynh, Justine Braun, Marvin Sulliga, Bartosz Kamuda, Jan-Peter Schletter, Neil Suarez Rodriguez, Tobias Wille, Alexander Sowa, Vanessa Miklós, Sebastian Rudzinski, Natalie Singh, Jannis Szameitat, Gargareas Zachos, Franziska Zimmer, Sabrina Fock, Sarlascht Totakhel, Shari Jansen, Sandra Engelen, Albu D. Tarex, Bich Chau Nguyen, Shirin Sabeh, Thomas Kasakowsij, Miriam Rhein, Jannine Pfeuffer, Pauline Ollik. Miriam Rhein prepared the literature review, Jan-Peter Schletter monitored the calculation on Excel and, finally, Vanessa Miklós, Thomas Kasakowskij as well as Franziska Zimmer authored the text. Project head was Wolfgang G. Stock. Speaker of Mathilde B. Friedländer is Franziska Zimmer (franziska.zimmer@uni-duesseldorf.de).
References
, It’s not about the risks, I’m just used to doing it: Disclosure of personal information on Facebook among adolescent Dutch users, In G. Meiselwitz (Ed.), Social Computing and Social Media. 7th International Conference, SCSM 2015 Held as Part of HCI International 2015 Los Angeles, 2-7 August, Springer International, Switzerland, 2015, 185, 195
(2016) Meerkat is ditching the Livestream – And chasing a Video Social Network instead http://www.recode. net/2016/3/4/11586696/meerkat-is-ditching-thelivestream-and-chasing-a-video-social-network
- Submission Date
- 2016-12-23
- Revised Date
- Accepted Date
- 2017-03-09