- P-ISSN2287-9099
- E-ISSN2287-4577
- SCOPUS, KCI
 ISSN : 2287-9099
Comparing Nanotechnology Web Portal Requirements Using a Kano Method

Junhyun Kim (National Nanotechnology Policy Center, Korea Institute of Science and Technology Information)
JaeSin Kim (National Nanotechnology Policy Center, Korea Institute of Science and Technology Information)
Myung Shin Kim (Institute of Public Affairs, Yonsei University)
Yonghwan Ju (Korea Local Information Research & Development Institute)
Seung Hyun Seo (Department of Public Administration, Kwangwoon University)
In-Kyu Han (Department of Public Administration, Kwangwoon University)
Younghoon Choi (Department of Public Administration, Kwangwoon University)

Abstract
We compared nanotechnology web portal requirements using a Kano method, to identify similarities and dissimilarities in Kano-categorizations of features and functions required of nanotechnology among users in universities, government research institutes, and industry. Based upon data obtained from 130 user members of the National Nanotechnology Policy Centre, this study analyzed assessed asymmetries in web users’ feelings based on hypothesized provision and non-provision of web portal requirements. In doing this, this study utilized measures and procedures suggested in the literature such as the most frequent-response categorization, customer satisfaction (dissatisfaction) coefficient, category strength and total strength, and Fong test. This study found that overall, sectors were an important factor in explaining the relationships between web portal requirements and user satisfaction/expectations. When these requirements were classified, users’ perceptions of information contents requirements were consistent across the sectors, but the other functional requirements including communication and collaborations considerably varied.
- keywords
- nanotechnology information, web portals, KANO model, government-industry-university
1. INTRODUCTION
The Korean government has made it clear in its strategic plans (Ministry of Knowledge Economy, 2011/2012; National Science & Technology Council [NSTC], 2001/2005/2011/2016) that nanotechnology, characterized as a general purpose technology (Helpman, 1998; Shea, Gride, & Elmslle, 2011), is a pivotal driver of economic growth (Mazzola, 2003), that Korea is a globally leading performer in fundamental nanotechnology research, and that the country is having difficulty in converting these research results into commercial applications (Kim et al., 2014). The strategic plans have identified and addressed serious barriers to the commercialization of nanotechnology, which include a weak information sharing infrastructure, a gap between research and industry, and difficulties obtaining commercialization-related information (NSTC, 2009/2016; McNeil & Lowe et al., 2007; Kim et al., 2014). Policy recommendations were developed to address these barriers to nanotechnology commercialization (NSTC, 2009/2016; President’s Council of Advisors on Science and Technology, 2014). One recommendation was to refurbish a web-based nanotechnology portal, which facilitates information flow and interactions among enterprises, universities, and government research institutes.
Government concern with web portals in science and technology policy is not new. In Korea information networking in nanotechnology is an ongoing effort that has been carried forward within the framework of the nanotechnology and nanotechnology industry development 5-year plans since 2001, and which is now in its fourth plan period. These efforts have contributed considerably to the development of nanotechnology and its industry by facilitating the collection, connection, and integration of nanotechnology-related information. However, the problems of information overload, unavailability, and location that were addressed by the strategic plans remain unsolved and reoccur repeatedly. A re-examination is needed to ensure that a web portal can be an effective solution to the recurring problems.
Information and communications technology (ICT) including web portals is a major contributor to technological innovations and the commercialization of technologies (Geisler & Kassicieh, 1997). General-purpose technologies, such as nanotechnology (Shea et al., 2011) are pivotal to economic growth (Helpman, 1998), and ICT becomes much more important in facilitating innovations and commercialization of nanotechnology. ICT can be used to facilitate the distribution, access, sharing, collaboration, transfer, or commercialization (Czarnitzki & Rammer, 2003; Risdon, 1994) of technological knowledge and innovations. In this sense, the building-up of databases and web portals is certainly a good start to get relevant innovation actors connected by means of information networking in order to facilitate collaboration among them and commercialization in nanotechnology.
However, information networking is as much a social process (Wellman, 2001) as innovation and commercialization are (Tornatzky, Fregus, & Avellar, 2013). Web portals are a place where individuals with differing needs access and interact. To build an effective web portal, we need to know what differing needs are presented by the actors— universities, government research institutes, and industry—, and what web portal features or functions are required to meet these needs. In doing this, we also need to set priorities among portal features or functions. Little research on web portal development in Korea has so far addressed distinct needs of sectoral actors in the national systems of innovation in nanotechnology. More importantly, the existing studies in nanotechnology networking have not addressed the non-linearity relationships between meeting users’ needs and meeting users’ satisfaction.
The purpose of this study is to compare web portal requirements— features and functions— among universities, industry, and government research institutes in Korea using a Kano method. In other words, this study aims to identify similarities and dissimilarities in Kano-categorizations of features and functions required of nanotechnology among actors in universities, government research institutes, and industry. In using the Kano method, our focus is on the identification of policy-relevant features and functions of a new web portal in nanotechnology, not on the assessment and sophistication of the Kano model.
2. LITERATURE REVIEW
2.1. Web Portals: User Features and Functions
There are multiple and differing meanings of a web portal. For our purposes, a web portal is defined as a package of information services and tools to facilitate the collection, management, and dissemination of resources in domain fields (Tatnall, 2005). For example, nanotechnology web portals serve as a point of access to an “integrated and structured body” (Tatnall, 2005) of information and functions in the domain field of nanotechnology. The features and functions of a web portal are determined by various factors. Many studies have discussed the features and functions of a web portal (Tatnall, 2005). An important point is that the features and functions of web ports are in constant change. A web portal can evolve from a single-functional information system to a multi-functional one, which provides a practical framework for inter-sector communication and collaboration (Tatnall, 2005). In an extensive review of nanotechnology innovations, Chen and Roco (2009) anticipated the emergence and importance of nanotechnology web portals of various special sorts.
Nowadays, web portals include increasingly innovative features and functions of portals as an interactive mechanism and place (Stollberg et al., 2004). These features and functions include information and contents (e.g., papers, people, technology, laws), search and navigation, communication (e.g., chat, conferencing, Q&A), collaborative working, learning resources (e.g., webinar) and newsfeeds to mention a few. They allow members of a targeted community to contribute information contents and other resources, either by submitting information directly to the portal (via some editing or reviewing process), by posting the information on some associated web bulletin board, or to other collaboration tools (Reynolds, Shabajee, & Cayzer, 2004). As technology (including semantic web technologies) advances, web information portals improve in terms of structure, extensibility, customization, and sustainability compared to traditional portals (Reynolds et al., 2004). Big data analytics is touted to have a potential to overcome barriers to effective technology commercialization (Park and Roh et al., 2014; Szlezak et al., 2014). The advent of big data analytics shows a potential to transform traditional Q&A functions of web portals, raising reasonable interest in the introduction of digital curation of data or contents from publications (Gaheen et al., 2013). Big data analytics and curation require both significant time and domain expertise (Kim, Warga, & Moen, 2013), once well analyzed and curated, will be made available for re-use by other researchers and practitioners. Further, web portals are increasingly becoming an online place where collaboration as well as communication takes place within and between the communities of interest. Online communication and collaboration is not a newly emerged phenomenon. For example, e-Science has been a buzz-word around the early 2000s in the Korean science technology information policy community. New features and functions of a web portal are increasingly demanded due to the continuous advancement in ICT, as well as government policy particularly towards information networking in the public sector.
However, a web portal tends to be understood and defined differently from the perspective of the parties concerned. Stein & Hawking (2005) found that the term portal takes a different meaning depending on the viewpoint of the stakeholder: “to the business user it is all about information access and navigation, to the organization it is about adding value, to the marketplace it is about new business models, and to the technologies a portal is about integration.” The literature on government-university-industry interaction has documented barriers and facilitators to technology transfer and commercialization between and among them (Link & Tassey, 1989; Choi & Lee, 1999; Kim et al., 2014). While a recent study revealed that there is a global convergence among actors in the systems of innovation over time in terms of incentives and other factors (Perkmanna, Tartari, & McKelvey et al., 2013), disparities prevail among government-university-industry actors in terms of incentives and disincentives to technology development and commercialization. In other words, to be an effective framework of inter-sector communication and collaboration, a web portal will be designed and built in order to take into consideration not only similarities but also dissimilarities among different sectoral actors.
2.2. Kano Model
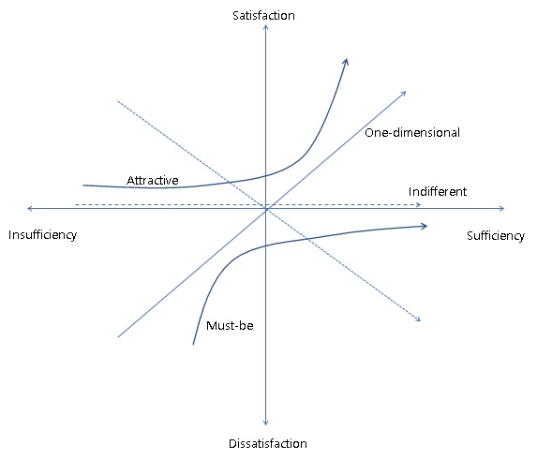
The Kano model is used to better understand the relationship between performance criteria and customer satisfaction, and to resolve trade-off dilemma in multiple-criteria optimization by identifying the key criteria in customer satisfaction (Kano et al., 1984; Chen & Chuang, 2008; Hsieh, 2009). The Kano model of customer satisfaction as a function of need fulfilment refines Herzberg’s identification of hygiene and motivator factors by dividing system outcomes, products, or service (Von Dran, Zhang, & Small, 1999). The Kano model defines the relationship between product attributes and user satisfaction/expectation. There are five types of product attributes, three main attributes, and two potential attributes. Three main categories are basic needs, performance needs, and excitement needs. Each category corresponds to each of the three attributes: must-be, one-dimensional, and attractive attribute. The remaining potential attributes are questionable and reverse. The meanings of these five attributes as outlined by Rashid, Tamaki, Ullah, & Kubo (2011) are as follows. Must-be attributes are those whose absence produces absolute dissatisfaction and whose presence does not increase the satisfaction. Attractive attributes are not expected to be in the product, but if provided, users will be surprised and their satisfaction will increase greatly. One-dimensional attributes enhance satisfaction and vice versa. Indifferent attributes do not result in satisfaction or dissatisfaction, whether provided or not. Reverse attributes lead to absolute dissatisfaction. And questionable attributes mean that there may be errors made in asking or answering questions.
In Figure 1, the upward vertical axis represents satisfaction and downward vertical axis represents dissatisfaction of users. The leftward horizontal axis represents absence of performance (the attribute is not working/not present), which is the dysfunctional side. The rightward horizontal axis represents presence of performance (the attribute is working/present), which is the functional side. A respondent needs to answer one state out of Like, Must-be, Neutral, Live-with, and Dislike from the functional side (Rashid et al., 2011). The respondent needs to do the same for the dysfunctional side. The combination of answers determines how and what the respondent considers the underlying attribute.
3. DATA
3.1. Data Descriptions
Data for this study were obtained from a list of individuals who had signed up for information user membership of the National Nanotechnology Policy Centre. As of December 2015, the membership list contained valid email addresses of 5,251 individual members. The list was used as the population for an internet survey. All 5,251 individuals were e-mailed an invitation letter containing a URL link into our questionnaire with Google or Naver forms.
A total of 130 questionnaires were completed and returned after two email reminders. The adjusted response rate was 2.5%. Even though a nanotechnology web-based portal as a scientific information network serves a relatively small size of target audience (Schön, Hellmers, & Thomaschewski, 2014), this level of response rate may be well short of what should be a reasonable response rate in empirical studies of professionals and practitioners in science, technology, and industrial fields. What caused this low response level is still yet to be explained, low response rate is frequently reported in internet surveys fielded to professionals and indicated as one of the fatal limitations of internet survey by experienced traditional and internet survey researchers in Korea (Choi, Myeong, & Lee, 2008).
3.2. Sample Descriptions
The questionnaire for this study included certain items related to demographic characteristics, institutional affiliation, frequently accessed web-based portals, and the purposes of access to web portals, as well as those items suitable for the Kano model. Demographically, the sample of this study was composed of 118 male respondents (90.8%) and 12 female respondents (9.2%). In terms of institutional affiliation, the study sample consisted of 47 university respondents (36.2%), 31 government research institute (GRI) respondents (23.8%), and 52 business respondents (40.0%). There were five major occupational groups: professors (n=29, 22.3%), GRI researchers (n=28, 21.5%), private firm researchers (n=20, 15.4%), executives (n=18, 13.8%), employees (n=13, 10.0%), and others (n=21, 14.6%). Among the 130 respondents in our sample, 35.4% reported they frequently accessed special nanotechnology web portals, 26.2% Google Scholar, 36.2% more horizontal web portals, and the remaining reported that they had never accessed any web-based portals. Finally, of 127 respondents who reported they accessed any web sites, 59.1% reported that they accessed web portals for the purpose of performing research and development, 23.6% for the purpose of commercialization, and the remainder for other purposes such as collecting information or materials for policy research, learning about nanotechnology, and personal interest.
Table 1
Characteristics of Respondents
| Variable | Frequency | Variable | Frequency | ||||
|---|---|---|---|---|---|---|---|
| Gender | Female | 12(09.2) | Occupation | Others | Students3 | 2(01.5) | |
| Male | 118(90.8) | Unspecified | 11(08.5) | ||||
| Institutional Affiliation | University | 47(36.2) | Web Portal Frequently Accessed | Nanotechnology Web Portals | 46(35.4) | ||
| GRI1 | 31(23.8) | Google Scholar | 34(26.2) | ||||
| Industry | 52(40.0) | Horizontal Web Portals4 | 47(36.2) | ||||
| Occupation | Professor | 29(22.3) | Never accessed | 3(02.2) | |||
| Researcher(GRI) | 28(21.5) | Purpose of access5 | To perform R&D | 75(59.1) | |||
| Researcher(Firm) | 20(15.4) | To commercialize | 30(23.6) | ||||
| Executive(Firm) | 18(13.8) | To do policy research | 14(11.0) | ||||
| Employee(Firm) | 13(10.0) | To learn nanotechnology | 4(03.1) | ||||
| Others | Researcher2 | 9(06.9) | Because of Personal interest | 4(03.1) | |||
Notes: 1) GRI stands for government research institutes; 2) Researcher includes post-doctoral students and researchers employed by universities; 3) Students include only graduate students; 4) Horizontal Web Portals mean generic web portals such as Google, Naver, and Daum; and 5) The number of respondents is 130 except the ‘purpose of access’ variable (N=127).
4. METHODS OF ANALYSIS
Table 2 shows a 22-item set of features and functions required of a nanotechnology web portal drawn from the existing body of literature (Fernandes, Raja & Austin, 2005; Tatnall et al., 2005; Gaheen et al., 2014). This includes information content requirement (10 items), community communication requirement (six items), collaborative requirement (five items), and news feeding requirement (one item).
Table 2.
Required Features and Functions of Nanotechnology Web Portal
| Requirement | Description |
|---|---|
| Information Content<br>Legal<br>Technical<br>Market<br>Financial<br>Human<br>Academic<br>Facility<br>Statistical<br>Translated<br>R&D<br>Commercial | <br>Laws & regulations on nanotechnology development and commercialization<br>Nanotechnology trends, patents,<br>Nano-industry market trend reports, related issue papers<br>Financial assistance<br>Professionals and university graduates in nano-science and technology<br>Scholarly journal articles<br>Nanotechnology infrastructure such as facilities and equipment<br>Statistics including infographics, big data analytics<br>Translations of legal/policy, technical and market information overseas<br>Government R&D projects<br>Technology transfer, licensing, venture assistance, etc. |
| Communication<br>Linkage<br>Curation<br>Q&A<br>Chatroom<br>Article review<br>Sharing | <br>Connection to related public and private entities, web sites, etc.<br>Experts’ curation of nanotechnology<br>Q&As<br>Chat rooms (e.g., by subject)<br>Reviews of newly published scholarly articles<br>Assisting exchange of information among experts and institutions |
| Collaboratives<br>Collaboratives<br>Simulation<br>Big Data Analytics<br>Co-authoring<br>Test-Bed | <br>Virtual collaborative research mechanism<br>Computational science and simulation<br>Big Data Analytics<br>Co-authoring academic and business articles<br>Test-Bed |
| Newsfeeding<br>News | <br>News and news feed (events, meetings, conference) |
Notes: R&D, Research and Development; Q&A, Question and Answer.
To analyze the Kano questionnaire, we used the Kano method (provision/non-provision-based mode) (Table 3), which is designed to assess asymmetries in web users’ feelings based on hypothesized provision and non-provision of web portal features and functions (Mikulić & Prebežac, 2011). In doing this, this study utilized measures and procedures suggested by Plehn, Floker, Meissner, and Plehn (2016)—the most frequent-response categorization, customer satisfaction (dissatisfaction) coefficient, category strength and total strength, and Fong test (Kano, 1984; Timko, 1993; Fong, 1996; Lee & Newcomb, 1997).
Table 3
Examples of Functional and Dysfunctional Questions in the Kano Model
| Functional questions<br>If legal information is provided in the nanotechnology web portal, how do you feel? | • I like it that way<br>• It must be that way<br>• I am neutral<br>• I can live with it that way<br>• I dislike it that way |
| Dysfunctional questions<br>If legal information is not provided in the nanotechnology web portal, how do you feel? | • I like it that way<br>• It must be that way<br>• I am neutral<br>• I can live with it that way<br>• I dislike it that way |
The most frequent-response categorization is the hallmark of the original Kano model, in which individual requirements of web portal users are classified into one of the six categories of Must-be, One-dimensional, Attractive, Indifference, Reverse, or Questionable (Table 4) on the basis of the highest frequency response. In the standard Kano model, the dominant view of web portal users is represented by the most frequent response (Plehn et al., 2016).
Table 4
Kano Evaluation Table Based on Responses to Functional and Dysfunctional Questions
| Functional Answer | Dysfunctional Answer | ||||
|---|---|---|---|---|---|
| Like | Must-be | Neutral | Live-with | Dislike | |
| Like | Q | A | A | A | O |
| Must-be | R | I | I | I | M |
| Neutral | R | I | I | I | M |
| Live-with | R | I | I | I | M |
| Dislike | R | R | R | R | Q |
A: Attractive; M: Must-be; O: One-dimensional; I: Indifferent; Q: Questionable; R: Reverse
Customer satisfaction (dissatisfaction) coefficient (Timko, 1993) is introduced as another alternative measure to the standard Kano method to make possible a better understanding of service or product needs. The satisfaction (dissatisfaction) coefficient indicates the extent to which the provision (non-provision) of a requirement in a web portal increases users’ satisfaction (dissatisfaction). Using this customer satisfaction measure, the Kano model can help establish the selection criteria for the web portal features and functions that have the greatest influence on user satisfaction (Shahin, Pourhmidi, Antony, & Park, 2013). The customer satisfaction (CS) coefficient ranges from 0 to 1, and the customer dissatisfaction (CD) coefficient ranges from -1 to 0. As suggested in Plehn et al. (2016), we set a cutoff value of 0.5; values above 0.5 or below -0.5 indicate a relevant degree of satisfaction or dissatisfaction, respectively, as calculated below.
Customer satisfaction (CS) coefficient. <math xmlns="http://www.w3.org/1998/Math/MathML"> <mfrac> <mtext>A+O</mtext> <mtext>A+O+M+I</mtext> </mfrac> </math>, [0 ~ 1]
Customer dissatisfaction (CD) coefficient. <math xmlns="http://www.w3.org/1998/Math/MathML"> <mtext>(-1)</mtext> <mfrac> <mtext>O+M</mtext> <mtext>A+O+M+I</mtext> </mfrac> </math>, [-1 ~ 0]
The strength of the classification of a portal requirement into one of the six categories was defined as the category strength and total strength as used in Lee and Newcomb (1997). Category strength is used to measure the extent to which a web portal feature is closely classified to a Kano category. It is operationalized as the percentage difference of highest category above the next-highest category. Web portal requirements with category strength below 6 percent are considered to belong to the mixed (Plehn et al., 2016) or combination [Italics Lee & Newcomb, 1997, p. 103] category.
The total strength measure is used to classify features with the category strength above 6 percent. Total strength is defined as “the total percentage of attractive, one-dimensional, and must-be responses” for a web portal requirement (Lee & Newcomb 1997). If the total strength is high, the feature with the high percentage on the total strength can be considered to be required, even though the item (feature) fails to meet the 6% condition with a 90% confidence level for category strength.
The Fong test (Fong, 1996) is utilized to supplement the classification based upon category strength measure. This test checks whether an assignment of a web portal requirement to individual Kano categories is statistically significant or not (Plehn et al., 2016). The test value is calculated to determine the statistical significance of Kano responses at a 90% confidence level. This value is compared with the absolute values of the difference between the two most frequent responses, a and b. An assignment is considered to statistically significant if the absolute value of the difference of a and b is greater than the test value, as calculated below.
<math xmlns="http://www.w3.org/1998/Math/MathML"> <mtext>|a-b| < 1.65 x</mtext> <msqrt> <mfrac> <mtext>(a+b)▶(2n-a-b)</mtext> <mtext>2▶n</mtext> </mfrac> </msqrt> </math>
5. RESULTS
Table 5 summarizes the Kano-categorizations of web portal requirements and related evaluations and statistics for university respondents, and Figure 2 displays the CS-coefficient matrix for university respondents.
The Kano-categorization for university users indicates that most web portal requirements are considered largely as either of one-dimensional or indifferent attributes. Only nine of 23 web portal requirements were categorized as one-dimensional attributes; these included legal, technical, financial, human, academic, statistical, R&D project, and commercial information. These requirements increase satisfaction if provided and decrease satisfaction if not provided. All communication-related requirements and collaboration-related requirements, together with the news requirement, were classified as indifferent. These communication- and collaboration-related features do not influence satisfaction and dissatisfaction. Facility information (e.g., nanotechnology equipment and facilities) was categorized as a must-be attribute, meaning its non-provision causes absolute dissatisfaction.
The Fong-test results revealed that the assignments of these requirements into individual attribute-categories were mostly not statistically significant. Only six of 23 requirements were statistically significant, all of which were communication- or collaboration-related requirements. This means that while the assignment of information-content-related features was not conclusive, the classification of communication- and collaboration-related features was significantly distinct in statistical terms. Meanwhile, a test-based category strength values suggested by Lee and Newcomb (1997) revealed quite different results from the Fong-test. All requirements except for financial, academic, and facility information had six or higher values in term of category strength, whereas those requirements that were significant in the Fong test still proved to be factors with six or higher category strength values. Despite the inconsistent test results, it is clear that indifferent attribute-categorization will be quite conclusive and considered not necessary as seen in the size of total strength values on these features.
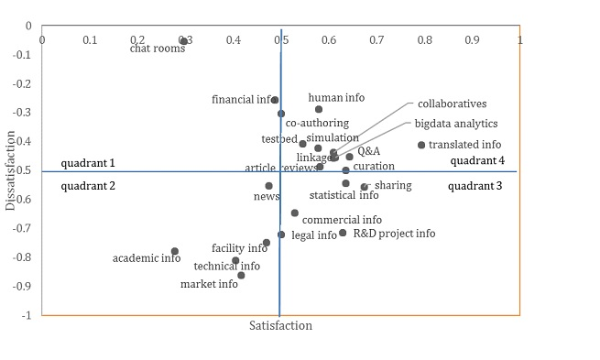
The CS-coefficient matrix for university respondents indicates that features were relatively unevenly dispersed across the four quadrants. As shown in the indifferent attribute classification in Figure 2, most communication- and collaboration-related features were allocated in quadrant 1, having less influence on either dissatisfaction or satisfaction. Contrarily, big data analytics and article reviews, and human and financial information will increase satisfaction if provided (quadrant 3). Commercial and academic information (quadrant 2) have the potential to cause dissatisfaction if not provided. Legal, statistical, market, R&D project, and facility information (quadrant 4) can increase satisfaction if provided.
Table 5
Evaluation of the Kano-Categorizations for University Respondents
| Kano Model | CS-CD Coefficient | Strength | Fong Test | ||||||||||
|---|---|---|---|---|---|---|---|---|---|---|---|---|---|
| M | O | A | I | R | Q | Sum | Category | CS | CD | Total | Category | ||
| legal info | 8 | 12 | 7 | 2 | 9 | 6 | 44 | O | 0.655 | -0.690 | 61.4 | 6.8 | n.s. |
| technical info | 12 | 17 | 4 | 3 | 5 | 3 | 44 | O | 0.583 | -0.806 | 75.0 | 11.4 | n.s. |
| market info | 12 | 17 | 4 | 3 | 5 | 3 | 44 | O | 0.583 | -0.806 | 75.0 | 11.4 | n.s. |
| financial info | 3 | 11 | 9 | 7 | 6 | 8 | 44 | O | 0.667 | -0.467 | 52.3 | 4.5 | n.s. |
| human info | 5 | 12 | 8 | 9 | 7 | 3 | 44 | O | 0.588 | -0.500 | 56.8 | 6.8 | n.s. |
| academic info | 11 | 12 | 0 | 11 | 7 | 3 | 44 | O | 0.353 | -0.676 | 52.3 | 2.3 | n.s. |
| facility info | 14 | 13 | 6 | 4 | 6 | 1 | 44 | M | 0.514 | -0.730 | 75.0 | 2.3 | n.s. |
| statistical info | 10 | 13 | 6 | 3 | 8 | 4 | 44 | O | 0.594 | -0.719 | 65.9 | 6.8 | n.s. |
| translated info | 5 | 7 | 7 | 11 | 8 | 6 | 44 | I | 0.467 | -0.400 | 43.2 | 6.8 | n.s. |
| R&D project info | 9 | 13 | 5 | 6 | 8 | 3 | 44 | O | 0.545 | -0.667 | 61.4 | 9.1 | n.s. |
| commercial info | 10 | 11 | 6 | 9 | 4 | 4 | 44 | O | 0.472 | -0.583 | 61.4 | 2.3 | n.s. |
| linkage | 3 | 11 | 4 | 19 | 4 | 3 | 44 | I | 0.405 | -0.378 | 40.9 | 18.2 | sig |
| curation | 2 | 12 | 6 | 18 | 3 | 3 | 44 | I | 0.474 | -0.368 | 45.5 | 13.6 | n.s. |
| Q&A | 3 | 13 | 3 | 19 | 4 | 2 | 44 | I | 0.421 | -0.421 | 43.2 | 13.6 | n.s. |
| chat rooms | 2 | 0 | 5 | 22 | 3 | 12 | 44 | I | 0.172 | -0.069 | 15.9 | 22.7 | sig |
| article reviews | 2 | 13 | 6 | 16 | 5 | 2 | 44 | I | 0.514 | -0.405 | 47.7 | 6.8 | n.s. |
| sharing | 3 | 12 | 6 | 17 | 5 | 1 | 44 | I | 0.474 | -0.395 | 47.7 | 11.4 | n.s. |
| collaboratives | 2 | 7 | 9 | 18 | 5 | 3 | 44 | I | 0.444 | -0.250 | 40.9 | 20.5 | sig |
| simulation | 4 | 8 | 7 | 18 | 4 | 3 | 44 | I | 0.405 | -0.324 | 43.2 | 22.7 | sig |
| bigdata analytics | 2 | 11 | 8 | 15 | 6 | 2 | 44 | I | 0.528 | -0.361 | 47.7 | 9.1 | n.s. |
| co-authoring | 2 | 7 | 9 | 17 | 6 | 3 | 44 | I | 0.457 | -0.257 | 40.9 | 18.2 | sig |
| testbed | 3 | 8 | 6 | 19 | 6 | 2 | 44 | I | 0.389 | -0.306 | 38.6 | 25.0 | sig |
| news | 5 | 10 | 8 | 13 | 6 | 2 | 44 | I | 0.500 | -0.417 | 52.3 | 6.8 | n.s. |
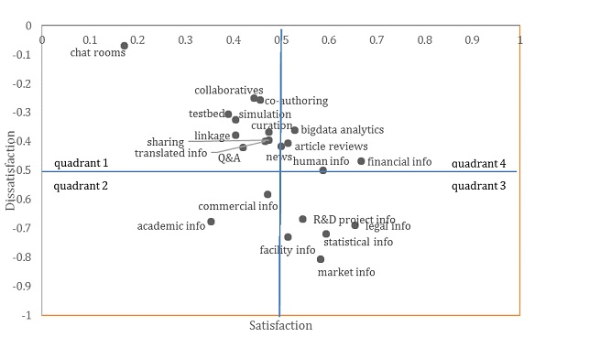
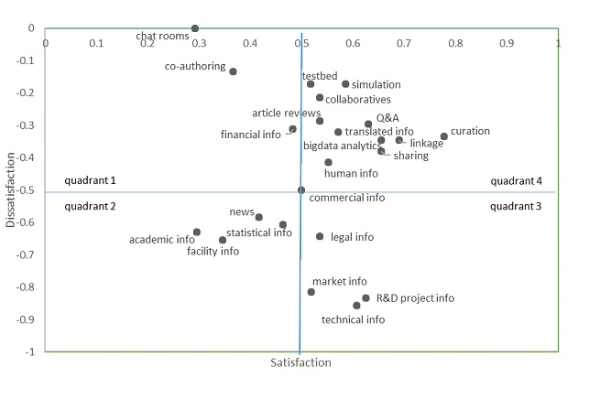
Table 5 summarizes the Kano-categorizations of web portal requirements and related evaluations and statistics for government research institute respondents, and Figure 3 displays the related CS-coefficient matrix.
The Kano-categorization for government research institute respondents (Table 6) shows that web portal requirements were classified mostly as one-dimensional, attractive, or indifferent attributes. Facility information was classified as a must-be attribute. Legal, technical, market, statistical, R&D project information, and sharing were considered to be one-dimensional attributes, and curation and Q&A to be attractive. However, many of the information content features, such as financial, human, academic information, and communication- and collaboration-related features including chat rooms, article reviews, collaborative, co-authoring, and testbed were still considered indifferent attributes. Additionally, there were four requirements (commercial information, linkage, simulation, and big data analytics) that could not be assigned to any one Kano-category.
The Fong-test results indicated that the assignments of these requirements into individual attribute-categories were mostly not statistically significant. There were only two of 23 requirements that were statistically significant. These two requirements, chat rooms and co-authoring, are indifferent attributes. As seen for the university respondents, the Kano-categorization in this study turned out to be inconclusive for the majority of the features shown in Table 5. The results of Fong test were quite different from the category strength test suggested in Lee and Newcomb (1997).
The CS-coefficient matrix for university respondents indicated that communication- and collaboration-related requirements were mainly allocated to quadrant 4, meaning that these features have the potential to improve satisfaction if provided. It also revealed that certain features, such as market, R&D project, and technical information, will considerably decrease satisfaction if not provided (quadrant 3). In addition, facility and academic information has the potential to cause dissatisfaction, even though the impact size is relatively small (quadrant 2).
Table 6
Evaluation of the Kano Categorizations for Government Research Institute Respondents
| Kano Model | CS-CD Coefficient | Strength | Fong Test | ||||||||||
|---|---|---|---|---|---|---|---|---|---|---|---|---|---|
| M | O | A | I | R | Q | Sum | Category | CS | CD | Total | Category | ||
| Legal information | 6 | 12 | 3 | 7 | 2 | 1 | 31 | O | 0.536 | -0.643 | 67.7 | 16.1 | n.s. |
| Technical information | 10 | 14 | 3 | 1 | 2 | 1 | 31 | O | 0.607 | -0.857 | 87.1 | 12.9 | n.s. |
| Market | 10 | 12 | 2 | 3 | 4 | 0 | 31 | O | 0.519 | -0.815 | 77.4 | 6.5 | n.s. |
| Financial | 4 | 5 | 9 | 11 | 1 | 1 | 31 | I | 0.483 | -0.310 | 58.1 | 6.5 | n.s. |
| Human | 4 | 8 | 8 | 9 | 2 | 0 | 31 | I | 0.552 | -0.414 | 64.5 | 3.2 | n.s. |
| Academic | 9 | 8 | 0 | 10 | 4 | 0 | 31 | I | 0.296 | -0.630 | 54.8 | 3.2 | n.s. |
| Facility | 11 | 6 | 3 | 6 | 4 | 1 | 31 | M | 0.346 | -0.654 | 64.5 | 16.1 | n.s. |
| Statistical | 8 | 9 | 4 | 7 | 3 | 0 | 31 | O | 0.464 | -0.607 | 67.7 | 3.2 | n.s. |
| Translated | 4 | 5 | 11 | 8 | 1 | 2 | 31 | A | 0.571 | -0.321 | 64.5 | 9.7 | n.s. |
| R&D project information | 8 | 12 | 3 | 1 | 6 | 1 | 31 | O | 0.625 | -0.833 | 74.2 | 12.9 | n.s. |
| Commercial information | 7 | 5 | 7 | 5 | 4 | 3 | 31 | M/A | 0.500 | -0.500 | 61.3 | 0.0 | n.s. |
| Linkage | 0 | 10 | 10 | 9 | 1 | 1 | 31 | O/A | 0.690 | -0.345 | 64.5 | 0.0 | n.s. |
| Curation | 0 | 9 | 12 | 6 | 2 | 2 | 31 | A | 0.778 | -0.333 | 67.7 | 9.7 | n.s. |
| Q&A | 2 | 6 | 11 | 8 | 2 | 1 | 30 | A | 0.630 | -0.296 | 63.3 | 9.7 | n.s. |
| Chat rooms | 0 | 0 | 7 | 17 | 0 | 7 | 31 | I | 0.292 | 0.000 | 22.6 | 32.3 | sig |
| Article reviews | 2 | 6 | 9 | 11 | 1 | 2 | 31 | I | 0.536 | -0.286 | 54.8 | 6.5 | n.s. |
| Sharing | 0 | 11 | 8 | 10 | 1 | 1 | 31 | O | 0.655 | -0.379 | 61.3 | 3.2 | n.s. |
| Collaboratives | 1 | 5 | 10 | 12 | 1 | 2 | 31 | I | 0.536 | -0.214 | 51.6 | 6.5 | n.s. |
| Simulation | 0 | 5 | 12 | 12 | 1 | 1 | 31 | A/I | 0.586 | -0.172 | 54.8 | 0.0 | n.s. |
| Bigdata analytics | 0 | 10 | 9 | 10 | 1 | 1 | 130 | O/I | 0.655 | -0.345 | 61.3 | 0.0 | n.s. |
| Co-authoring | 0 | 4 | 7 | 19 | 0 | 1 | 31 | I | 0.367 | -0.133 | 35.5 | 38.7 | sig |
| Testbed | 0 | 5 | 10 | 14 | 0 | 2 | 31 | I | 0.517 | -0.172 | 48.4 | 12.9 | n.s. |
| News | 8 | 6 | 4 | 6 | 3 | 4 | 31 | M | 0.417 | -0.583 | 58.1 | 6.5 | n.s. |
Finally, according to the perceptions of industry respondents, 18 of 23 requirements were allocated to one of the three attributes of must-be, one-dimensional, or attractive. Two requirements were considered as must-be, 11 as one-dimensional, and two as attractive attributes, with the two remaining requirements allocated to two categories for each. Almost one-dimensional-attribute categories are those features related to communication and collaboration requirement. Technical, market, academic, and facility are considered as must-be attributes. Human and translated information are considered to be attractive attributes. Financial information, chat rooms, co-authoring, and testbed are perceived as indifferent attributes.
The Fong-test results indicate that the Kano-categorization was not statistically significant for most requirements in Table 6. Only four requirements—academic info, chat rooms, sharing, and co-authoring—were statistically significant, leaving the Kano-categorization inconclusive for the majority of the features shown in Table 6. The results of Fong test are largely consistent with results of the category strength test (Lee and Newcomb, 1997).
The CS-coefficient matrix for industry respondents shown in Figure 4 reveals that most information content requirements were allocated at lower quadrants and almost all communication- and collaboration-related requirements were allocated to upper quadrants in Table 7. Almost all communication- and collaboration-related requirements were located in quadrant 4. Among these requirements, translated information had a greater impact on satisfaction of industry users, if provided. Statistical, commercial, legal, and R&D project information located in quadrant 3 are considered to have decreasing effect on satisfaction, if not provided. Academic, technical, market and facility information, categorized as must-be attributes, are located at quadrant 2. These features will a considerable potential to cause dissatisfaction if not provided.
Table 7
Evaluation of the Kano-Categorizations for Industry Respondents
| Kano Model | CS-CD Coefficient | Strength | Fong Test | ||||||||||
|---|---|---|---|---|---|---|---|---|---|---|---|---|---|
| M | O | A | I | R | Q | Sum | Category | CS | CD | Total | Category | ||
| Legal information | 12 | 14 | 4 | 6 | 11 | 2 | 49 | O | 0.500 | -0.722 | 61.2 | 4.1 | n.s. |
| Technical information | 18 | 12 | 3 | 4 | 10 | 2 | 49 | M | 0.405 | -0.811 | 67.3 | 12.2 | n.s. |
| Market information | 18 | 13 | 2 | 3 | 11 | 2 | 49 | M | 0.417 | -0.861 | 67.3 | 10.2 | n.s. |
| Financial information | 5 | 5 | 14 | 15 | 9 | 1 | 49 | I | 0.487 | -0.256 | 49.0 | 2.0 | n.s. |
| Human information | 6 | 5 | 17 | 10 | 10 | 1 | 49 | A | 0.579 | -0.289 | 57.1 | 14.3 | n.s. |
| Academic information | 18 | 10 | 0 | 8 | 9 | 4 | 49 | M | 0.278 | -0.778 | 57.1 | 16.3 | sig |
| Facility information | 13 | 11 | 4 | 4 | 12 | 5 | 49 | M | 0.469 | -0.750 | 57.1 | 2.0 | n.s. |
| Statistical information | 5 | 13 | 8 | 7 | 11 | 5 | 49 | O | 0.636 | -0.545 | 53.1 | 4.1 | n.s. |
| Translated information | 3 | 11 | 16 | 4 | 14 | 1 | 49 | A | 0.794 | -0.412 | 61.2 | 4.1 | n.s. |
| R&D project information | 11 | 14 | 8 | 2 | 12 | 2 | 49 | O | 0.629 | -0.714 | 67.3 | 4.1 | n.s. |
| Commercial information | 12 | 10 | 8 | 4 | 12 | 3 | 49 | M/R | 0.529 | -0.647 | 61.2 | 0.0 | n.s. |
| Linkage | 2 | 19 | 9 | 16 | 2 | 1 | 49 | O | 0.609 | -0.457 | 61.2 | 6.1 | n.s. |
| Curation | 1 | 21 | 7 | 15 | 4 | 1 | 49 | O | 0.636 | -0.500 | 59.2 | 12.2 | n.s. |
| Q&A | 0 | 19 | 8 | 15 | 5 | 2 | 49 | O | 0.643 | -0.452 | 55.1 | 8.2 | n.s. |
| Chat rooms | 2 | 0 | 11 | 24 | 2 | 10 | 49 | I | 0.297 | -0.054 | 26.5 | 26.5 | sig |
| Article reviews | 3 | 18 | 7 | 15 | 3 | 3 | 49 | O | 0.581 | -0.488 | 57.1 | 6.1 | n.s. |
| Sharing | 2 | 22 | 7 | 12 | 4 | 2 | 49 | O | 0.674 | -0.558 | 63.3 | 20.4 | sig |
| Collaboratives | 1 | 17 | 8 | 15 | 4 | 4 | 49 | O | 0.610 | -0.439 | 53.1 | 4.1 | n.s. |
| Simulation | 2 | 17 | 9 | 17 | 2 | 2 | 49 | O/I | 0.578 | -0.422 | 57.1 | 0.0 | n.s. |
| Big data analytics | 2 | 18 | 9 | 15 | 4 | 1 | 49 | O | 0.614 | -0.455 | 59.2 | 6.1 | n.s. |
| Co-authoring | 1 | 13 | 10 | 22 | 2 | 1 | 49 | I | 0.500 | -0.304 | 49.0 | 18.4 | sig |
| Testbed | 0 | 18 | 6 | 20 | 3 | 2 | 49 | I | 0.545 | -0.409 | 49.0 | 4.1 | n.s. |
| News | 10 | 11 | 7 | 10 | 8 | 3 | 49 | O | 0.474 | -0.553 | 57.1 | 2.0 | n.s. |
6. DISCUSSION AND CONCLUSIONS
The sector was an important factor in explaining the relationships between web portal requirements and user satisfaction/expectations. It is desirable to have a comprehensive “one-stop shopping” (Chau et al., 2006) web portal to support web portal requirements for current and potential users in all sectors. In doing this, the bottom line is meeting at least basic and performance requirements of a web portal (i.e., must-be and one-dimensional). The preceding description of results presents some interesting findings. First, there are differences in perceptions of nanotechnology web portal requirements among users in the national systems of innovation. Second, despite these disparities among three groups of users, there are similarities that deserve attention when developing web portals.
As for web portal requirements, university users’ perceptions were predominantly information-contents centered. Industrial users considered necessary for almost all web portal features, whether they were related to information content, communication, or collaboration. Government research institute users were in-between. There are several possible explanations for the tendency of industrial users to be more concerned about communication- and collaboration-related features. First, successful commercialization needs consistent exploratory R&D (Lee et al., 2013), which can be further facilitated with research facility or equipment, whether offline or online, to bridge inter-sectoral boundaries (Anderegger, Zoller, & Boutellier, 2013). From the perspective of firms that have outdated facilities (Ministry of Knowledge Economy, 2011; National Science and Technology Council, 2016), online communication and collaboration will be an efficient way to perform R&D and collect related information.
Second, despite these disparities among three groups of users, there are similarities among them which deserve due attention when developing web portals. While their impact size will vary, collaboration and communication-related features has the potential to entertain users in the university, government research institute, and industry sectors. Academic, market, and facility information features are considered basic features. Chat rooms are not considered as necessary for any of the sectoral actors. This is because ‘chat-room’ or ‘chatting’ conveys a negative connotation in Korea.
In this study, we tried to identify similarities and dissimilarities in Kano-categorizations of features and functions required of nanotechnology among actors in universities, government research institutes and industry. We found that there are sheer differences and commonalities in perceptions of nanotechnology web portal requirements among actors in the national systems of innovation.
This study has some limitations, and therefore the results should be cautiously interpreted. The small sample size hinders generalizations in time and space. Inconsistent test results will make correct assignment of individual Kano attributes unstable and untenable. This is possibly because of the sample size problem or the problem of respondents’ familiarity with Kano-questionnaire. Finally, our study provides no explanations of why respondents felt the way they reported.
- Submission Date
- 2017-01-11
- Revised Date
- Accepted Date
- 2017-04-18